Currently, about 80% of the worldwide energy demand is covered by non-renewable fossil fuels. This results in the emission of pollutants and causes global warming. Hydrogen gas (H
2) is an ideal future energy carrier with a has a high energy density per unit mass [
1]. In the presence of oxygen, it can be converted to either electricity by fuel cells [
2] or mechanical work by combustion engines, water being the sole by-product. This makes hydrogen gas a clean energy carrier. Currently, dominant technologies for hydrogen production use fossil fuels. These include natural gas steam reforming (50% world’s production), oil reforming (30%), and coal gasification (18%) [
1,
3]. Besides electrolytic hydrogen generation from renewable energy sources, biologically produced hydrogen gas may contribute to a green economy. A particular field of interest is wastewater treatment, since it is worldwide established with a very long technological history [
4]. Over 50% of lost waste resources are contained in wastewater. Therefore, major drivers are pushing to recover and regain these substances. The European Union is currently investing substantial resources into bioeconomy funded by the European Commission under the Horizon 2020 framework.
Anaerobic phototrophs, such as the purple non-sulfur bacterium
Cereibacter sphaeroides (formerly
Rhodobacter sphaeroides [
5,
6]), are promising candidates for the photobiotechnological production of hydrogen gas from organic waste and waste water [
7,
8,
9].
Rhodobacteraceae belong to the metabolically versatile group of alpha- or beta-proteobacteria and primarily grow photoheterotrophically under anaerobic conditions [
10]. They are able to fix nitrogen and grow (photo-)heterotrophic via fermentation or via aerobic or anaerobic respiration on a number of organic substrates. Hydrogen production is catalyzed by nitrogenase activity during nitrogen-limited cultivation conditions. The specificity of purple bacteria is their ability to form the metabolic energy carrier ATP by anoxygenic photosynthesis using cyclic photosynthesis. The electrons can be derived from organic acids, e.g., from biowaste [
11], tofu [
12], whey [
13], congee [
14], apple pomace [
15], and wheat starch [
16]. The amount of H
2 produced is depended on the substrate and mediated by various metabolic pathways [
17].
The metabolism in general [
18] and photofermentative hydrogen production capabilities of
Cereibacter sphaeroides in particular [
19,
20,
21] have been analyzed in great detail. Usually, purple non-sulfur bacteria evolve molecular hydrogen as a by-product from ammonia synthesis catalyzed by the nitrogenase. However, ammonia synthesis takes only place under nitrogen-deficient conditions [
21]. Hence, hydrogen evolution is inhibited by high concentrations of nitrogenous substrates. This repression of the hydrogen evolving nitrogenase by fixed nitrogen is a major issue when using waste water as a substrate [
22,
23,
24].
Here we characterize
Cereibacter sphaeroides strain 2.4.1 substrain H2 that produces hydrogen gas in the presence of relatively high substrate organic nitrogen concentrations. Recently, we presented a first draft of its genome structure [
25]. Here, we present our results on genomic mutations, probably acquired during lab cultivation, that cause transcriptomic changes which help to explain decoupling of the cellular organic nitrogen status and hydrogen evolution. Thus, we present a deeper genomic and the first transcriptomic characterization of this substrain.
2.1. Bacterial Growth and Harvest
Cereibacter sphaeroides strain 2.4.1 substrain H2 was kindly provided by the research group of Jost Weber from the Technical University Dresden, Germany. It was originally bought from the Leibniz Institute DSMZ-German Collection of Microorganisms and Cell Cultures (Braunschweig, Germany) as
Rhodobacter sphaeroides DSM-No. 158. However, after years of cultivation in Weber’s group it accumulated the SNVs detailed in this work. The substrain was cultivated in a stirred tank reactor with a working volume of one liter in continuous mode with a dilution rate D = 0.1 h−1 under conditions outlined in [
20]. Samples for both, DNA and RNA analysis, were harvested after about 20 h of steady state conditions, as determined by hydrogen production rate and biomass concentration.
2.2. Nucleic Acid Preparation
Cells were separated from the culture medium by centrifugation (13,000×
g) and frozen at −80 °C. Cells for transcriptome analyses were resuspended in 1:5 RNAlater (life technologies, Darmstadt, Germany). Nucleic acids were extracted and isolated using the MasterPure
TM Complete DNA and RNA Purification Kit (epicentre, Hessisch Oldendorf, Germany) as described by the manufacturer. The nucleic acid pellet was resuspended in 50 µL TE-buffer, incubated for 15 min at 65 °C and subsequently prepared for sequencing.
2.3. DNA Sequencing
The isolated DNA was exempted from RNA contamination with RNase Cocktail
TM Enzyme Mix (Life Technologies). 2 µL were added to the tube followed by an incubation at 37 °C for 30 min. Sequencing was performed with Illumina MiSeq (1 × 150 nt) by Eurofins Genomics GmbH (Ebersberg, Germany). All sequence data are available at the NCBI sequence read archive (SRA) under BioProject ID PRJNA392388.
2.4. RNA Sequencing
DNA was degraded by TURBO DNA-free
TM Kit (life technologies) following the standard protocol. Ribosomal RNA was depleted with mRNA-ONLY
TM Prokaryotic mRNA Isolation Kit (epicentre, Hessisch Oldendorf, Germany), using the standard protocol. Sequencing was performed with Illumina MiSeq (1 × 150 nt) by Eurofins Genomics GmbH. All sequence data are available at the NCBI sequence read archive (SRA) under BioProject ID PRJNA392388.
2.5. Data Processing and Analysis
After a first assessment of sequence quality by FastQC (Version 0.11.2) we trimmed and clipped the sequence files using the FastX-Toolkit (Version 0.0.13). Indexing and mapping to the reference genome from NCBI (NZ_AKVW01000001.1) was performed with Bowtie2 (Version 2.1.0; [
26]). Samtools (Version 0.1.19; [
27]) converted the incurred SAM- to a BAM-file, which was sorted and indexed afterwards.
2.6. Genomic Characterization
From the resulting FastA file of the re-sequencing data, a consensus sequence was created with BLAST (Version 2.2.29), which delivers a text file with SNVs. The resulting sequences were compared with the reference genome (http://www.ncbi.nlm.nih.gov/nuccore/484336764). A multiple genome sequence alignment of all available
C. sphaeroides strains from the NCBI nucleotide database (ATCC 17025: CP000661.1; ATCC 17029: NC_009049.1, CP000579.1, CP000578.1; KD131: CP001152.1, NC_011963.1, CP001153.1, CP001151.1; WS8N: NZ_CM001161.1, NZ_CM001164.1, NZ_CM001163.1, NZ_CM001162.1; and 2.4.1: NZ_AKVW01000001.1, NZ_AKVW01000002.1, NZ_AKVW01000003.1, NZ_AKVW01000004.1, NZ_AKVW01000005.1, NZ_AKVW01000006.1, NC_009008.1) was performed with Mauve (Version 2.3.1; [
28]). For a better overview of evolutionary relationships between all six strains a phylogenetic tree from the Mauve output was generated using MegAlign (Version 11). The SIFT BLink tool (Version 1.03; [
29]) was used to predict potential effects of SNVs on enzyme functionality.
2.7. Transcriptomic Characterization
A read count analysis from the transcriptome data was carried out with Artemis [
30]. After normalization of the data by the R-package DESeq [
31], we analyzed the expression values in terms of different expression and genes of interest.
2.8. Homology Modelling
As a template to map the SNV affecting the σ
54 protein as part of the RNA polymerase holoenzyme, the X-ray structure from
PDB was used
5NSR [
32]. Tertiary protein structures were rendered using JMOL (Version 1.3; [
33]).
3.1. Genomic Characterization
The reference strain
Cereibacter sphaeroides strain 2.4.1 has two circular chromosomes (3,188,524 and 943,018 bp) and five plasmids (A–E with 114,179, 105,284, 100,827, 37,100 bp, respectively) and a GC-content of 66% [
10]. The complete genome encodes for 4,280 proteins and 67 RNAs. It was sequenced for the first time by the
University of Texas in 2001 [
34]. To our knowledge, eight commonly used strains, namely 2.4.1 (two genome sequences: NCBI BioProjects PRJNA57653, PRJNA40077; [
10,
35]), MBTLJ-13 (PRJNA316780, unpublished), MBTLJ-8 (PRJNA293258, unpublished), WS8N (PRJNA63267; [
36]), ATCC 17025 (PRJNA15755; [
35]), ATCC 17029 (PRJNA15754; [
35]) and KD131 (PRJNA31111; [
37]), have been sequenced. They are characterized by a wide genomic divergence. While the size of chromosome 1 is relatively constant among all strains, the size of chromosome 2 varies [
35].
We sequenced the genome of a
Cereibacter sphaeroides strain 2.4.1 substrain H2 (named
C.s. substrain H2 throughout this publication; BioProject ID PRJNA392388) that is a promising candidate for photofermentative hydrogen production from organic waste [
25].
shows the comparative genome structure and evolutionary diversity for all eight genome sequences. No genetic rearrangements between strain 2.4.1 and substrain H2 can be observed, which proofs the close genetic relatedness albeit phenotypic differences.
Choudhary et al. [
35] postulated that the divergence between
Cereibacter strains, in particular of chromosome II sequences, is based on inclusion of genetic material, horizontal DNA transfer and rearrangements of genetic loci, respectively. They focused their analysis on strains 2.4.1, ATCC 17029 and ATCC 17025 and postulated a closer relationship of the former two. The variations can be explained by adaptions to different ecological niches, which results in formation of variable metabolic pathways [
35]. Our results support this finding. Most importantly, the genome sequence comparison shows no obvious structural difference between the reference strain
C.s. strain 2.4.1 and the substrain H2 ().
. Multiple genome alignment and bootstrap consensus genomic distance tree of available Cereibacter sphaeroides genome assemblies. Each color block identifies a region that aligns to part of another genome. Parts of the alignment which are colored mauve are conserved among all genomes, while portions colored differently are segments conserved only among individual strains. If drawn below the horizontal line, it aligns to the reverse complement. The consensus distance tree of this genomic alignment tree is inferred by neighbor-joining from 100 replicates based on the genomic alignment from. The bootstrap values are indicated at the branch points.
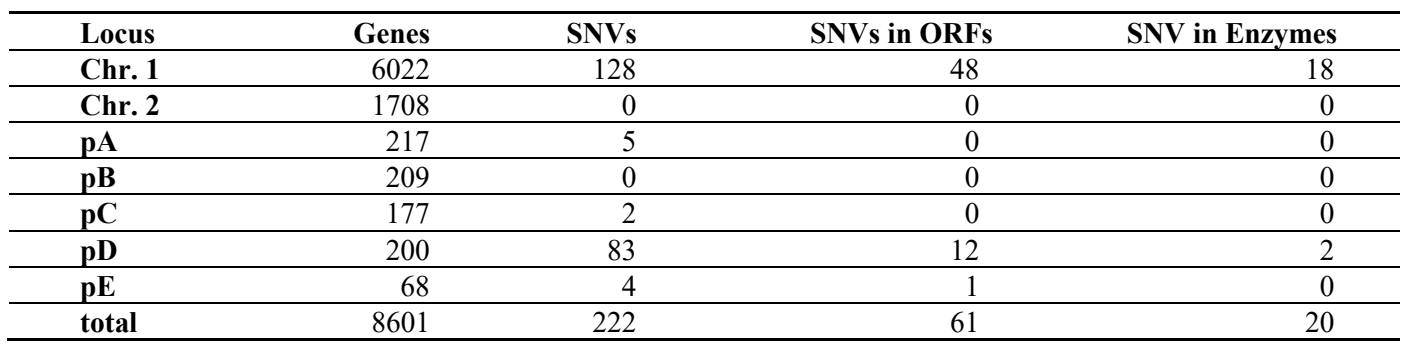
Since
C.s. substrain H2 shows no obvious genome-structure deviation from the reference strain, we analyzed the occurrences and distribution of genomic single nucleotide variances (SNVs). Therefore, we established a next generation sequencing data processing pipeline and identified 222 SNVs. The distribution of the SNVs is summarized in . Intergenic SNVs can either be neutral or have an influence on gene-expression if they are located, e.g., in a promotor region. Intragenic SNVs can be either neutral too, or lead to the substitution of amino acids that may affect enzyme functionality. However, since intragenic SNVs can lead to
trans-acting mutations, which can then potentially be transferred to other microorganisms, this study focuses on them. Of course, it cannot be ruled out that a intragenic SNV acts in
cis. Since we are focusing on intragenic SNVs that lead to amino acid exchanges, this would mean that the causative SNV has two functions. We consider this to be very unlikely.
. Allocation and classification of SNVs detected in the C.s. substrain H2 described in this work. Green numbers indicate SNVs that affect protein coding nucleotides. Of the 20 intragenic SNVs, 14 cause an amino acid exchange. See and for details.
Of all 222 SNVs 61 are within genomic open reading frames and protein coding sequences ().
Table 1. Overview about identified genomic SNVs in open reading frames (ORFs) and protein coding sequences in C.s. strain 2.4.1 substrain H2. The latter is further specified in Table 2.
Thereof, 41 SNVs are located within non-enzymatic proteins that are not obviously connected to metabolism. Of the remaining 20 enzyme coding sequence affecting SNVs, 15 cause amino acid exchanges within 14 enzymes (see for details). A bioinformatic prediction of the effect on enzyme functionality or protein function is positive for 5 enzymes.
. SNV-based amino acid substitutions within enzymes in C.s. strain 2.4.1 substrain H2. SNVs that are predicted to affect enzyme functionality are printed in bold. Genes expressed under the conditions examined are underlined. The effect on enzyme functionality was predicted using SIFT BLink Tool as described in material and methods.
With the genomic SNV analysis, we detected no obvious evidence, e.g., mutations in enzymes that are known to be involved in either hydrogen or nitrogen metabolism, that could explain elevated hydrogen evolutions rates in the presence of high nitrogen concentration. However, the genome-wide differential gene expression at three different substrate glutamate concentrations revealed global effects ().
. Heatmap of clustered gene expression data from chromosomes I and II under three different glutamate concentrations and anaerobic phototrophic growth. Red corresponds to high, white to low expression values. Expression data were elucidated from RNA-Seq read counts.
In order to concentrate on the effect of the genotype on the phenotypic observations, we checked which of the proteins from are expressed at all at high organic nitrogen concentrations (). Only the sigma-54 (σ
54) subunit of RNA-polymerase is both expressed under the conditions examined and the SNV exhibits a potential functional effect ().
. Result of combined genomic SNV, transcriptomic and predicted SNV effect analyses. Only the σ54 subunit of the RNA-polymerase holoenzymes matches all criteria.
In bacteria, the RNA polymerase core enzyme requires sigma factors for promoter recognition and to initiate transcription [
38,
39]. Sigma factors can be classified into two major families, the σ
70 and σ
54 family. Most sigma factors belong to the extensive σ
70 family, including housekeeping sigma factor σ
70 (RpoD) and alternative sigma factors (σ
38 (RpoS), σ
32 (RpoH) and σ
24 (RpoE)). They direct the binding of the RNA polymerase to the promoter consensus -10 (TATAAT) and -35 (TTGACA) sequences for transcription initiation [
39,
40]. The σ
54 family contains only one single member, RpoN (σ
54), which is structurally and functionally distinct from all other sigma factors. It directs binding of the RNA polymerase to the conserved -12 (TGC) and -24 (GG) promoter elements [
40].
The σ
54 factor (RpoN) is highly conserved in a large number of bacterial species. While it is not essential for growth, it is required for the expression of a wide variety of genes involved in many diverse functions including dicarboxylic acid transport, hydrogenase biosynthesis, and nitrogen fixation [
41]. In
C. sphaeroides at least the nitrogen fixation genes and the flagellar genes are transcribed from σ
54-dependent promoters. Most bacteria have a single σ
54 factor (encoded by
rpoN) that interacts with multiple bacterial enhancer-binding proteins which recognize specific binding sites to achieve the transcription of a specific set of genes [
42]. In contrast, it was previously shown that
C. sphaeroides encodes four σ
54 copies, RpoN1 to RpoN4, respectively [
43]. The similarity among these four copies is around 50% at the protein level. The σ
54 identified in our analyses () shows 100 % sequence identity (except the L420P amino acid exchange) to the RpoN2 protein (σ
54-2) of
C.s. strain WS8N (ID EGJ21523.1; [
36]) and high similarity with RpoN proteins of other strains (). Strikingly, the L420P (leucine to proline) amino acid exchange is specific to
C.s. 2.4.1 substrain H2 analyzed in this work.
. Excerpt of aligned Cereibacter RpoN protein sequences. Amino acids identical to the top sequence are represented by a dot. The L420P amino acid exchange is specific to C.s. 2.4.1 substrain H2 analyzed in this work. To the right, database IDs are shown.
The before mentioned unique L420P mutation in the RpoN2 protein prompted us to analyze how this amino acid might affect σ
54 function. Glyde et al. were able to analyze the structure of the
Escherichia coli K12 RNA polymerase associated with the of
Klebsiella pneumoniae σ
54 factor bound to the DNA promoter sequence [
32]. Part of the protein sequence of this sigma factor is shown in the alignment in . The identity and similarity of the
K. pneumoniae and
C.s. 2.4.1 H2 sequences are 32 % and 50 %, respectively. The 3D-molecule structure, shown in , clearly shows the binding of the helix-turn-helix motif of σ
54 to the DNA. Strikingly, the leucine at position 465, that is homologous to the leucine at position 420 in
C.s. 2.4.1 H2, is in close proximity to the DNA-binding helix-turn-helix motif (, red arrow). Under the assumption that the
C.s. 2.4.1 H2 RpoN protein resembles the structure of the
K. pneumoniae σ
54 protein and binds in a similar way to DNA, the exchange of leucine with proline will most likely affect the binding properties.
. Structural model of the RNA polymerase holoenzyme bound to DNA based on PDB 5NSR [
32]. Only the protein backbone with colored subunits is shown. The σ
54 protein is colored entirely in dark green. The leucine at position 465 in close proximity to the DNA-binding helix-turn-helix motif is shown as red wireframe (marked by the red arrow).
The σ
54-RNA polymerase holoenzyme complex forms a closed, transcriptionally silent loop that requires bacterial enhancer-binding proteins to start transcription [
44,
45]. Although initially identified for its role in nitrogen assimilation, σ
54 has been found to control many other physiological processes through different enhancer-binding proteins [
46]. Among those are the nitrogen regulatory protein C (NtrC) and the nitrogen fixation regulatory protein (NifA).
As already mentioned,
C. sphaeroides encodes four σ
54 copies. The L420P SNV is located in the rpoN2 gene encoding the σ
54-2 protein. The factor σ
54-1 was found to be activated by the specific enhancer-binding protein NifA [
43,
47,
48]. NifA is an important nitrogenase activator under nitrogen limiting conditions and a lesion in σ
54-1 was shown to impair growth on nitrogen free medium [
43]. The same study revealed that intact σ
54-2 is needed for the expression of flagellar genes. In contrary, Meijer and Tabita found no deviation from the wildtype with respect to nitrogen assimilation in a σ
54-1 disruption mutant [
49] under photofermentative growth in the presence of glutamate (the condition used in our experiments). This shows the strong dependence of sigma-factor and enhancer-binding protein effects on the metabolic state. Our findings point to an involvement of σ
54-2 in the regulation of the nitrogenase, as summarized in .
At high glutamate concentrations, this nitrogenous substrate can be converted by the glutamate synthetase to ammonium (NH
4+) and α-ketoglutarate. Compared to the glutamate synthetase, we measured a higher expression level of the glutamine synthetase that forms glutamine from glutamate and ammonium. In accordance with the elevated hydrogen evolution rate at high glutamate concentration we propose that the ammonia is derived from nitrogenase activity. Usually, the nitrogenase and uptake hydrogenase are co-regulated. This way, the cell is able to recycle the energy from hydrogen that was otherwise lost. Nitrogenases deviate at least one third of all electrons to hydrogen formation. The observed hydrogen evolution rates can only be explained by an impaired activity of the uptake hydrogenase in addition to sustained nitrogenase activity. Indeed, for the close relative
R. capsulatus it was shown that the uptake hydrogenase is independently regulated via a σ
70-RNA polymerase and a hydrogenase specific two-component signal transduction system (HupT/HupR) () [
50]. HupR is an important member of the NtrC family of σ
54 enhancer-binding proteins. Both, HupR and HupT are encoded and expressed in the substrain H2.
As shown above, the L420P mutation most likely affects σ
54-2–DNA binding properties. From our observations, we conclude that this in turn uncouples nitrogenase expression from the nitrogen state of the cell. In contrast, regulation of the hydrogenase remains unchanged, which ultimately leads to the observed nitrogen resistance of hydrogen production.
. Effect of the L420P SNV in σ54 on hydrogen evolution. We propose that the down regulation of nitrogenase expression at elevated glutamate concentrations is impaired by the SNV. In contrast, expression of the hydrogen consuming uptake hydrogenase, usually regulated in concert with the nitrogenase holoenzyme, is down regulated. In total, this leads to a net yield of hydrogen gas that is released into the environment. Our data show a high expression level of glutamine synthase. The conserved (bold) binding site motifs (underlined) for the nitrogen fixation regulatory protein NifA, the integration host factor (IHF) and σ54 (RpoN) are shown.
The datasets analyzed during the current study are available in the NCBI sequence read archive (SRA) under BioProject ID PRJNA392388 repository, http://www.ncbi.nlm.nih.gov/bioproject/PRJNA392388/.
We thank Karsten Helbig and Jost Weber from the Technical University Dresden, Germany, for providing the strain, sharing hydrogen yield data, and discussions.
Conceptualization, R.W.; Methodology, N.W. and R.W.; Software, N.W.; Validation, N.W. and R.W.; Formal Analysis, R.W.; Investigation, N.W.; Resources, R.W.; Data Curation, N.W.; Writing – Original Draft Preparation, R.W.; Writing – Review & Editing, N.W. and R.W.; Visualization, N.W. and R.W.; Supervision, R.W.; Project Administration, R.W.; Funding Acquisition, R.W.
Not applicable.
Not applicable.
This work was kindly supported by an SAB-funded (Central Development Agency of the Free State of Saxony, Germany) PhD fellowship to NW. For financial support, we thank the SMWK (State Ministry of Higher Education, Research and the Arts, Free State of Saxony, Germany) and by European Social Fund and the Free State of Saxony in the context of the “Europa fördert Sachsen” initiative (Project number: 100098189).
The authors declare that they have no known competing financial interests or personal relationships that could have appeared to influence the work reported in this paper.