1. Introduction: The “Global Change Data Base” (GCDB) as a Concept
Global climate change as a theme exerts certainly vast pressure on public opinion and calls for decisive solutions (not only during the presently ongoing COP 28 in Dubai: [
1]), including the strife for an efficient global energy system co-determined by diverging ethical values [
2,
3], based on the concept of evolutionary transition [
2] (p. 2), [
4,
5,
6,
7,
8,
9,
10] and supported by modelling.
1.1. The Objective of the GCDB
The
objective of this article and the described planned research work is that long-term (energy) economic developments need to be identified, visualised and analyzed by accepted databases and reorganised in a way allowing to draw conclusions on
real-world megatrends that influence policy decisions and should inform policy making. Thus, the author thinks that an extensive global interdisciplinary database is highly needed.
As a result of presently ongoing research work, preliminary conclusions can be drawn from the
GCDB and its analytical tool for the creation of (global to national) emission scenarios and with regard to the choice of (global to national) climate protection measures.
The GCDB wants to
complement classical energy modelling but not replace it.
1.2. Definition of the Intention of the GCDB and Its Analytical Tool
Our planet is afflicted by a grave climate crisis which already visibly turned into an irreversible climate catastrophe. Temporal dynamics of greenhouse gas emissions result from trends in global technical and economic development. Therefore, the core of the work resides in quantitatively identifying and comparing the techno-socio-economic contributions to environmental change [
11,
12,
13,
14,
15]. Dynamics of change for the emissions of greenhouse gases (mainly CO
2 from energy and also from land use change) are generated and the impact of the respective techno-socio-economic driving forces is estimated and assessed quantitatively. Over 2500 data sets of relevant parameters will describe the last decades’ developments for every country on the globe.
1.3. Situating This Work inside the Work Done on “Global Change”
What environmental protection efforts have been taken place until now and what can they teach us? Two conclusions are drawn from over three decades of work in “environmental protection” when taking a step back and revising one’s own earlier convictions:
1. The targets of climate protection are so
difficult to reach that use must be made of the potentially helping force of “tailwind”
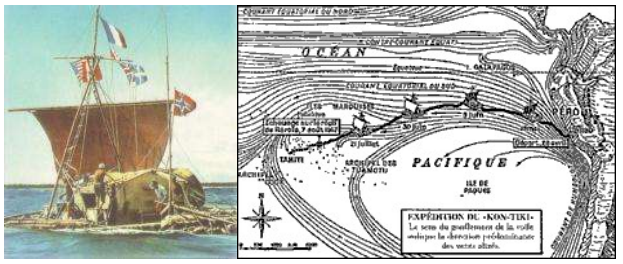
1. This is the meaning of the “Kon-Tiki” approach presented in Chapter 5.
2. The obstacles to reach the targets are so
difficult to surmount 2 that suitable strategies to create consensus among societal actors should be incorporated into the overall strategy. Global Change offers no opportunity to impose particular perspectives onto the global community, but we are all sitting in the same (sailing) boat. The resulting strategy is to create consensus solutions, meaning a profoundly Austrian and European, i.e., consensus-oriented approach.
A “training camp” for viewing reality from different perspectives is the web-based negotiation game “Surfing Global Change” developed by the author [
16] (pp. 103, 357) that can show how different various partial truths can be regarding the needed fight for climate protection.
For the looming climate catastrophe, there can only be a
solution in mutual agreement or there is no solution at all. The more a question is complicated (for modelling, [
17,
18]), the more it demands
consensus as a quality criterion for “validity of the solution”, because other criteria (such as mathematical exactitude, as is still required in grammar school tasks) is rather absent – and not applicable in practice. A basis for any consensus is joint reality perception. The GCDB exactly supports this goal.
States, regions and companies will be more obliged to create emission authorities than before
3. Clearer knowledge of the forces driving the emission development therefore seems appropriate. Background research is indicated in the context of these processes[
3] (p. 4) because there is a need for
dynamics-as-usual (d.a.u.) scenarios (on top of the currently known business-as-usual scenarios, [
19]) for an underlying future without measures
4 or with varying bundles of measures.
In addition, insight into the self-organizational evolutionary structural formation and structural change of the global (energy) economic system is sought, especially in possible gradual techno-socio-economic changes in states (“
blossoming evolution”, see [
20] pp. 103, 357).
1.4. The Envisaged Research Problem
The
research problem for this article consists in the transitory nature of any historic period, including the present one. This means that any climate protection measure must be evaluated against a
dynamics-as-usual scenarion, not merely against a
business-as-usual scenario, as common in
traditional energy modelling [
21,
22,
23], [
24] (p. 915). In fact, at present there are several
ongoing evolutionary structural shifts within all countries’ techno-socio-economic profiles which take place anyhow, and the GCDB supports to cognize these dynamics shifts – onto which any climate protection measure must build. An example is the continuing growth in technical efficiency and economic efficacity of energy use, and furthermore the gradual shift of economic sectors towards more service-oriented sectors in many countries.
1.5. Future Research and Forward Looking as a Framing Concept
The present article is contextualised within the larger domain of future research, also named
foresight or futurology.
Future research might enjoy wider usage as a term denoting “a science of the future” or futurology [
25,
26,
27,
28,
29,
30], but the preferred discussion in the present article is about “
forward looking” (FL), a term used by the European Union, and applied to global climate change [
31,
32,
33].
FL is defined as “concerned with or planning for the future” [
34], “planning for and thinking about the future in a positive way, especially by being willing to use modern methods or ideas” [
35], “favouring innovation and development; progressive” [
36], briefly “ahead of the times” [
37]. On the contrary, Investopedia [
38] perceives FL as “a business slang term for predictions about future business conditions” that is regulated by U.S. legislation “requiring public companies to include a disclaimer on all management discussions with investors in order to emphasize this point. This article, however, chooses the opposite strategy:
try to know as much as possible about the future!
For the author, future research is one of the most appealing and intriguing subjects [
39,
40,
41,
42,
43,
44,
45,
46,
47,
48,
49,
50,
51,
52,
53,
54,
55,
56,
57,
58,
59,
60,
61,
62,
63,
64,
65], including the analysis of megatrends. The European Commission [
66] states that “forward looking activities (mostly foresight and forecast but also technology assessment and horizon scanning) have a large scope and can be used for several purposes: to inspire new EU policies, to assess policies and measures, to anticipate potential disruptive events, and to build contrasted visions of the future” and has triggered a bundle of related activities. In a similarly positive vein, PriceWaterHouseCoopers has issued a “Guide to forward-looking information”, subtitled “Don’t fear the future: communicating with confidence” [
67] and enriched with valuable practical examples.
The
European Environment Agency’s (EEA’s) definition of FL is process-oriented: the “
Knowledge base for Forward-looking Information and Services (FLIS) is a platform to support long-term decision-making. The aim of FLIS is to introduce forward-looking components and perspectives into existing environmental information systems and to expand the knowledge base and its use” [
68].
The EEA understands forward looking as a cooperative exercise [
68], including the six components “drivers and trends, indicators, scenarios, methods and tools, networking, capacity-building and governance, and use of forward-looking information”, symbolised by six hexagons in the FLIS logo ( at left). The logistical embedding of FLIS into a wider set of activities is displayed at right in (the source of both images is [
68,
69]. One of the first activities in the cooperative process was the study “catalogue of scenarios” [
69]. In recent years, EEA staff has cared for a web-based collaboration platform in the EIONET framework (European environment information and observation network: [
70], including all 33 current EEA members and six cooperating partners). All foresight methods complement enery modelling but do not strive to replace these approaches [
17,
18].
. At left: logo and internal structure of the FLIS endeavour (Forward-Looking Information and Services) as defined by the European Environment Agency EEA; at right: greater embedding of FLIS. Source: [
68,
70].
Earlier “classical” scenario writing [
71,
72] suggests that correlations between parameters (mostly intensity parameters such as quotients) with the (easily computable, even if disputable proxy for) economic level GDP/capita are better strategies for data analysis than pure time series. Such correlations (with economic level instead of time) promise to better describe structural qualities of complex socio-economic systems [
16] and include the approach of dynamic energy elasticities [
32], [
73] (p. 963).
However, the analytical tool of the Global Change Data Base GCDB [
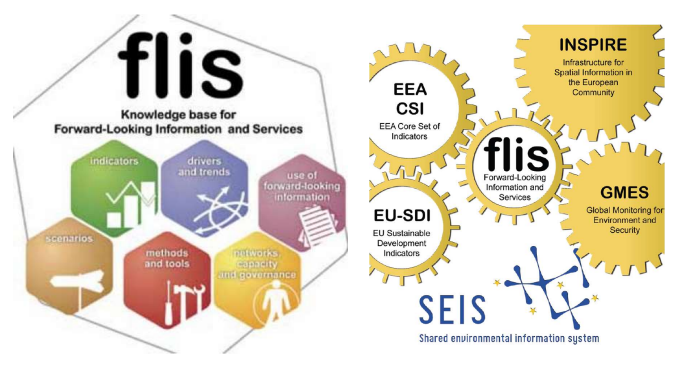
74] should allow still more sophisticated types of correlation. uses as an example the correlation of the two following parameters that were chosen in line with classical scenario analysis:
• on the horizontal axis, a proxy for cereal production efficiency per area: “production of cereals/harvested area of cereals”, measured in tons per hectare
• on the vertical axis, a proxy for irrigation intensity: “irrigated agricultural area / total agricultural area”, as measured in %/100.
Depending on which regional aggregate is chosen, the overall trend might be interpreted differently in the three sections of . Such decisions are also known as the MAUP problem (modifiable areal unit problem) which arises when spatial phenomena are aggregated into geographic units of variable size [
75,
76] and aggregated by industrial sectors [
77] with a view to increase the economic productivity of energy (thus decrease the energy intensity on a macroeconomic level [
73] (p. 798), [
78]). Data per country suggest looking at hundreds of single correlations of timelines (at left, strongly affected by annual meteorological variability); the granularity level of FAO agricultural data (cf. [
79]) suggest looking at continents (with a former USSR area singled out, at centre); and granularity (as the geographic term goes) chosen in traditional economic modelling tends to define eleven regions (e.g. the “11R model”, at right, see [
80]).
. Granularity is relevant for correlations of global data sets; here between two quotients: “production of cereals / harvested area of cereals” with “irrigated agricultural area / total agricultural area”. Granularities according to map inserts, namely at left: per country, at centre: per “continent” (plus former USSR), at right: per region. Image source: GCDB.
The described work on the GCDB contributes to environment, climate protection and sustainability by highlighting which political measures can be supported by underlying megatrends and which ones could be hindered in the efficacity by trends running counter to the intended effect. By its choice of synoptic themes, the GCDB attempts to solve the connected issues within the nexus of environment, climate protection and sustainability in a synoptic manner. Its ability to generate and test hypotheses can support the choice of more effective cocio-political measures given a worldwide very contradictory environment of antagonistic interests among stakeholders, as we currently see in the Dubai COP28. The paths taken by real-world historic developments hint towards cost-effective future paths to be taken for remediating global climate.
The GCDB supports solutions to the transdisciplinary problems of safety vs. sustainability vs. growth in the sectors of agriculture and energy. This paper’s unique contribution is its wide trans-paradigmatic scope, its independence of ideologies, and its principal and pragmatic suitability for adepts of any ideology and interest pattern – on a way towards climate safety.
2. The Context of Global Climate Change
The topic of “global change” has found its permanent place in the scientific community for decades already. In particular, the anthropogenic additional greenhouse effect has found broad interest in natural science, technology, social sciences [
81] (p. 2), [
82] and political design attempts.
The identification of the thematic core point yields clearly that the global CO
2 emissions from the combustion of fossil fuels represents the strongest single cause from global warming. These CO
2 emissions result from energy supply activities to cover the need for energy services (which, notabene is actually needed, not fossil resources) and show various structural basic patterns and various development dynamics in various country groups (e.g. industrial or developing countries). A regionally resolved analysis of the previous trends of the energy-related CO
2 emissions therefore appears to be helpful.
Usability of This Work
On the occasion of the attempt to identify countermeasures, design countermeasures, and practically implement countermeasures against climate change, quantitative analyses should be used as background information for defining which energy industries in an individual country or world region should implememt which measures. For that target, “
maps” of characteristic time-patterns of energy-economic trends are prepared.
Current hypotheses regarding the efficacity of single climate protection measures, for example the evaluation of fuel mix change or efficiency improvement or improvement of economy efficacity could be tested against the background of an expectable development (the so-called “dynamics-as-usual” scenario). The calculation of the reduction potential in the individual states (equalling the difference of projections “with measures” and “without measures”) could also be supported by this GCDB.
As a concrete special case regarding methodologies, the result of the “National Accounts Matrix Including Emission Accounts” (NAMEA) projects implemented across Europe could also be evaluated as a specific case [
83,
84]. Overall, well-founded material could be generated for national scenario construction against a global background of transparent scenario assumptions.
3. Methodology and Data Flow
3.1. Technical Design of the Proposed Global Information System
The proposed
Global Change Data Base (GCDB) should envisage compiling over two thousand data sets from the fields of
• agriculture, land use [
79]
• economy, gross national product [
85]
• energy supply on global [
86] and (if possible) local [
87,
88,
89] levels
• population and social sciences, Human Development Indicators [
90], World Development Indicators [
91], Penn World Tables [
92] or other indicators of development and globalisation.
The GCDB should analyse these data
numerically and graphically by means of regressions and correlations. Given the above-mentioned partly contradictory paradigms, it might be helpful to first concentrate on a consistent sub-period within a Kondratieff wave, namely the 1960s through 1980s.
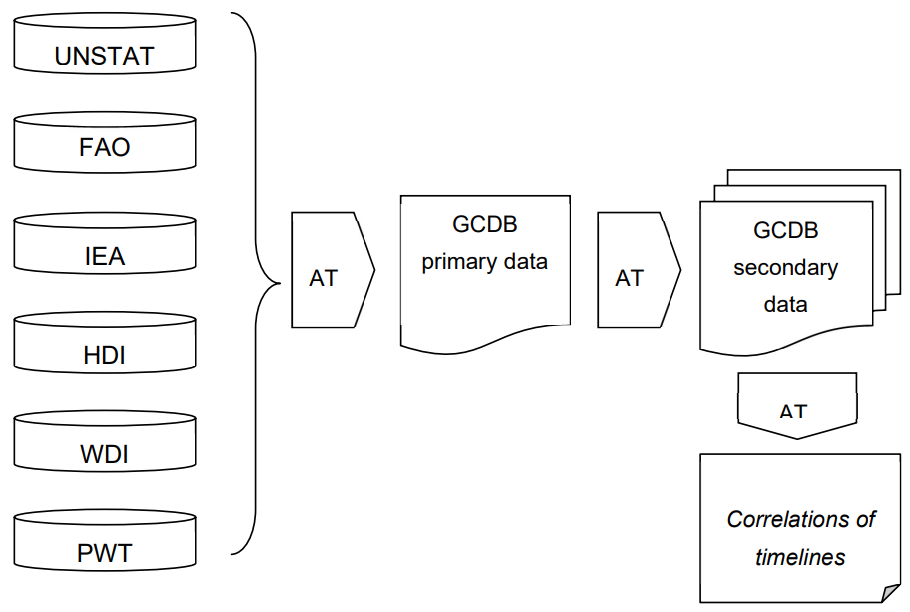
Depending on data availability, for each country in recent decades (mostly 1960-1991, or longer), data should be compatible to standard international data sources, such as UNSTAT, FAO, IEA, HDI, WDI, and PWT (at left in ).
. Data flow scheme for the “Global Change Data Base” GCDB. At left: internationally compatible data sources such as United Nations Statistical Office (UNSTAT), Food and Agricultural Organisation (FAO), International Energy Agency (IEA), Human Development Indicators (HDI), World Development Indicators (WDI), and Penn World Tables (PWT). These data are topographically harmonised by the analytical tool (AT) of the GCDB which yields the GCDB’s thousands of primary data. By their mathematical combination, the AT computes a greater multitude of secondary data that are able to be correlated and then displayed graphically in order to detect so-called “paths of development” as hypothesised by some growth theories. Source: adapted after [
74].
Diagrams will be provided on a per country basis, per continent, and for eleven world regions common to most global modelling, as used in energy economics [
16] (p. 62), [
71,
72]. A detailed overview of the dataset should be available as a variable list.
Furthermore, the GCDB shall have a macro-driven “
analytical tool” (AT), which is designed for graphical
and quantitative representation of global trends.
The AT has
two main tasks (compare data flow in , from left to right):
(a) it
combines any existing (primary) GCDB data on new (derived, secondary) data; by addition, subtraction, multiplication, division, differentiation to individually selectable (secondary) data
(b) it
correlates any (primary or secondary) data. The quantitatively specified correlation factors and parameters can also be illustrated graphically (by the “pathfinder”, as a third macro task).
3.2. The Context of Existing Modelling Approaches
So far, various modeling approaches have been employed in the sphere of global change and climate change, depending on the mindset of the research group, the various authors’ and institutions’ ideologies and the underlying concepts of what drives techno-socio-economic evolution [
93] (p. 106). Dividing questions might be if economic evolution or so-called “
development” is based on individuals’ decisions [
94,
95] or on societies’ framework conditions [
9,
96]; and the scientific branch of “Global Studies” keeps trying to find a functional equilibrium between these two or more antagonistic views [
16] (p. 165f), [
97,
98]. On the basis of such (still widely undissolved) paradigmatic dichotomy, the (more experimentally oriented) approach of the GCDB may be beneficial given the sometimes divergent policy recommendations based on economic models with diverging model architectures based on diverging developmental paradigms.
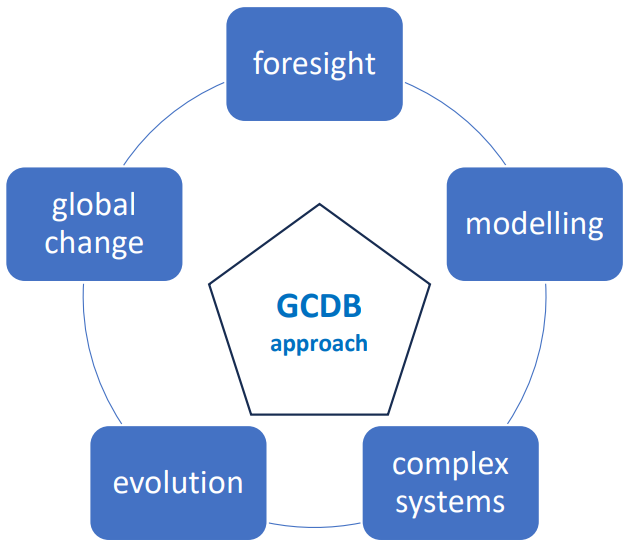
The several literature searches at several stages of the project underlying the GCDB approach include the domains pictured in comprise modelling and non-modelling domains, thus guaranteeing a trans-paradigmatic view.
. The thematic areas underlying the present article and the GCDB method.
Given the stark worldwide tensions in the global political system including the ongoing wars in Ukraine and Gaza (mirroring collective unreconcilable self-convictions: [
99]), any proposed solution to a grand issue such as climate protection should allow for smooth procedures of implementing the necessary changes which can be achieved by respecting the many interdependencies in worldwide trade, production chains, fossil energy supply, geopolitical interests and related ideological world views. This means that viewpoints of several global communities should be taken into account, not only of one global community – and this is exactly reflected by perceiving the dynamics of global changes as they manifest in reality (not as they manifest inside one given calculatory model). Thus, letting oneself being
inspired by the world as it functions in reality (as opposed to by model results) might promise to add to practical feasibility of socioplolitical suggestions on what to do when facing the severe global climate desaster.
4. The Planned Work Procedure for the GCDB
4.1. Energy Part of the GCDB
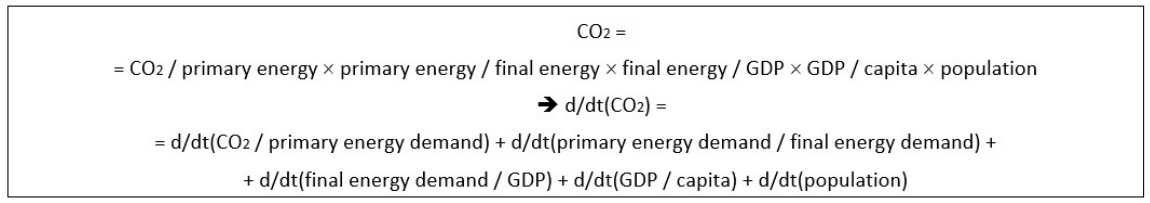
This planned work analyzes the approximately 2500 global data time series of economic, energy and population data provided by global institutions such as UN, IEA, HDI etc.) stored in the “Global Change Data Base” GCDB (30 years for 130 countries, 11 world regions, 7 continents. These data are further processed by automated statistical methods (such as correlations, regressions and graphic presentation), whereby the general themed architecture is essentially specified by the activity chain “economic activity – final energy demand – primary energy demand – CO
2 emissions” as formally described by the identity
And further this formula (if separating primary and final energy) may undergo a differentiation step by time:
Furthermore, distinguishing individual economic sectors as well as individual energy sources is carried out for each parameter for all states for the duration of the entire series of time (described in [
100,
101]).
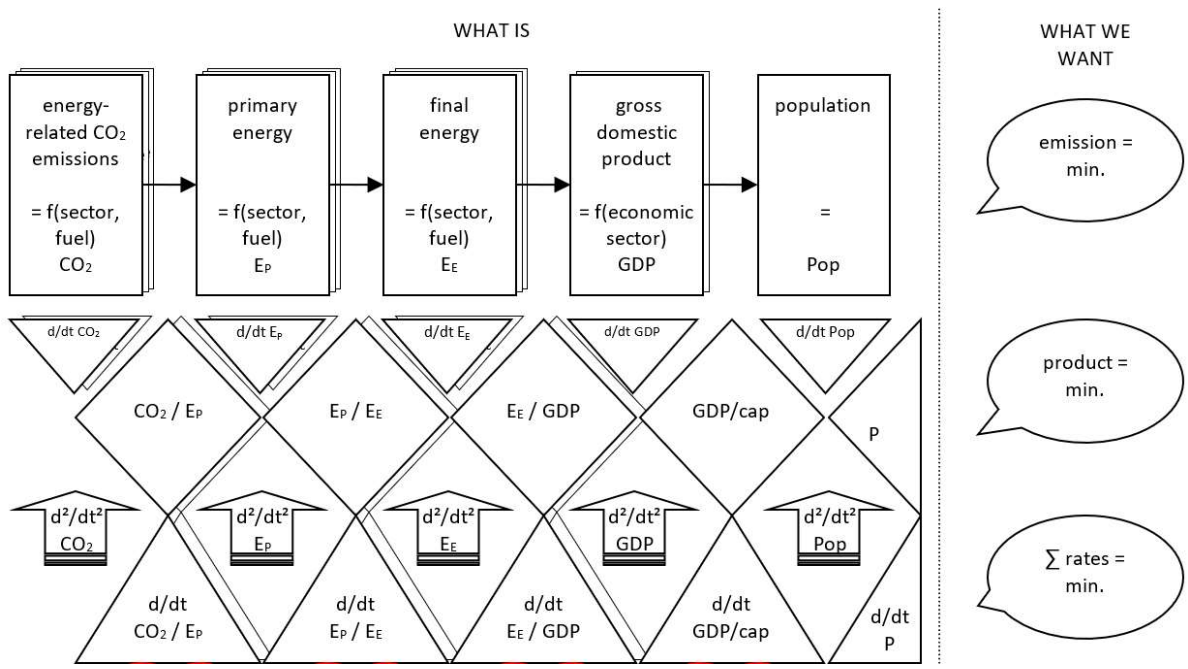
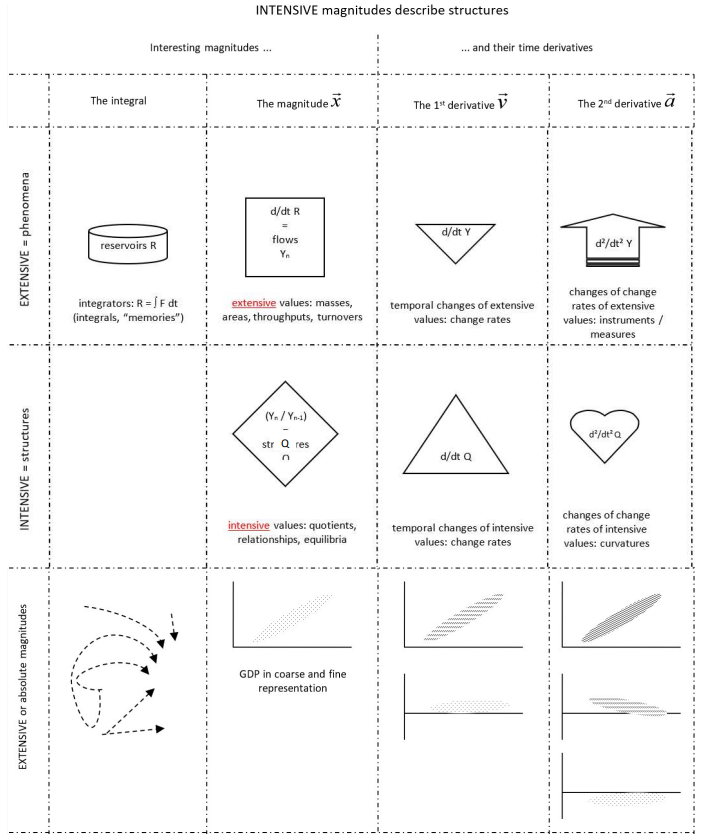
. Detailed scheme of variables in the GCDB, energy economics part. Image source: [
102], graphic legend see in Annex 1.
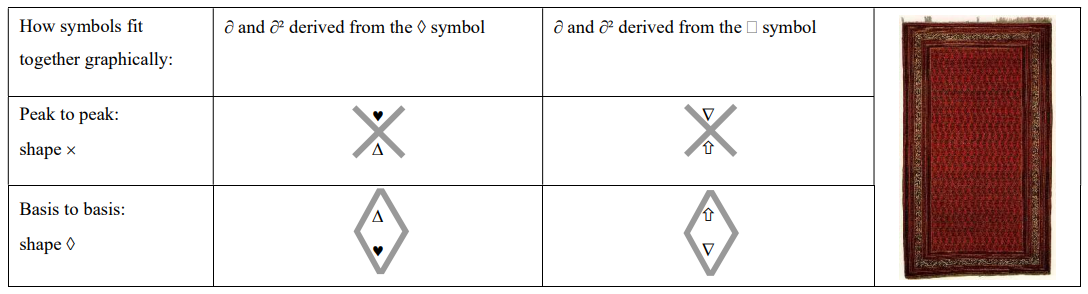
Here in , a more detailed “legend” is offered for the GCDB architecture while using various graphical symbols for each type of parameters such as extensive (i.e., levels) and intensive (i.e., quotients of levels) magnitudes and their first (∂ or d/dt) and second (∂² or d²/dt²) derivatives. Annex 1 explains the meaning of the graphical symbols, and Annex 2 explains the inner cohesion of these graphical symbols. Figure A1 and Table A1 contain also the “second derivatives” ∂². Annex 2 pictures the structure of the data types available in the GCDB and its logical interconnections. As practical examples, Annex 3 pictures sectorial GDP both as a funtion of time and of GDP/cap to highlight visibility.
In order to provide an example, since decades, there is an increasing orientation towards the energy service, which – as far as possible – is taken into account in accordance with the international data situation.
4.2. The “Driving Forces of Climate Change” Part of the GCDB
Within the chosen interdisciplinary approach, the underlying forces driving the CO
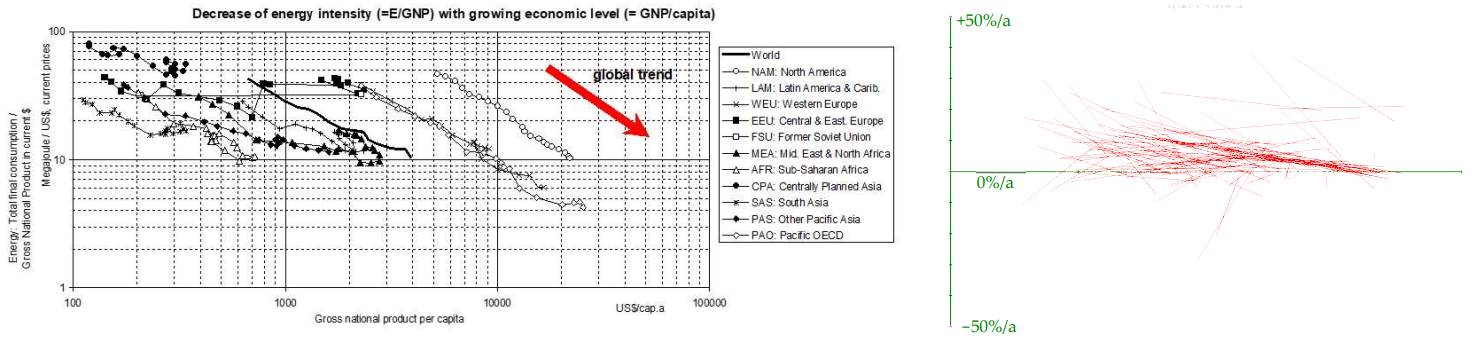
2 emissions are also analyzed quantitatively. The GCDB will contain extensive variable sets from the various areas within the “Human Development Index” HDI, i.e., economy, education, development aid, social structure, etc. With the above statistical methods, social science parameter patterns and their interaction with energy economy parameter patterns are to be examined quantitatively (examples in ). A main focus of the work lies in the area of energy economics, and beyond technical solutions also available economic mechanisms of action should be analysed.
. As an example for the time-series correlation method in the GCDB: at left the decrease of energy intensity (=E final/GDP) for 11 regions as a function of GDP/capita; at right the increase rates of the absolute final energy consumption in Petajoule (E final) for all countries (time average) as a function of (GDP/cap).
For the GCDB method, the “
principle of reality-relatedness” means that the basic idea is that the previous historical path of techno-socio-economic evolution best shows the time behavior and the reaction of the global energy system. In any case, such path analyses represent an experimental access and are better suited than merely formulaic relationships. The GCDB method therefore means no attempt to parametrize complex historical energy-related processes which might be based on existing (but ever unsure) theoretical model assumptions.
As a result, the GCDB method does not use a closed mathematical model as the starting point for conclusions, but a statistical time series analysis. This methodology has already been successfully developed and published as the result of an EU project ESCOBA on the global carbon cycle (initially, as [
20]). The topic of global change is viewed from a systems analysis viewpoint and places its main interest on the examination of the
dynamics of its internal systemic development and structural evolution.
4.4. The Scope of the Analysis and the Final Product of the GCDB Analysis
Several thousand correlations of time series are to be created and a few dozen characteristic development paths or “parameter patterns” are to be created as a result of the envisaged GCDB exercise. At the end of this analysis, conclusions about the current discussion on the creation of global, regional and national emission scenarios are drawn, with their direct practical usability intended. Also, it may seem as a valuable target to find out how many percent of emission reduction can be achieved (i) by efficiency improvement, (ii) by fuel switch, and (iii) by changes in life style.
4.5. How Transdisciplinarity Is Implemented through the GCDB Analysis
The absence of a model tool means to avoid justification from the side of one’s own specialist discipline
1, at least methodically. On the positive side, avoiding models opens the way for interdisciplinary recognition through other disciplines (and lifestyles), to the extent one relies on intersubjectively verifiable experience. Models, however, are very dependent on the pre-concept and on the pre-cognitive understanding imprinted onto reality, and thus are not suited to serve as inter-paradigmatic approaches: who does not share a model’s presuppositions and assumptions also does not share the model’s conclusions.
Belief in the validity of one’s own science can be helpful in one phase of employment and carreer but less in other phases. Gentle opening up (of the systems of understanding) within a dialogue is necessary, thus reaching beyond one’s own conceptual ‘bubble’.
By the GCDB methodology, an all-around view should be trained – and not by primarily supporting the presumption that “formulae = pictures of reality” (e.g., model calculation results), but through primarily relying on reality (as pictured by data, as proxy values). In this view, it becomes essential to train a holographic view, meaning a 360° perspective where insights are collected from all methodical viewing angles [
103,
104,
105].
5. The Kon-Tiki Approach as a Methodological Innovation
5.1. Introduction to the Characteristics of the Kon-Tiki Approach
The primarily motivating question is: Can global CO
2 emissions be lowered sufficiently through the introduction of “countermeasures” implemented by mankind? And which measures are the most efficient ones in the present real-life situation?
The reaction by humans facing global warming is basically to identify and to try to implement countermeasures after having computed their potential to mitigate. However, policy monitoring shows that only limited success is achieved given the degree to which the levels lag behind expectations in some countries (Umweltbundesamt, 2005: 5). Actors lack sufficient incentives for participation in negotiation processes [
106] (p. 277), [
107] (p. 1). Similar disappointment may be witnessed on a global level, if future development is compared to the really desirable levels of change [
108] (p. 11), [
109].
The methodology traditionally chosen to deal with future developments is scenario writing, (usually an “as-if” logic, e.g. IPCC, 2000). According to the DPSIR concept (i.e.: driving force – pressure – state – impact – response, EEA 2005: 50), political action is considered (sufficiently)
capable of changing future developments. However, the measures’ potential to
deflect from a typical “business-as-usual” development has usually to be registered as lower than expected. (In the language of systems analysis, this effect is called “policy resistance” by J.D. Sterman [
110] (p. 10). In factor analysis it is called “rebound effect” [
111] (p. 22); in everyday life this effect is perceived simply as a disappointment.
The reason for such systematic shortfalls in the endeavour against climate change can be understood by detecting feedback processes in the global techno-socio-economic system (i.e. “
resilience”), the details of which might not be sufficiently taken into account in scenario approaches (e.g. [
112]). Similarly, the vast “growth literature” on the driving forces of economic growth seems to lack a thorough understanding of the
interrelatedness of diverse growth factors
6. Therefore, the concept of autopoiesis and self-organization ([
113] (p. 34), [
114]) of complex social systems can be tested in this project and can prove helpful in this context (The practical intention is: before trying to change a (living) system, its dynamics should be sufficiently understood
7).
In this light, a detailed and quantitative analysis of the levels, rates of changes, saturation effects and other intrinsic dynamic properties of the “global system” – as comprised by the given “Global Change Data Base” – appears as a helpful
complement to existing strategies (esp. with regard to sustainability). All such work can be based on earlier quantitative analyses of the applicant regarding energy-related air emissions, especially CO
2 [
93], land-use changes [
20] and biomass energy [
115].
5.2. The Scientific Aims
What we want to have as a result is a sufficiently large and harmonized database together with a tool for producing a sufficient number of correlations between these data sets (not simply within the individual data). Then, the most stable and meaningful correlations shall be used as landmarks in a sufficiently plausible “map of techno-socio-economic evolution”. A subset of such “robust paths of development” will be interpreted based upon its potential to lead towards targets of sustainability vs. lead away from targets of sustainability. The most common example is engendered CO
2 emissions and therefore will be focused on in this project.
The Global Change Data Base GCDB will then comprise over 2000 variable sets (primary variables) for 100-200 countries ranging over several decades taken from the internationally accepted data stocks from international institutions like IEA, UN, FAO, WB, HDI, WDI. From these primary variables, the GCDB will derive several thousand secondary variables such as indicators, intensities or rates. The analytical tool of the GCDB will have produced several thousand correlations between the above mentioned variable types, both quantitatively and graphically. In order to provide more details, Annex 4 shows a list of possible single steps to achieve these mentioned operational targets.
The search for characteristic patterns in these correlation plots will have singled out dozens of linkages between variables (e.g. sectoral energy intensities for specific fuel types), which appear to symbolize robust paths along complex evolution. The combination of such “recognized patterns” can lead to establishing a comprehensible picture – a kind of “
map” – of global techno-socio-economic (t-s-e) development, which can be seen as a possible “unfolding of t-s-e evolution”, occurring in a wave-like or step-wise manner consisting of consecutive levels [
16] (pp. 194–197), [
20] (p. 210).
With such a map of likely intrinsic evolutionary change(s) at hands, esp. with targets of sustainability, and esp. the target of CO
2 emission reduction in mind, a list of “helpful trends” could be discerned (like a sub-map of underwater currents or wind-forces facilitating intercontinental sailing in earlier centuries: using the metaphor of the famous “Kon-Tiki”, which did not paddle, either). Eventual strategies using (to “jump” on, “surf” and enforce) such trends (e.g. decarbonization) reach an outcome more feasible and promising than head-on direct political “measures in the traditional sense”.
5.3. GCDB’s Scientific Advances and Innovation
The decisive steps forward with the implementation of and analyses by the GCDB are:
(1) The level of detail in the “energy economy” picture of interrelatedness: Factor decompositions of energy related CO
2 emissions have until now dealt with the total energy and the total GDP [
116] (p. 75), but the present project delivers for the first time both the sectoral and fuel decompositions in the detail as shown in the formula below.
(2) The projections here are not exclusively (as often traditionally) based on
• “wisdom inside models” with their parameterizations valid for now
8 and partial views of factors determining “progress” or “growth” [
117] (p. 828).
• nor exclusively on pre-cognitive visions on how human development will – hopefully or deplorably – proceed [
118] (p. 23), [
119] (p. 48),
• but founded on the detected “real phenomena” of structural changes, which becomes apparent from the depiction of GCDB indicators. Such structural changes are not the result of processes describable in one formula. They have not been studied in sufficient level of decomposition, as recent literature shows [
120] (p. 1151).
(3) Correlations are not only undertaken with “GDP/cap” as an independent variable (thus implicitly assuming its growth as tacitly driving impact) but also with many other (intervening) variables. This opens the road to understanding and quantifying the mutual interconnections between classical
9 and alternative driving forces which – of course – are not independent from each other – as suggested by a qualitative systems analysis view.
(4) Apart from statistical soundness, state-of-the-art knowledge and skills in usability and information design enhances the interpretability of data – for team members and others – [
121,
122,
123,
124] by transforming complex data into more easily understandable graphical output.
(5) In a profoundly interdisciplinary way, the “societal ship” takes into account reefs and icebergs of the natural kind (climate change) as well as of the economic kind (steady-state economics: 125) and tries to avoid a Titanic-like collision like (hard control) by implementing “soft control” [
126] (p. 93) through discursive procedures.
5.4. Importance of the GCDB to the Field and the Relevant Scientific Community
This approach of a “
heuristic detection of paths” complements usual modeling approaches (e.g. compiled in [
127] pp. 4–13). This approach does not try to replace them but on the other hand does not comply or match them. The liberating
advantage of this approach is clearly, that no set of (economic) values, “precognitive disposition”, discount rate [
128] (p. 408), consideration of costs (total vs. marginal: [
129] (p. 234) or even preference for a scientific school or type of modeling [
130] (p. 32) is required.
This fully quantitative analytical tool working with graphic plots (correlations of time series and their 1st and 2nd derivative) adds a new, “contemplative” methodology to modeling and scenario writing [
19] (p. 185A), [
131]. Insight into intrinsic dynamic system structure (which systems analysis holds to result from system architecture, [
113] p. 4) is strongly facilitated by the enormous quantity of detailed data sets and combinations along with the richness of their graphical representations.
During the climate-protection process, additional dynamics in emission abatement efforts seem indispensable [
132] (p. 1). The essential question – put metaphorically – remains: Will we only “paddle” across the Pacific or do we try to make use of ocean currents like Kon-Tiki did [
133]? If we want to use currents, we need maps of such currents (). This project tries to develop a methodology to “map such currents”. Therefore, this project can serve as a basic tool for political concepts and consulting.
. The Kon-Tiki approach alludes to the adventure of crossing the Pacific by natural means only, as reconstructed technologically and implemented by the Norwegian author Thor Heyerdahl [
133]. Image source: [
134].
The proposed viewpoint also helps avoid a future of “wishful thinking” and steers towards more realistic expectations and more realistic designs for political approaches, towards widely accepted goals [
16] (p. 103ff). According to the underlying philosophy of necessary consensus building between the main societal actors, the project’s results can also be used for pedagogic and didactic purposes, for instance in a simulation or negotiation game for students or for a larger public through web platform technology [
16] (p. 357ff). There exists several such games
10 that introduce new variables and complexities, e.g. “Surfing Global Change” SGC (16, Level5 therein). Current interdisciplinary, dialogue-oriented and action-oriented university teachings can also fully profit from the project’s results.
Violence-free conflict resolution processes work with some kind of consensus-seeking [
43,
44,
45,
46,
47,
48,
49,
50,
51,
52,
53,
54,
55,
56,
57,
58,
59,
60,
61,
62], [
113] (p. 30). Finally, regarding far reaching political decisions on a global scale – as in the whole “climate issue”, climate protection – a consensus amongst the major political actors is needed. Therefore tools creating “insight” – well rooted in data-analyses – are a major step in helping political actors along this path. In this regard, the proposed heuristic method of trend analysis could have a “credibility advantage” compared with the usual strategies of modeling, because underlying preconceptions, common to modeling philosophies are nonexistent in this kind of data analysis.
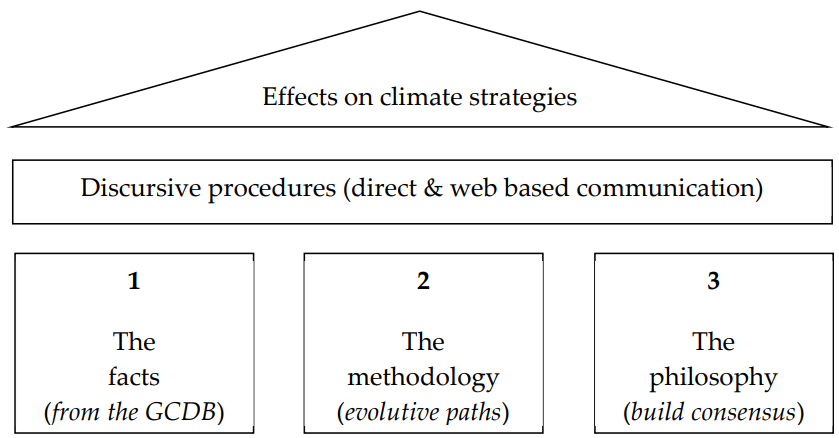
5.5. Research Approach and Methods (“3 × 3 architecture”)
Here a preliminary summary of the scientific mission objectives is given in three sections ():
(1)
The facts: global flows and structures regarding energy, economy and land use by:
a. enlargement of the existing “Global Change Data Base” GCDB
b. quantitative trend analyses of the chain of energy demand and supply
c. effects of global trends regarding the overall objective of sustainability
(2)
The methodology: a search for “paths of development” by:
a. critical review of the existing methodology
b. clarification of the applicability of the new methodology
c. taking into account co-evolution
11, socio-biology etc.
(3)
The philosophy: evolution of global flows and structures by:
a. applying systems theory and game theory to evolution
b. applicability of findings as substrate for “ethics of negotiation”
c. dissemination strategy (together with Environment Agency Austria).
. Sketch of the overall architecture: the “temple” for constructing and using spatio-temporal “maps” for socio-economic sustainability, as suggested in this article. Numbers n refer to the following subchapters 5.5.n.
5.5.1. The facts: From the GCDB
(a) This project intends to develop, enlarge and improve the “Global Change Data Base” GCDB together with an “analytical tool” designed to perform interdisciplinary analysis of trends and correlations.
The GCDB uses internationally acknowledged data sets from
• IEA (86, for energy demand and supply),
• the UN System of National Accounts SNA (for sectoral GDP),
• the FAO (135, for land use and agricultural production),
• the Penn World Tables PWT for Real GDP [
136] (p. 336),
• the World Development Indicators WDI [
91], and Human Development Indicators HDI (for social parameters).
The project does, however, not only aim at providing assessed (like in [
137]) and inter-combined data.
(b) With the specific analytical tool, computations of country data and regional aggregates of sums, differences, products, quotients and derivatives of any GCDB variables, are calculated along with correlation coefficients and plotted correlations of time series for several decades. For primarily graphical analysis, it
combines the perspectives of
time series analysis [
138] (p. 502), [
139] (p. 151) and
cross-correlation analysis [
140] (p. 437), [
141] (p. 13) for explaining the levels, rates of change, saturation effects in the field of economy, energy use and land use
12. Before now,
no such methodology was found after an extensive scan of scientific journals with the 15 highest impact factors [
142] in the fields of economy and energy
13. Furthermore, stable trends representing “paths of development” are identified and used to build a more complete picture of evolutionary patterns.
(c) Global Climate Change is mainly driven by CO
2 emissions [
143] (p. 103) which in turn are driven by economic, industrial and energy supply structures [
115] (p. 492) The underlying evolutionary changes in these structures act as decisive driving force for Global Change – these driving forces are quantified.
5.5.2. The Methodology: Evolutive Paths
(a) Until now, the method of projecting the present condition of the socio-economic state has been used widely [
144] (p. 538). However, the changes in rates of change have
not yet been sufficiently studied, to yield well-founded information on likely deviations from a business-as-usual path of development. Such deviations are likely to occur as crucial results from the internal system structure of the global techno-socio-economic (t-s-e) system.
(b) In this project, the primary source of knowledge is the (intersubjectively re-examinable) “
reality” (in the form of data describing reality) and not “
model results” (or even prescriptions derived from preconceived models of reality as it is supposed to be) - (from whatever scientific school they might stem), just as in the tradition of Galileo Galilei, who, for instance, urged contemporary cardinals
to look through his telescope onto the astronomic reality supporting his world view [
145]. Therefore, information on correlations or changes in directions of development are based on data (of past decades),
not on pre-conceived convictions laid down in world models. Interpretation (after having looked through the GCDB telescope) is up to the reader and not simply restricted to the project team.
The
methodology itself consists of analyzing the “path locus” of all countries’ time series and the texture, slope and twist of this array of curves including state-of-the-art statistical analysis.
The “
main formula”
14 of this project for
energy related CO
2 emissions reads:
(a)
Simple notation:
where: CO
2—level of CO
2 emissions (for a specific fuel & sector), E
p—demand for primary energy (for a specific fuel & sector), E
f—demand for final energy (for a specific fuel & sector), GDP—gross national product (in a specific economic sector), P—population.
(b)
Detailed notation:
Legend for indices: c = country
15, y = year, f = fuel, s = economic sector
16.
For
land-use-change related CO
2 emissions a similar system structure will be developed (Ahamer, 2019: 71, 325), where the area takes the place of energy and the crop type takes the place of the fuel.
Forms of variables: In order to describe the dynamics of the global evolutive system, the following types of variables are depicted and analyzed (mostly as a function of GDP/cap):
• Levels (denoted by the “state vector” x in this text) (per each country, as times series)
• Rates of change (written as ∂x/∂t), as used e.g. in [
146] (p. 43).
o saturation levels (cases where ∂x/∂t tends to zero) as e.g. in [
147] (p. 60).
• Changes in the rates of change in order to better detect saturation and other non-linear behavior (∂²x/∂t²) as in 102
o variability of all the above types (inter-country, inter-region, inter-temporal).
Types of variables: There is a hierarchy of indicators (cf. 111: 4):
•
extensive entities (describing stocks or flows) like energy, population, area
•
intensive entities (describing structures) like quotients, indicators, energy intensities
•
shares (describing compositions) like sectoral GDP or fuel mix.
The
methodology consists of (i) computing, (ii) statistically analyzing and (iii) graphically depicting
all forms of
all types of variables of the GCDB, mostly following the “main formula” (compare the graphic systematisation in Annex 1 and Annex 2).
When implementing the above mentioned main formula, harmonization of different sectoral catalogues (e.g. between IEA and SNA statistics) will be performed; all still remaining amounts will be interpreted with sufficient caution based on earlier experiences in national environmental accounting, especially for transportation and household (84, 83, 111). For this work, the meaning of “sectoral intensity” sometimes will need to be handled cautiously as a
proxy variable for relative shifts in “attention” or “attribution of values”. The proposed method takes into account the “decomposition method” approaches [
111] (p. 22) as having high merit in attributing percentages of driving forces to “decarbonization effect”, “intensity effect”, “rebound effect” and other partial movements of the interconnected socio-economic meta-structures, and taking into account co-evolution, socio-biology etc. [
148,
149].
5.5.3. The Philosophy: Build Consensus
(a) This project suggests that (on a per-country as well as regional or global level) socio-economic structures evolve by themselves (i.e. in an
autopoietic way) and hence constitute
the underlying basis to be taken into consideration for all intended
actions, e.g. the commonly called “countermeasures to global warming”. It is important to take into account this “basement” structure – the more so, if the structure is moving. Therefore, the interdisciplinary concepts of systems analysis [
110,
150] and game theory [
151] (p. 5), [
152] (p. 5) can add substantially to new “concept building”. For instance, the development of “measures” (in a new sense) would represent
learning effects that allow countries to
“jump” to a trajectory that leads towards sustainability – in this project primarily exemplified with CO
2 emissions (e.g. general switch towards gas having occurred in Britain).
(b) The method of “systemic social analysis” [
45] will help to understand societal and institutional organizational patterns (based on an “embedment theory” using ten levels of social systems and with multi-year empirical project experience [
44,
62]; UNIDO, Enterprise Analyses, Regional Development, Conflict Resolution etc.). – Findings of relevant patterns of evolution and development are a substrate for consensus finding among stakeholders in the fields of climate change. Such consensus could be reached more and more through (partly web based) discursive procedures [
16] (p. 109), [
153,
154,
155] using an “ethics of negotiation” [
156] in suitable diplomatic or didactic settings, e.g. like the negotiation game “Surfing Global Change”
17 which was ranked in the Top Ten of the highest-rewarded award of media didactics in Europe [
157].
(c) How to steer? In order to avoid unfounded optimism (namely that the mere existence of information on global change would convince political actors to take action), an assessment is attempted of the degree to which detected trends could be changed by steering activities. Consequently the dissemination strategy for the project results builds on such scepticism.
6. Results
The practical work on the GCDB made evident that a clear organisation of variable types for the description of techno-socio-economic evolution is needed. Therefore, the GCDB distinguished between (i) extensive parameters, (ii) intensive parameters and (iii) parameters denoting shares of a given total. For all these three parameter types, the following temporal modes of perception can be chosen within the GCDB: (a) the magnitude, (b) its first derivative in time and (c) its second derivative in time. Annex 1 shows this scope of possible variables within the GCDB in a graphic manner, and Annex 2 adds to its comprehension by one more graphic synopsis.
During preliminary test runs to date, regressions of time series (or of single data points could be reached on the follown themes which partly suggest hypotheses on socio-economic interdependencies within the global evolutionary patterns:
- population growth.
- growth of economic level and in-country distribution of income.
- circumstances of agricultural production, including inputs of energy, machinery, chemicals and manpower.
- interannual variability of meat production and cereal production, as a function of the above.
- comparison of different cereals’ production efficacity.
- shifts within the allocation of land-use to territories within countries.
- dynamics of social and societal parameters such as unemployment rates and schooling rates.
- dynamics of economic growth as correlated with descriptive societal parameters, and with GDP/cap itself.
- dynamics of evolutionary shifts within the countries’ economic sectors (in coarse and fine differentiation).
- perception that any such dynamics can be better described by the 2nd time derivative as compared to the 1st.
- establishment of one logical chain of supply-demand parameters for agriculture and one for energy.
- analysis of the dynamic behaviours of growth and saturation phases in the agricultural and energy chains.
- shifts within the patterns of fuel mix within the countries’ sectoral economies.
- dynamics of sectoral energy intensities within countries’ sectoral economies.
According to the profile of the GCDB, the above analyses yielded statistical parameters such as correlation parameters and related r² values – but in the view of the author much more of the characteristic dynamics can be read from pictorial representations which open up themselves for an additional intuitive perception. and show tentative results for such graphic displays. Annex 3 shows more of these preliminary results in anecdotal incompleteness, because all GCDB results would pile up to a stack of several meters. Therefore, one of the foremost direction of future studies with the GCDB will be to identify and single out the “most stable” developmental paths within evolution (comparable with “stable quantum numbers” in quantum physics – on the opposing end of “complexity science”), which eventually might serve as guidelines for even future developments – this is at least the hope.
7. Conclusions
This article describes the overall architecture and computational processes within a large worldwide database on the driving factors of global change, namely the GCDB. On the basis of administratively accepted country-wise data series, global megatrends are to be defined and assessed in their relevance for (or against) climate protection measures. The levels, rates of change, and changes in rates of change serve to identify the underlying correlates (i.e., possible reasons) in the framework of energy-related CO2 emissions so as to facititate better directed policy measures. This endeavour will yield a far more comprehensive and specialised understanding of what drives mankind’s CO2 emissions endangering global climate.
The data sets hinted at above can not only be suitably used for illustrational teaching of global megatrends, but may also constitute essential building blocks such as planet-wide information systems or a future more consistent and updated “Global Change Data Base”. Further understanding of the degree of path dependence in global evolution and economic development (which is presently heavily contested among researchers) can be achieved by the quantitative and graphic approaches presented in this article, thus contributing to progress in futurology and “forward looking” institutions.
The included literature analysis has shown that “techno-socio-economic evolution” as a concept is highly dependent on underlying paradigms and ideologies. This article suggests that care should be applied when selecting a given model architecture because they may be ideologically driven and may have an important effect on both further theorisation and practical strategies to cope with globalisation.
Interested readers are welcome to participate and cooperate and co-finance a pertaining research project.
Acknowledgements
The author’s thanks for discussions and reflection go to colleagues at IIASA (especially to Gerd Esser, Arnulf Grübler and Nebojša Nakićenović), the Austrian Academy of Sciences, Environmental Agency Austria and at Salzburg and Graz Universities in Austria. Also my thanks go to three anonymous reviewers provided earlier by the Austrian Science Fund FWF and to two anonymous reviewers at this journal.
Ethics Statement
Not applicable.
Informed Consent Statement
Not applicable.
Funding
This research received no external funding.
Declaration of Competing Interest
The authors declare that they have no known competing financial interests or personal relationships that could have appeared to influence the work reported in this paper.
Annex 1. Data Structures
Figure A1. Structure of graphical symbols used in Figure 5 including the ∂² (second derivatives) in the right-most column.
Annex 2. Graphical Symbols Denoting the Entities
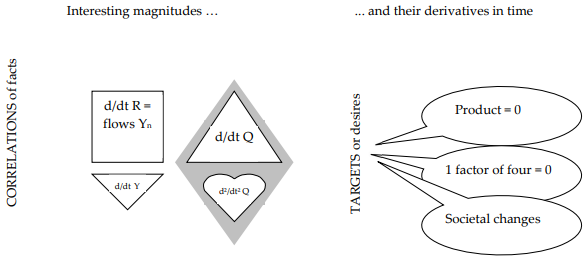
An explanation of the inner cohesion of graphical symbols defined in Figure A1 shows the symmetries of these logos and at the same time depicts that a second derivative is a proxy variable for changes in dynamics-as-usual scenarios, thus measures or societal values, similar to a steering mechanism of evolution.
Figure A2. Small synopsis of kinds of magnitudes (left) and possible kinds of values (right). At the same time, this graphic serves as explanation for the symbol types in Figure A1.
Table A1. How the ∂ and ∂² symbols fit together graphically when standing on above the other. There are two ways of attaching them: peaks together and bases together. At right: Persian carpet Mir 158 symbolically providing similar diamond pattern to the graphic structure.
Annex 3. Preliminary Data Examples and Preliminary Data Correlations
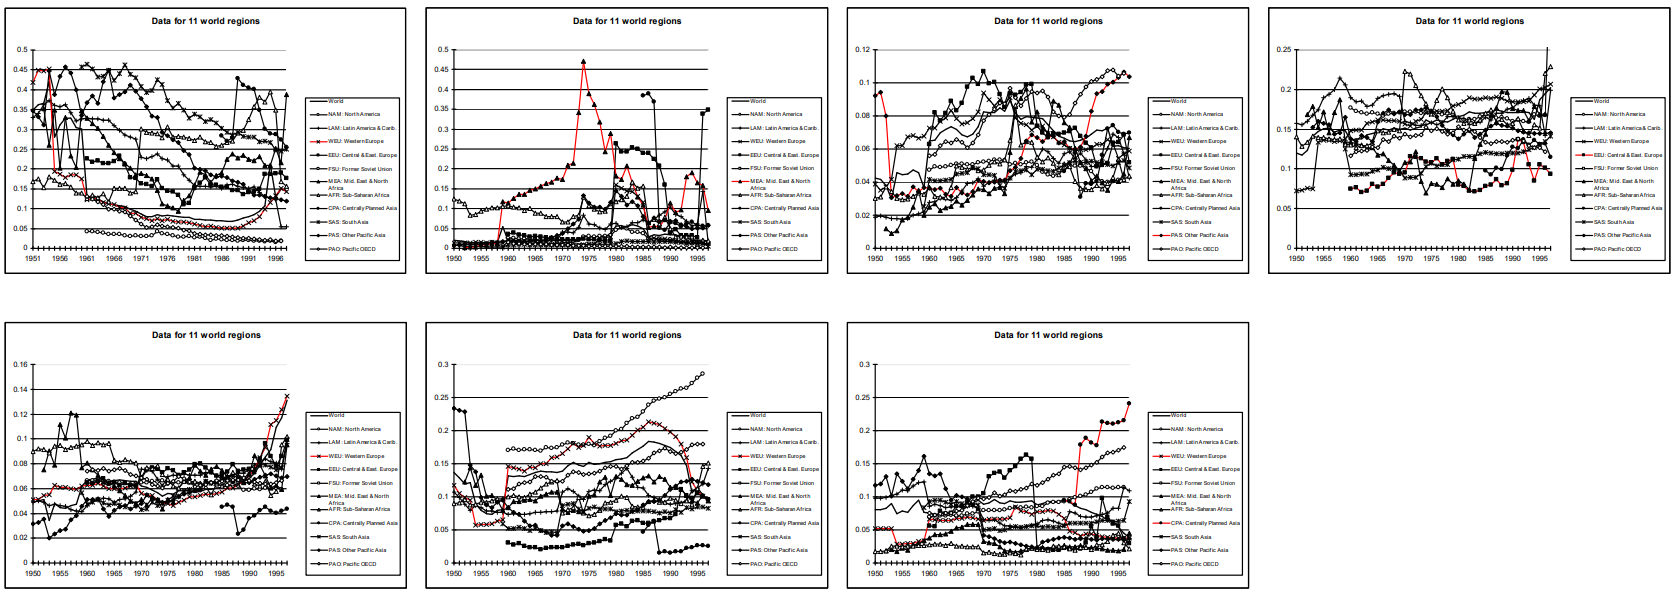
In order to provide a first glimpse on how such GCDB times series could look like, Figure A3 provides sectorial GDP data (in percent of total GDP) as a function of time in an aggregation across the eleven world regions used in IIASA model regionalisation. Figure A4 provides the rates of change of the same.
Figure A3. Sectorial GDP data as a function of time for eleven regions show percentages of total GDP for the following selected economic sectors as provided by UN data: 1. agriculture, 2. mining, 5. construction, 6. trade, 7. transport and communication, 8. finance, 9. Community and social services.
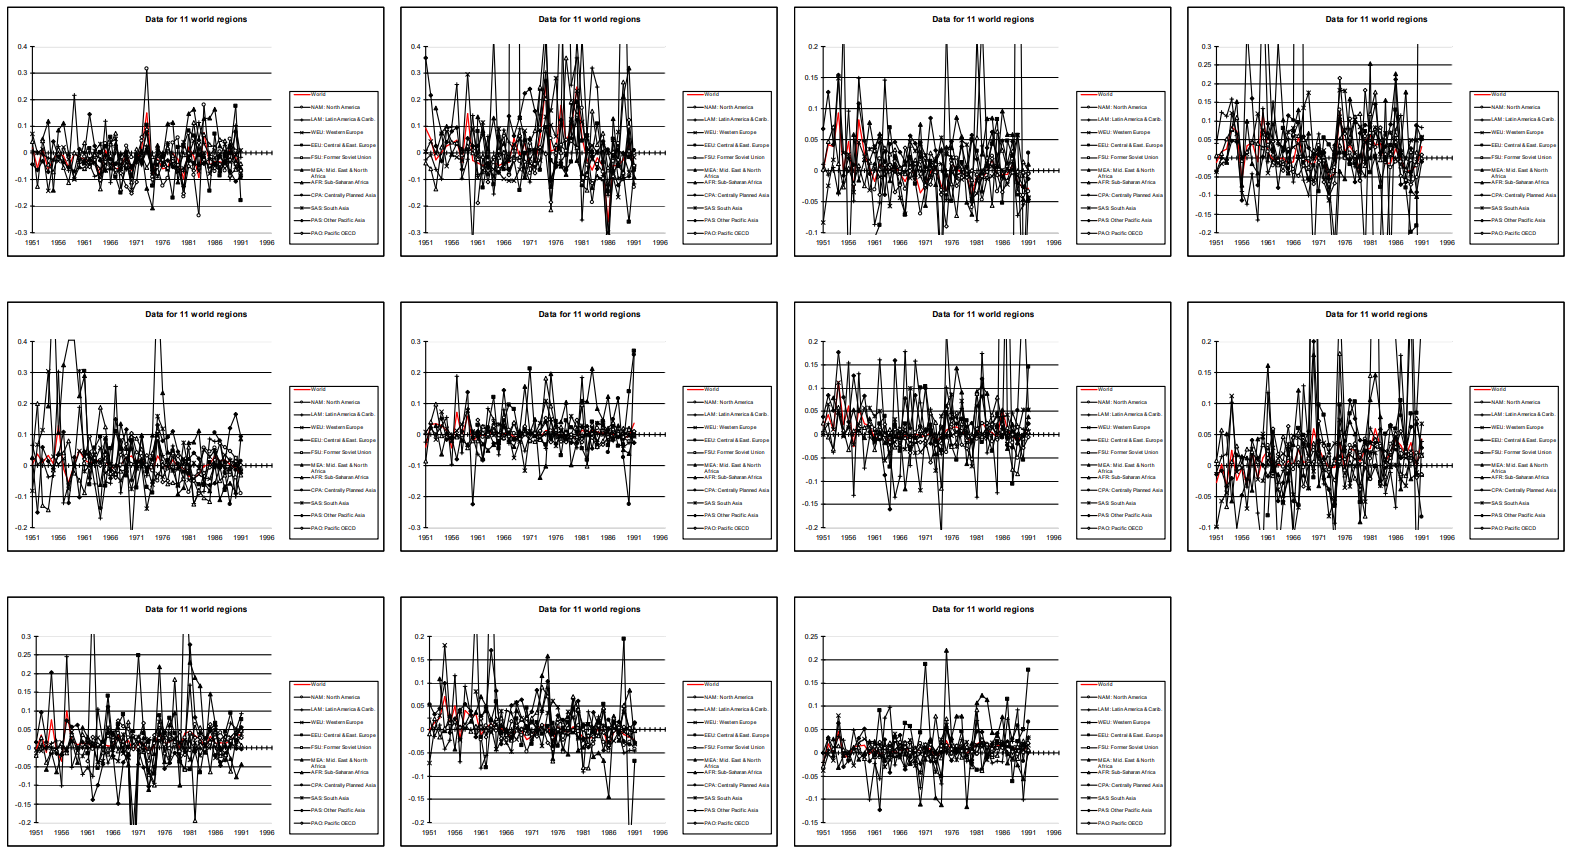
Figure A4. Change rates of sectorial GDP data in percentages as a function of time for eleven regions from Figure A3 (and a few more) for the following selected economic sectors as provided by UN data: 1. agriculture, 2. mining, 3 manufacturing, 4 electricity and gas and water, 5. construction, 6. trade, 7. transport and communication, 8. finance, 9. community and social services; and finally the combined sectors 2+3+4+5 as total industry and the combined sectors 6+7+8+9 as total services.
The advantage of plotting pictures such as Figure A3 and Figure A4 is that we see a relative image (independent of country size, thus depicting systems and structures) better exhibiting dynamic trends, but the disadvantage might be a more fluctuating graph – which can be improved by used time averaging and in Figure 6 at right. Overall, such graphical methods will be emphasised by the GCDB which allow to perceive more – thus suggesting candidates for
structural societal transformations (16: 194ff), similar to the following timeseries correlation image in Figure A3.
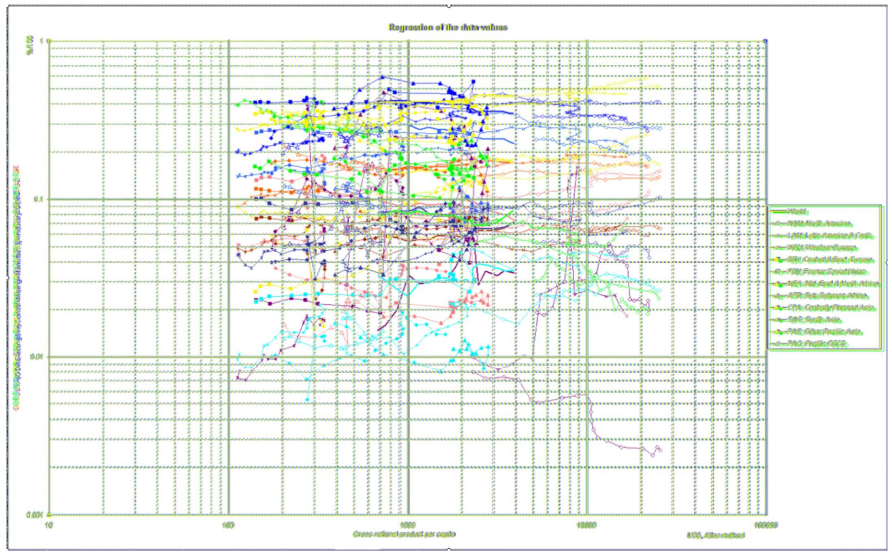
Figure A5. All nine sectors from Figure A4 (incl. 2+3+4+5 and 6+7+8+9) for the regions provide easier intelligible trends when plotted against GDP/capita as a proxy for developmental level.
Annex 4. The architecture of the “Global Change Data Base” GCDB – a genesis
Readers are welcome to cooperate in this huge endeavour! Also, cooperative financing is welcome. Please find similar descriptions of this plan for future research [
16,
102,
104].
1 TARGET: The initiative to the GCDB is motivated by global warming and the needed countermeasures
1.1 Given the scientific and public increase in concern about global warming, policy makers have made several steps in direction to cut back the emissions of greenhouse gases (mainly of CO
2) in various documents, the most prominent of which was the Kyoto Protocol and the Paris agreement.
1.2 Abundant literature such as “Der Faktor Vier” (The factor of four: [
158]) enumerates practical possibilities to reach such necessary and envisaged targets. In order to strengthen the scientific basis for the choice of appropriate, feasible and effective
measures, the key linkages and feedbacks between human activities and behaviour - and significant environmental changes are to be identified and evaluated.
1.2.1 There is a vast multitude of measures envisaged to combat Global Warming but this direction of reasoning (namely: which concrete measures to design, select and implement) is not sufficiently followed in existing work.
1.2.2 Summarising the methods: A statistical analysis of correlations of time series of variables computed from original data identifies the “paths of evolution” along which countries seem to develop. With this method scenarios can be constructed which go far beyond a simple projection of underlying trends.
1.3 The Project’s Objectives
1.3.1 The concrete objective is to quantitatively compare on a per country and regional level of geographical disaggregation the
(a) amount and
(b) the rate of change and
(c) saturation levels of
• societal impacts (demographic pressure, changes in life style, consumption patterns, etc.), and
• economic activities (energy demand and supply, need for agricultural land, etc.)
in their resulting effect on the emissions of greenhouse gases, mainly of CO
2, globally on a per country level based on time series data of the last decades.
1.3.2 The project’s target is to identify, define and quantify the main driving forces of anthropogenic CO
2 increase which results in global climate change.
1.3.3 Scenarios for a “dynamics-as-usual”-development of single driving forces (i.e., with rates of change held constant) demonstrate the relative importance of effects on the climate caused by different aspects of human impact on the CO
2 concentration.
1.3.4 A detailed analysis and factual comparison of human activity in the fields of energy supply, land use and related socio-economic fields is furthermore intended to support the development, orientation and implementation of any policy in direction to a sustainable development.
1.3.5 The quantitative information prepared in the preceding work packages is used for finding out the most contributing factors to growth in CO
2 emissions in each of the world regions.
2 WORK CONTENT
2.1 Introduction – seen from a perspective at project start
2.1.1 The present project has its place among the efforts to arrive at paths of economic evolution leading to practically implementable greenhouse gas reduction strategies. It attempts to help to gain orientation concerning the ongoing development of sectors producing CO
2 emissions and their specific inner dynamics because any measure has to build on the foreseeable dynamics-as-usual development.
2.1.2 The main interest is therefore to find out which development can be awaited in the future and to which degree this development (like for example energy efficiency improvement in different sectors, shifts between energy carriers, structural shifts between different industrial production sectors in regional differentiation, etc.) by itself already either hinders or helps to achieve CO
2 reduction targets and a sustainable climate. Based on such insights, the concentration of instruments can better be targeted into areas which seem most promising to achieve practical CO
2 mitigation.
2.1.3 The main driving forces for anthropogenic CO
2 emissions in the field of energy supply and also land use change are attempted to be identified in a quantitative way at a global and a per country level. The main societal and economic factors having led to the combustion of fossil energy carriers (energy related CO
2 emissions) and gain of new agricultural land (CO
2 from deforestation) during a period of 30 years are analysed. Future policies for CO
2 mitigation can thus be supported by additional information on future developments that could be awaited as continuation of the present structural shifts in the global systems of demand and production of food and energy.
2.1.4 Basic methodology: experimental approach and orientation towards reality. The basic idea is that the documented historic development of the techno-socio-economic evolution shows best the behaviour during time and the way of reaction of the global energy system - at least better than a previously conceived model. It is therefore not attempted to depart from existing econometric concepts and to parameterise the complex global energy system but to try to be “taught by history”, i.e., to start from “experimental reality”, i.e., “real data” and not from prefabricated understanding.
2.1.5 As a consequence no closed or consistent model will be used (like often in traditional science) as a starting point for conclusions to be drawn but a statistical analysis of time series. This methodology was already published as result of an EU project [
16,
20], [
101] (pp. 17–21), [
115].
2.1.6 The subject matter will be viewed in a systems analytical manner and therefore one main interest resides in the detection of the inner dynamics of its evolution.
2.1.7 The objective is to establish several thousands of regressions and correlations of time series and to distil out of them several dozens of characteristic paths of development.
2.1.8 The final product is planned to be rendered more easily accessible by many graphical representations.
2.1.9 At the end of the project conclusions are drawn with a view to the current discussion on the generation of emission scenarios. Their direct practical applicability is intended.
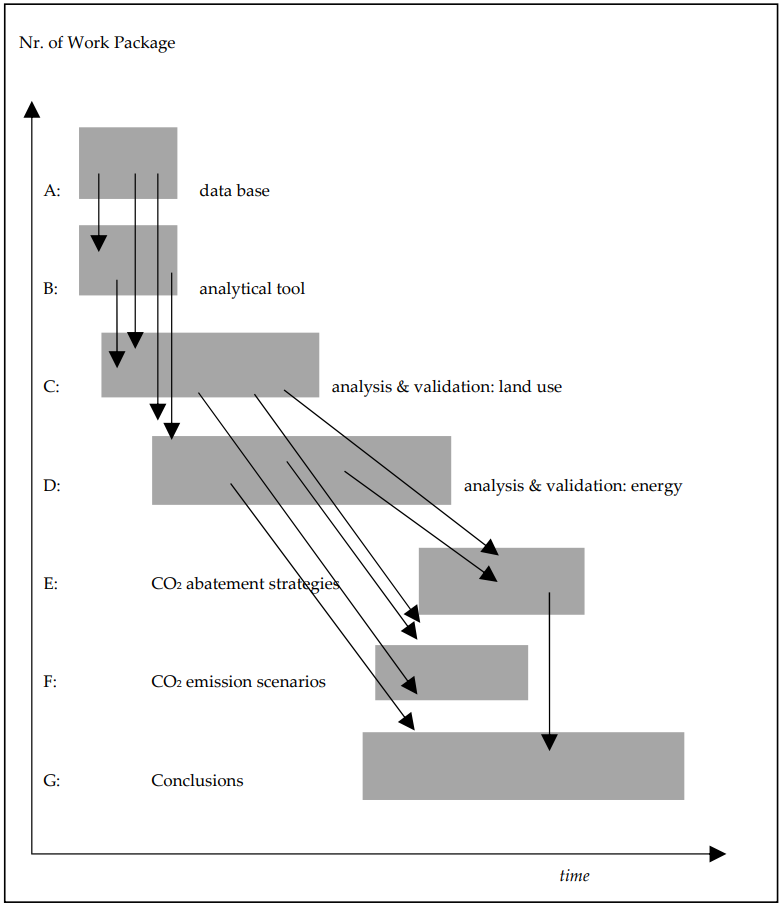
2.1.10 The individual Work Packages are the following (compare also Figure A6):
A: Enlargement of the existing database by the field of energy and by human development indicators
B: Adaptation and improvement of the analytical tool to the database
C: Analysis and validation of the socio-economic driving factors leading to CO
2 emissions from land use changes
D: Analysis and validation of the socio-economic driving factors leading to CO
2 emissions from fossil energy
E: Exploitation of results for designing CO
2 abatement strategies
F: Exploitation of results for designing a CO
2 emission module
G: Conclusions
2.2 Work Package A: Generation of the “Global Change Data Base” GCDB
2.2.1 The “Socio-Economic Database for the High Resolution Biosphere Model HRBM” which was developed in the framework of the project “The Global Carbon Cycle and Its Perturbation by Man and Climate - Part II - Biosphere”, by its second name ESCOBA (European Studies on Carbon in Ocean, Biosphere and Atmosphere), is considerably enlarged (roughly tripled) for the present project by the data of the International Energy Agency IEA covering many hundreds of variables from the fields of primary to final energy demand in different sectors for different energy carriers on a per country basis.
This newly emerging database will be called “Global Change Data Base” GCDB.
These additionally some 1500 data sets are brought into the same format as the existing database with its presently 880 sets of variables so that
(i) they could still directly be used
(ii) they can be analysed together with any other data incorporated in the existing database like economic, population and land use data and
(iii) they can be used for calculating the energy related CO
2 emissions at the same level of disaggregation and therefore can constitute the quantitative basis for describing the energy related human impact on the global carbon cycle having occurred so far.
2.2.3 In the same way as described above the variables describing social parameters from the “Human Development Report” are incorporated into the database. This will constitute another 350 data sets on a per country level for single years concerning social, educational, health, poverty and demographic aspects.
2.3 Work Package B: Adaptation and improvement of the analytical tool to the Global Change Data Base GCDB
2.3.1 The features of the database existing so far in the shape of a user-friendly and menu based interactive tool are enlarged by
(i) a facility to compute the first derivative in time,
(ii) to construct regional and continental sums and weighted averages for regions currently used in energy modelling (the IIASA 11 World Energy Scenario Regions used for their studies e.g., in the IPCC context) for aggregated analyses and
(iii) by the possibility to calculate elasticities on a regional and per country level together with the graphical representation of the regression.
2.4 Work Package C: Analysis and validation of the socio-economic driving factors leading to CO
2 emissions from land use changes
2.4.1 This work package on land use change is considered as a methodological exercise in order to prepare for the main subject of the project which is energy economics.
2.4.2 Being based on first analyses performed until now, the factors driving deforestation in the different regions of the Earth are analysed. These factors were preliminarily found to be different in different world regions and were shown to stem from changes in patterns of quantity and quality of food consumption, in patterns of global food trade, from changes in use of products for other purposes like feed and from differences in agricultural technologies (16: 311ff). Quantification of use of land for the production of wood as raw material or for biomass energy completes the agricultural analysis in the strict sense.
2.4.3 These processes are analysed by establishing the whole chain of food production and supply for the main crop “wheat” (other crops are planned for the future) and several types of meat on a per country level. Again, aggregates like the continents or eleven world regions with similar economic structure facilitate the identification of the main paths of development. Generally speaking, time series for intensity values are established as a basic methodology.
2.4.4 Among the many possible parameters, those influencing most the relevant changes are filtered out by means of a thorough and quantitative per country analysis of trends and correlations. In other words, the most robust trends in economic evolution are to be diagnosed based on the per country time series data.
2.5 Work Package D: Analysis and validation of the socio-economic driving factors leading to CO
2 emissions from fossil fuels
2.5.1 Using the same mathematical and statistical methods as described above in work package C, the global system of energy demand and production is to be analysed. Special emphasis is put on structural shifts like efficiency improvements in different sectors of the economies (industry, services, transport, ...) or shifts in the energy carriers employed (from coal to gas, to renewables like biomass or solar energy, etc., see 16: 301). The close linkage enabled by the interdisciplinary structure of the Global Change Data Base will allow analyses together with economic variables like sectorial Gross Domestic Products but also demographic and social factors. A demand side-oriented viewpoint is chosen.
2.5.2 The energy economics share of this work package consists of quantitatively analysing the Global Change Data Base GCDB with its some 2000 sets of variables, where each set of variable consists mostly of time series (20 to 30 years times 130 countries, 11 world regions and 7 continents) with the analytical tool developed in work package B. The general architecture of this analysis is determined by the causal chain “economic activity - demand of final energy - demand of primary energy - CO
2 emissions”, formally by the equity of intensity variables:
where: CO
2—level of CO
2 emissions, E
p—demand for primary energy (for a specific energy carrier), E
f—demand for final energy (for a specific energy carrier), GNP—gross national product (in a specific economic sector).
This tautology is quantitatively established for 130 countries and for the energy carriers and economic sectors permitted by the GCDB mainly for the years 1971 to 1991.
2.5.3 The techno-socio-economic share of this work package consists of quantitatively evaluating the most striking driving forces in the energy system and hence impacts on the CO
2 emission levels mainly by correlation analyses. Such driving forces could be described by selected proxy variables from the fields of economy, education, development aid, social structure, etc. The interplay of both social variables and social variables with ones from energy economics is to be analysed.
2.5.4 The picture of ongoing structural changes in the global energy system generated by the analyses in the above paragraphs is validated, compared with literature e.g., in the IPCC framework (second order draft of special report on emission scenarios: 71) and in the EEA framework (task force on emission projection). Emphasis is put on the CO
2 emission aspect with regard to the global necessity to reduce greenhouse gas emissions.
2.6 Work Package E: Exploitation of results: conditions for designing CO
2 abatement strategies
2.6.1 The main interest of the project is to find out which types of development can be awaited in the future and to which degree these possible developments by themselves already either hinder or help to achieve global CO
2 reduction targets.
2.6.2 Based on such insights to be gained from Work Packages C and D, the measures and instruments for preventing from global change could possibly be better targeted into areas which seem most promising to achieve practical CO
2 mitigation. It is taken into account that (i) the shifts in global distribution (e.g., in energy carriers or food composition) - in other terms the present relative shares and the present increase rates - may be subject to considerable change throughout the next decades and (ii) the importance of the single subsectors of economy is likely to change considerably during the time span relevant for global warming.
2.6.3 Therefore an analysis regarding the likely future relative importance of domains for CO
2 abatement (e.g., increase in meat share of nutrition and subsequent pressure on additional land use demand; energy use by traffic vs. households, ...) shall be carried out. The existence of likely saturation effects (e.g., the mere quantity of food) in many cases prevents a simple trend projection to be a good description of future developments. In this light, one main interest in designing future CO
2 abatement policies lies apparently in knowing about structural changes in our CO
2 emitting systems. Moreover, new technologies are likely to appear at a rate of diffusion specific to each of them.
2.6.4 The quantitative information prepared in the preceding work packages is used for finding out the most contributing factors to growth in CO
2 emissions in each of the world regions. Such type of information constitutes one of the main results of the present project.
2.7 Work Package F: Exploitation of results for designing CO
2 emission scenarios
2.7.1 This work package generates CO
2 emission scenarios which are able to drive also other assessments or - more specifically - global carbon cycle models in use. It uses the most contributing trends and ongoing structural changes in order to produce per country data for land use changes, energy consumption and related CO
2 emissions.
2.7.2 The analyses performed in the steps described above propose the structure of scenarios which cover the human impact on the global carbon cycle by anthropogenic CO
2 emissions and which could constitute therefore an element for scenario runs of GCMs in general. In a sense, the present project could therefore also constitute the techno-socio-economic contribution to the current models on the global carbon cycle.
2.8 Work Package G: Conclusions
2.8.1 Current hypotheses in the climate protection business might be tested on a global and quantitative level, such as the possible share contributed to a solution by:
• efficiency improvement and energy intensity improvements in different sectors
• fuel switch, e.g., to renewables.
• Global trends supporting or not the effectiveness of emissions trading on a global scale.
Based on “dynamics-as-usual developments” also a contribution to the evaluation of reduction potentials (= difference between scenarios with and without measures) could be given.
2.8.2 As a concrete case study that makes use of the main impacts on the development of a CO
2 emission path filtered out by the present project, the Austrian project NAMEA (National Accounts Matrix Including Environmental Accounts, see [
83,
84]) could provide more detailed and official data material for the generation of national Austrian scenarios.
2.8.3 The single work packages have been defined in a way that they could be dealt with roughly one after another. Figure A6 gives an overview.
Figure A6. Tentative schedule for the work packages and their interrelationship.
3.1 The proposed project contributes to the global CO
2 mitigation policy by enhancing the information needed for the design and implementation of CO
2 abatement measures. It helps to focus on most effective reduction instruments and could give information on equity issues on a global scale by quantitatively addressing driving forces for emissions. For over 2000 parameters there will be time series for 30 years with graphics and possibilities for correlation. A per country differentiation down to the scale of over 150 single states permits an easy insight into driving forces from energy, land use, population, nutrition, economy, human development and other relevant data. It is suggested to view different groups of countries as precursors of characteristic paths of techno-socio-economic evolution at different stages [
115].
3.2 In technical, natural, social and political sciences the anthropogenic greenhouse effect has gained its fixed place. A thorough interdisciplinary, quantitative and global analysis covers with a new approach the areas environment, energy, economy (E3) and land use. It identifies areas in which developments are likely to arise that can impede the success of CO
2 abatement measures. Special emphasis is put on structural changes (between energy carriers, food types, economic sectors, global trade patterns, ...) that cannot be described by single variables but that need a voluminous and interdisciplinary database like the planned one (roughly 1 Gigabyte of Excel files). In an analogue way, areas are identified that by their intrinsic dynamics of development that are likely to promise to bring about some CO
2 reduction effects (like efficiency improvements).
3.3 It is the task of the proposed project to enhance clarity on these items (megatrends, evolution, etc.) not only in a qualitative or even speculative way but as quantitatively as possible in order to render practically feasible a path into a sustainable future. Correlation between any of the roughly 2000 data sets in time series will be easily feasible on a modern PC.
3.4 As a result of the so-called “flexible instruments” decided upon during the Kyoto Conference each nation will be bound to deliver sound emission projections that are likely to serve as baselines for the evaluation of reduction measures. Also, therefore a clearer view of the techno-socio-economic forces driving CO
2 emissions will be of common interest, keeping in mind that (i) fossil energy carriers make up for the main share of CO
2 emissions and (ii) energy related emissions make up for the most important part of CO
2 emissions.
Notes
1. The symbolism of “sailing across an ocean” is introduced hereby: The Atlantic Ocean cannot be traversed by paddling, therefore change the strategy when passing by the Channel Islands and reconstruct the boat into a sailing boat! This is symbolic for “discern global long-term trends and make use of them – this is what “surfing” means in the symbolic context of this article.
2. As an initial observation see the Austria Environment Minister’s claim [
160] that despite a rise of 5.9% in CO
2 emissions, the Kyoto target (of 13% reduction) until 2008-12 would be still reachable, from his then perception (which did not come true, as I say, due to lack of effort). In fact, the author has been accused of mentioning the correct CO
2 emissions data to a journalist back then even if these data were factually correct, and still are. Such incident diminished the author’s trust in the functioning of public administration in his home country.
3. As was perceived since 1990s and thus, sets of WEM and WAM scenarios are required within the UNFCCC process, meaning scenarios with and without (additional) measures.
4. This supposition regarding climate protection unexpected came true in another area, namely for quality improvement of water bodies as required by the EU Water Framework Directive, which is an object lesson for foresight in environmental care.
5. actually, a methodical necessity is a certain homelessness in relation to an “own” specialist discipline. In fact, often in science, other disciplines are disregarded by specialists in one discipline (the author has a plethora of such experiences). Thus, a trans-disciplinary approach means a waiver of disregard from the side of these professional communities.
6. although cross-country studies are identified as valuable tools [
161] (p. 151), thus one pillar for here.
7. called the “Jiu-Jitsu” principle by Ossimitz ([
113] p. 41): “Make use of the forces already prevalent in a system and direct them in a way useful for you”. The same approach is called “surfing” global change (or: surfing on global change trends) by the author [
104] (p. 268).
8. [
162] (p. 550), [
163] (p. 1531).
9. e.g., technology [
164], societal structure [
165], market [
166], institutions [
167], etc.
10. that do not share the “god game” approach of built-in historic wisdom based on algorithms [
168].
11. E.g. in [
148].
12. A considerable advantage of the proposed methodology – if combined with the concept of “path of development” (e.g. along rising GDP/cap) – consists of the ability of the methodology to overcome the principal restriction of reliability of projections to (following a rule of thumb) ½ of the period for which data exist. If ever the arrays of data for all countries were positioned near to a common path (which is the very criterion to be checked), the basis of expansion into a likely future path stretches over “states from very poor to very rich” which is a substantially larger information basis than “states during some decades”. Another advantage is that the 1st and 2nd derivatives of data series can be expected to exclude a number of flaws negatively affecting statistical analysability.
13. Issues available as e-journals, among which are: Journal of Economic Literature, Quarterly Journal of Economics, American Economic Review, Ecological Economics, Econometrica, Economic Policy, Economic Geography, Economy and Society, Energy, Energy Economics, Journal of Financial Economics, Journal of Political Economy, NBER Macroeconomic Annals, Social Indicators Research.
14. This “formula” has been used widely, among others by IIASA, IPCC reports, e.g. [
169,
170].
15. Aggregations are possible into continents or the 11 regions of the IIASA global models (used e.g. for IPCC).
16. The UN statistics provide 9 sectors: Agriculture, Mining, Manufacturing, Electricity, Construction, Trade, Transport, Finance, Services.
17. Social constructivism is the (didactic) basis for “SurfingGlobalChange” [
171] (p. 36), [
172].
References
1.
IPCC. 28th Conference of the Parties 2023, Dubai, United Arab Emirates, 2023. Available online:
https://unfccc.int/cop28 (accessed on 6 November 2023).
2.
Khan I, Zakari A, Zhang J, Dagar V, Singh S. A study of trilemma energy balance, clean energy transitions, and economic expansion in the midst of environmental sustainability: New insights from three trilemma leadership. Energy 2022, 248, 123619. doi:10.1016/j.energy.2022.123619.
3.
Khan I, Zakari A, Dagar V, Singh S. World energy trilemma and transformative energy developments as determinants of economic growth amid environmental sustainability. Energy Econ. 2022, 108, 105884. doi:10.1016/j.eneco.2022.105884.
4.
Christian D. Macrohistory: The Play of Scales.
Soc. Evol. Hist. 2005,
4, 22–59.
[Google Scholar]
5.
Laszlo E. Global Bifurcation: The Decision Window.
J. Glob. Stud. 2011,
2, 3–6.
[Google Scholar]
6.
Zakari A, Khan I, Tan D, Alvarado R, Dagar V. Energy efficiency and sustainable development goals (SDGs). Energy 2022, 239, 122365. doi:10.1016/j.energy.2021.122365.
7.
Meadows D, Randers J, Meadows D. Limits to Growth: The 30-Year Update; Chelsea Green: White River Junction, VT, USA, 2004.
8.
Foerster Hv, Mora PM, Amiot LW. Doomsday: Friday, 13 November AD. 2026. Science 1960, 132, 1291–1295.
9.
Wallerstein I. Economic cycles and socialist policies.
Futures 1984,
16, 579–585.
[Google Scholar]
10.
Harvey D. The Condition of Postmodernity: An Enquiry into the Origins of Cultural Change; Wiley-Blackwell: Oxford, UK, 1989.
11.
Nisal A, Diwekar U, Hanumante N, Shastri Y, Cabezas H, Rico Ramirez V, et al. Evaluation of global techno-socio-economic policies for the FEW nexus with an optimal control based approach. Front. Sustain. 2022, 3, 948443. doi:10.3389/frsus.2022.948443.
12.
Pandyaswargo AH, Wibowo AD, Onoda H. Socio-techno-economic assessment to design an appropriate renewable energy system for remote agricultural communities in developing countries. Sustain. Prod. Consum. 2022, 31, 492–511. doi:10.1016/j.spc.2022.03.009.
13.
Ahamer G. Scenarios of Systemic Transitions in Energy and Economy. Foresight STI Govern. 2022, 16, 17–34. doi:10.17323/2500-2597.2022.3.17.34.
14.
Cherp A, Vinichenko V, Jewell J, Brutschin E, Sovacool B. Integrating techno-economic, socio-technical and political perspectives on national energy transitions: A meta-theoretical framework. Energy Res. Soc. Sci. 2018, 37, 175–190. doi:10.1016/j.erss.2017.09.015.
15.
Scheller F, Johanning S, Bruckner T. IRPsim: A Techno-socio-economic Energy System Model Vision for Business Strategy Assessment at Municipal Level; Beiträge des Instituts für Infrastruktur und Ressourcenmanagement, No. 02/2018; Institut für Infrastruktur und Ressourcenmanagement (IIRM), Universität Leipzig: Leipzig, Germany, 2018.
16.
Ahamer G. Mapping Global Change – Geographic Perspectives from Local Pollution to Global Evolution; Springer: Dordrecht, The Netherlands, 2019. https://link.springer.com/book/10.1007/978-3-319-51704-9.
17.
Aihua L, Miglietta PP, Toma P. Did carbon emission trading system reduce emissions in China? An integrated approach to support policy modeling and implementation. Energy Syst. 2022, 13, 437–459. doi:10.1007/s12667-021-00438-8.
18.
Toma P, Miglietta PP, Morrone D, Porrini D. Environmental risks and efficiency performances: The vulnerability of Italian forestry firms. Corporate Soc. Responsib. Environ. Manag. 2020, 27, 2793–2803. doi:10.1002/csr.2002.
19.
Grübler A. Managing the Global Environment.
Environ. Sci. Technol. 2000,
34, 184A–187A.
[Google Scholar]
20.
Ahamer G, Esser G. A Scenario Generator for Land Use Changes for Use in Global Carbon Cycle Models like the HRBM.
Sci. Géol. Bull. 1997,
50, 183–217.
[Google Scholar]
21.
Dator J. Technology and Global Change: Arnulf Grübler. Cambridge University Press, Cambridge, UK, 1998. Technol. Forecast. Soc. Change 1999, 62, 259–261. doi:10.1016/S0040-1625(99)00062-1.
22.
Siegel D. Technological Change and the Environment: Arnulf Grübler, Nebojsa Nakićenović, William D. Nordhaus (Eds.), Resources for the Future Press, Washington, DC, 2002, 450 pp., ISBN 1 891853-46-5. Struct. Change Econ. Dyn. 2004, 15, 235–238. doi:10.1016/j.strueco.2003.09.001.
23.
Toth FL. Technological change and the environment: Arnulf Grübler, Nebojsa Nakićenović and William D. Nordhaus (Eds.); Resources for the Future, Washington, DC and International Institute for Applied Systems Analysis, Laxenburg, Austria, 2002. Energy Policy 2004, 32, 143–147. doi:10.1016/S0301-4215(03)00178-2.
24.
Dagher L, Ruble I. Challenges for CO2 mitigation in the Lebanese electric-power sector. Energy Policy 2010, 38, 912–918. doi:10.1016/j.enpol.2009.10.042.
25.
Salih AA, Al-Sharayah JA, Abou-Moghli A. Unlocking the potential of big data through open innovation on strategic foresight: An empirical analysis. Int. J. Data Netw. Sci. 2024, 8, 329–336. doi:10.5267/j.ijdns.2023.9.021.
26.
Moreno JC, Berenguel M, Donaire JG, Guzmán JL, Giagnocavo CL. A pending task for the digitalisation of agriculture: A general framework for technologies classification in agriculture.
Agric. Syst. 2024,
213, 103794.
[Google Scholar]
27.
Milojević I, Inayatullah S. Narrative foresight. Futures 2015, 73, 151–162. doi:10.1016/j.futures.2015.08.007.
28.
Jungk R. Tomorrow Is Already Here; Simon and Schuster: New York, NY, USA, 1954.
29.
Jungk R. Brighter than a Thousand Suns: A Personal History of the Atomic Scientists; Harcourt Brace: New York, NY, USA, 1958.
30.
Jungk R. Future Workshops: How to Create Desirable Futures; Institute for Social Inventions: London, UK, 1987.
31.
Schleicher S. Incentives to Environmental Innovation. In IPCC, Climate Change. Policy Measures and Their Implications, Proceedings of IPCC Working Group III, Center for Global Environmental Research, Tsukuba, 1994, published by WMO/UNEP, Geneva. Available online:
https://stg-wedocs.unep.org/handle/20.500.11822/29173 (accessed on 6 November 2023).
32.
Schleicher S. On the Use of Energy Elasticities. In Global Warming; Cambridge University Press: Cambridge, UK, 1994.
33.
Schleicher S. Endogenous Technical Progress Enhances CO2 Reduction Policies: Simulation Results for Austria. Environment and Resource Economics; WIFO: Vienna, Austria, 1995.
39.
Koruca Hİ, Urgancı KB, Gamoura SC. The Significance of Human Performance in Production Processes: An Extensive Review of Simulation-Integrated Techniques for Assessing Fatigue and Workload. Lect. Notes Mech. Eng. 2024, 555–566. doi:10.1007/978-981-99-6062-0_51.
40.
Gupta P, Chauhan S, Paul J, Jaiswal MP. Social entrepreneurship research: A review and future research agenda.
J. Bus. Res. 2020,
113, 209–229. doi:10.1016/j.jbusres.2020.03.032.
[Google Scholar]
41.
Bezold C. Lessons from using scenarios for strategic foresight.
Technol. Forecast. Soc. Change 2010,
77, 1513–1518. doi:10.1016/j.techfore.2010.06.012.
[Google Scholar]
43.
Rauch H. Partizipation and Leistung in der Großgruppe. In Kölner Zeitschrift für- Soziologie and Sozialpsychologie: ‘Gruppensoziologie’; Westdeutscher Verlag: Leverkusen, Germany, 1983.
44.
Rauch H. Das Prinzip der Herausforderung; Peter Lang: Frankfurt am Main, Germany, 1985.
45.
Rauch H.
The Challenge Principle; Pre-Publication: IfS, Vienna, as the English translation of Rauch 1983, © Herbert Rauch Wien, published by Institut für Socialanalyse, Vienna, 1983. ISBN 3-900 510-03-2. Available online:
https://www.biorama.eu/rauch-iv/ (accessed on 6 November 2023).
46.
Rauch H, Strigl A. Vienna Declaration; European Forum for Sustainable Development ESD: Vienna, Austria, 2005.
47.
Rauch H. Reframing for global sustainability: the second manifesto for the turn of the Titanic.
Multicult. Educ. Technol. J. 2013,
7, 151–175. doi:10.1108/17504971311328053.
[Google Scholar]
48.
Rauch H. Naming is taming: outlining psycho-social hypotheses with regard to the present global situation.
Campus-Wide Inf. Syst. 2014,
31, 100–107. doi:10.1108/CWIS-12-2013-0067.
[Google Scholar]
49.
Rauch H. Outline for a European democratic citizen service (EDC) – a five-sector crisis training for all young Europeans. Int. J. Foresight Innov. Policy 2017, 12, 69–80. doi:10.1504/IJFIP.2017.085819.
50.
Rauch H. For a Europe of cultural regions. Int. J. Foresight Innov. Policy 2018, 13, 211–222. doi:10.1504/IJFIP.2018.097079.
51.
Rauch H. Geopolitical tectonics. Int. J. Foresight Innov. Policy 2020, 14, 275–291. doi:10.1504/IJFIP.2020.10033263.
52.
Rauch H. Global organisation for overcoming risks (GOOR). Int. J. Foresight Innov. Policy 2020, 14, 103–119. doi:10.1504/IJFIP.2020.10033259.
53.
Rauch H. The challenge principle: introduction to the social analysis of synoptics: method, theory and case studies – synoptics part I. Int. J. Foresight Innov. Policy 2020, 14, 146–172. doi:10.1504/IJFIP.2020.10033269.
54.
Rauch H. Application of the synoptics model for the social analysis of small and large groups – synoptics part II. Int. J. Foresight Innov. Policy 2020, 14, 173–197. doi:10.1504/IJFIP.2020.111249.
55.
Rauch H. SYNOPTICS, Part III: application of the synoptics model for the social analysis of mass formations and organisations.
Int. J. Glob. Environ. Issues 2021,
43, 571–592.
[Google Scholar]
56.
Rauch H. SYNOPTICS, Part IV: application of the synoptics model for the social analysis of territorial and functional compound systems.
Int. J. Glob. Environ. Issues 2021,
43, 643–663.
[Google Scholar]
57.
Rauch H. SYNOPTICS, Part V: application of the synoptics model for the social analysis of the sovereign system. Int. J. Glob. Environ. Issues 2021, 19, 331–353. doi:10.1504/IJGENVI.2020.115931.
58.
Rauch H. SYNOPTICS, Part VIII: application of the organizational model of synoptics with regard to companies, territorial compounds and functional compounds. Int. J. Foresight Innov. Policy 2021, 15, 276 –298. doi:10.1504/IJFIP.2021.118848.
59.
Rauch H. SYNOPTICS, Part IX: the six basic sentences for synoptic social analysis – theoretical and practical steps towards a psychosocial analysis of society. Int. J. Foresight Innov. Policy 2021, 15, 76–87. doi:10.1504/IJFIP.2021.117556.
60.
Rauch H. SYNOPTICS, Part VI: synoptical analysis of the psychic field. Int. J. Glob. Environ. Issues 2022, 20, 194 –221. doi:10.1504/IJGENVI.2021.121001.
61.
Rauch H. SYNOPTICS, Part VII: application of the synoptics model for the social analysis of large states: Republic of South Africa. Int. J. Glob. Environ. Issues 2022, 20, 324–349. doi:10.1504/IJGENVI.2021.120991.
62.
Rauch H. SYNOPTICS, Part X: application of the synoptics model for the social analysis of states: Colombia 1991, and Nigeria 1992. Int. J. Glob. Environ. Issues 2023, 22, 145–170. doi:10.1504/IJGENVI.2023.134008.
63.
Matzenberger J. A novel approach to exploring the concept of resilience and principal drivers in a learning environment.
Multicult. Educ. Technol. J. 2013,
7, 192–206.
[Google Scholar]
64.
Schwarz I. Geography, economic education and global education: European and Austrian aspects of the “Fifobi – developing business competencies in school” project.
Multicult. Educ. Technol. J. 2012,
6, 301–311.
[Google Scholar]
65.
Wittmann V. Gender and empowerment in South Africa.
Multicult. Educ. Technol. J. 2012,
6, 248–260.
[Google Scholar]
71.
IPCC. Special Report on Emission Scenarios; Cambridge University Press: Cambridge, UK, 2000.
72.
Grübler A, Bai X, Buettner T, Dhakal S, Fisk DJ, Ichinose T, et al. Chapter 18: Urban Energy Systems. In Global Energy Assessment; Cambridge University Press: Cambridge, UK; pp. 1307–1400.
73.
Dagher L, Yacoubian T. The causal relationship between energy consumption and economic growth in Lebanon. Energy Policy 2012, 50, 795–801. doi:10.1016/j.enpol.2012.08.034.
74.
Ahamer G. A Planet-Wide Information System.
Campus-Wide Inf. Syst. 2013,
30, 369–378.
[Google Scholar]
75.
Openshaw S. The Modifiable Areal Unit Problem; Geo Books: Norwich, UK, 1983.
76.
Bartiaux F, van Ypersele JP. The role of population growth in global warming. In Proceedings of the International Population Conference, International Union for the Scientific Study of Population (IUSSP), Liege, Belgium, 1993; Volume 4, pp. 33–54.
77.
Zakari A, Toplak J, Ibtissem M, Dagar V, Khan MK. Impact of Nigeria’s industrial sector on level of inefficiency for energy consumption: Fisher Ideal index decomposition analysis. Heliyon 2021, 7, e06952. doi:10.1016/j.heliyon.2021.e06952.
78.
Udemba EN, Dagar V, Peng X, Dagher L. Attaining environmental sustainability amidst the interacting forces of natural resource rent and foreign direct investment: Is Norway any different? OPEC Energy Rev. 2023. doi:10.1111/opec.12292.
79.
FAO 2023. FAO Statistics, Agricultural Database. Available online:
www.fao.org/statistics/ (accessed on 7 September 2023).
80.
Messner S, Schrattenholzer L. MESSAGE–MACRO: linking an energy supply model with a macroeconomic module and solving it iteratively. Energy 2000, 25, 267–282. doi:10.1016/S0360-5442(99)00063-8.
81.
Dagher L, Fattouh B, Jamali I. Oil price dynamics and energy transitions in the Middle East and North Africa: Economic implications and structural reforms.
Energy Policy 2020,
139, 111329. doi:10.1016/j.enpol.2020.
[Google Scholar]
82.
Dagher L, Jamali I, Abi Younes O. Extreme energy poverty: The aftermath of Lebanon’s economic collapse. Energy Policy 2023, 183, 113783. doi:10.1016/j.enpol.2023.113783.
85.
UNSTAT 2023, United Nations Statistics Division. Available online:
https://unstats.un.org/ (accessed on 6 November 2023).
87.
Müller U, Ahamer G, Peters H, Weinke E, Sapper N, Salcher E. Technologies and collaborative education strengthen conviviality in rural communities in the Alps and in Senegal.
Multicult. Educ. Technol. J. 2013,
7, 207–227.
[Google Scholar]
88.
Duraković E, Feigl B, Fischer B, Fleck C, Galler L-M, Heinrich J, et al. Dialogic Global Studies for Multicultural Technology Assessment.
Multicult. Educ. Technol. J. 2012,
6, 261–286. doi:10.1108/17504971211279527.
[Google Scholar]
89.
Kumar P, Gupta S, Dagar V. Sustainable energy development through non-residential rooftop solar photovoltaic adoption: Empirical evidence from India. Sustain. Dev. 2023. doi:10.1002/sd.2644.
92.
PWT 2023, Penn World Tables, Center for International Comparisons of Production at the University of Pennsylvania. Available online:
https://pwt.sas.upenn.edu/ (accessed on 6 November 2023).
93.
Ahamer G. A Structured Basket of Models for Global Change. In Environmental Information Systems in Industry and Public Administration; Idea Group Publishing, Hershey, PA, USA, 2001; pp. 101–136.
94.
Rostow WW. The Stages of Economic Growth: A Non-communist Manifesto; Cambridge University Press: Cambridge, UK, 1960.
95.
Landes DS. The Wealth and Poverty of Nations: Why Some Are So Rich and Some So Poor; W.W. Norton: New York, NY, USA, 1999.
96.
Jäger J, Springler E. Ökonomie der Internationalen Entwicklung – Eine Kritische Einführung in die Volkswirtschaftslehre; Series “Geschichte – Entwicklung – Politik”, GEP14; Mandelbaum: Vienna, Austria, 2012.
97.
Fischer K, Hödl G, Sievers W. Klassiker der Entwicklungstheorie – Von Modernisierung bis Post-Development; Series “Geschichte – Entwicklung – Politik”, GEP11; Mandelbaum, Vienna, Austria, 2008.
98.
Fischer K, Hauck G, Boatcă M. Handbuch Entwicklungsforschung; Springer: Berlin, Germany, 2016.
99.
McTaggart L. The Power of Eight: Harnessing the Miraculous Energies of a Small Group to Heal Others, Your Life and the World; Hay House UK, Carlsbad, USA, 2019.
100.
Ahamer G. Applying Global Databases to Foresight for Energy and Land Use – the GCDB method. Foresight SDI Govern. 2018, 14, 46–61. doi:10.17323/2500-2597.2018.4.46.61.
101.
Ahamer G. Structured Data Facilitate Learning Design for Energetic Transition. Int. J. Technol. Enhanc. Learn. 2018, 8, 1–21. doi:10.4018/IJTEM.2018070101.
102.
Ahamer G. Tracing Global Dynamics – Milestones, Landmarks and Transitions in Techno-Socio-Economic Evolution; Springer: Dordrecht, The Netherlands, 2016.
103.
Ahamer G. Kon-Tiki: spatio-temporal maps for socio-economic sustainability. J. Multicult. Educ. 2014, 8, 206–223. doi:10.1108/JME-05-2014-0022.
104.
Ahamer G. Applying student-generated theories about global change and energy demand. Int. J. Inf. Learn. Technol. 2015, 32, 258–271. doi:10.1108/IJILT-01-2015-0002.
106.
Buchner B, Carraro C. Emission Trading Regimes and Incentives to Participate in International Climate Agreements.
Eur. Environ. 2004,
14, 276–289.
[Google Scholar]
107.
Buchner B, Carraro C. Participation Incentives and Technological Change: From Top-Down to Bottom-Up Climate Agreements. Mimeo, Fondazione Eni Enrico Mattei, Venice, 2005. Available online:
www.feem.it (accessed on 6 November 2023).
108.
IPCC. Climate Change 2001: Synthesis Report; A Contribution of Working Groups I, II, and III to the Third Assessment Report of the Intergovernmental Panel on Climate; Cambridge University Press: Cambridge, UK, 2001.
109.
Kratena K, Schleicher S, Schnitzer H, Gartner H, Jank W, Ahamer G, et al. 1998.
Das Toronto-Technologieprogramm – Maßnahmen, Effekte und gesamtwirtschaftliche Kosten eines Technologieprogramms zur Erreichung des Toronto-Emissionsziels für CO2. Austrian Council on Climate Change ACCC, Wien/Graz. Available online:
http://www.accc.gv.at/pdf/ttp98.pdf (accessed on 6 November 2023).
110.
Sterman JD. Business Dynamics: Systems Thinking and Modelling for a Complex World; McGraw-Hill, Boston, MA, USA, 2000.
112.
Raskin P. Great Transition: The Promise and Lure of the Times Ahead; Stockholm Environment Institute, Boston, MA, USA, 2002.
114.
Richmond B. An Introduction to Systems Thinking; Stella Software, High Performance Systems: Hanover, Germany, 2001.
115.
Ahamer G. Supply and Demand in Energy and Agriculture: Emitters of CO
2 and Possibilities for Global Biomass Energy Strategies.
World Resour. Rev. 1997,
9, 491–507.
[Google Scholar]
116.
Wang C, Chen J, Zou J. Decomposition of energy related CO
2 Emission in China.
Energy 2005,
30, 73–83.
[Google Scholar]
117.
Ayres RU. The minimum complexity of endogenous growth models: the role of physical resource flows.
Energy 2001,
26, 817–838.
[Google Scholar]
118.
Odum HT, Odum EC. The prosperous way down.
Energy 2006,
31, 21–32.
[Google Scholar]
119.
Tainter JA, Allen TFH, Hoekstra TW. Energy transformations and post-normal science. Energy 2006, 31, 44–58. doi:10.1016/j.energy.2004.06.002.
120.
Ang BW, Zhang FQ. A survey of index decomposition analysis in energy and environmental studies.
Energy 2000,
25, 1149–1176.
[Google Scholar]
121.
Wurman RC. Information Anxiety, A Guidebook for the Information Age; Que: Indianapolis, IN, USA, 2000.
122.
Nielsen J. Designing Web Usability, The Practice of Simplicity; New Riders Publishing: Indianapolis, IN, USA, 2000.
123.
Norman DA. The Invisible Computer, Why Good Products Can Fail, the Personal Computer Is So Complex, and Information Appliances Are the Solution; MIT Press: Cambridge/Boston, MA, USA, 2000.
124.
Schrei C. Minimal. Master Thesis, Institute of Information Design, FH Joanneum, Graz, Austria, 2005.
125.
Daly H. Beyond growth. The Economics of Sustainable Development; Beacon Press: Boston, MA, USA, 1996.
126.
Gehmacher E. Die Politik der Evolution – Die Evolution der Politik. Das Wachstum sozialer Systeme und seine Regulation: Gesellschaftliche Ursachen und Dynamiken. In Die Ursachen des Wachstums, Unsere Chancen zur Umkehr; Kremayr & Scheriau: Wien, Austria, 1996; pp. 86–107.
127.
Buchner B. A survey of models used for the analysis of the international climate regime; FEEM Working Paper, Draft, January 2004. Available online:
http://www.feem.it (accessed on 6 November 2023).
128.
Toth FL. Discounting in integrated assessments of climate change.
Energy Policy 1995,
23, 403–409.
[Google Scholar]
129.
Lovins AB, Aranow B. Winning the Oil Endgame. Innovation for Profits, Jobs and Security; Rocky Mountain Institute: Snowmass, CO, USA, 2004.
130.
Buonanno P, Carraro C, Galeotti M. Endogenous Induced Technological Change and the Costs of Kyoto.
Resour. Energy Econ. 2003,
25, 11–35.
[Google Scholar]
132.
Buchner B, Carraro C. Economic and Environmental Effectiveness of a Technology-based Climate Protocol, nota di lavoro no. 61.2004, CCMP at FEEM, Venice. Available online:
http://cpn.zew.de/publ.html (accessed on 6 November 2023).
133.
Heyerdahl T. Kon-Tiki. Ein Floß treibt über den Pazifik; Bertelsmann: Berlin, Germany, 1958.
136.
Summers R, Heston A. The Penn World Table (Mark5): An expanded set of international comparisons, 1950–1988.
Q. J. Econ. 1991,
106, 327–368.
[Google Scholar]
138.
Jones CI. Time Series Tests of Endogenous Growth Models.
Q. J. Econ. 1995,
110, 495–525.
[Google Scholar]
139.
Islam SMN, Munasinghe M, Clarke M. Making long-term economic growth more sustainable: evaluating the costs and benefits.
Ecol. Econ. 2003,
47, 150–166.
[Google Scholar]
140.
Barro RJ. Economic Growth in a cross section of countries.
Q. J. Econ. 1991,
106, 407–443.
[Google Scholar]
141.
Barro RJ. Human Capital and Growth.
Am. Econ. Rev. 2001,
91, 12–17.
[Google Scholar]
143.
Ahamer G. Klimamodelle und Klimawandel [Climate models and Climate change]; Report BE-098, Umweltbundesamt: Wien, Austria, 1998.
144.
Ang BW, Liu FL. A new energy decomposition method: perfect in decomposition and consistent in aggregation.
Energy 2000,
26, 537–548.
[Google Scholar]
145.
Galilei G. Sidereus Nuncius [News about New Stars]; Suhrkamp: Berlin, Germany, 2002.
146.
Breiling M, Hashimoto S, Sato Y, Ahamer G. Rice-related greenhouse gases in Japan, variations in scale and time and significance for the Kyoto protocol.
Paddy Water Environ. 2005,
3, 39–46.
[Google Scholar]
147.
Ahamer G. Global Energy Use and Land Use Change in Agriculture. In Macroeconomic and Agricultural Aspects of CO2 Emission; Wissenschaftsverlag Vauk: Kiel, Germany, 1996; pp. 51–66.
148.
Van den Bergh JC, Stagl S. Coevolution of economic behaviour and institutions: Towards a theory of institutional change. J. Evol. Econ. 2003, 13, 289–317. doi:10.1007/s00191-003-0158-8.
149.
Nelson RR. Recent evolutionary theorizing about economic change.
J. Econ. Lit. 1995,
23, 48–90.
[Google Scholar]
150.
Bossel H. Modellbildung und Simulation - Konzepte, Verfahren und Modelle zum Verhalten dynamischer Systeme; Vieweg: Wiesbaden, Germany, 1994.
151.
Sigmund K. Complex Adaptive Systems and the Evolution of Reciprocation.
Ecosystems 1998,
1, 444–448.
[Google Scholar]
152.
Hofbauer J, Sigmund K. Evolutionary Game Dynamics.
Bull. Am. Math. Soc. 2003,
40, 479–519.
[Google Scholar]
153.
Drysek JS. Discursive Democracy: Politics, Policy, and Political Science; Cambridge University Press: Cambridge, UK, 1990.
154.
Tschandl M. Kann man Ethik-Management lehren? In Lernen als selbstverantwortliches Berufshandeln, Schriften zum Bildungsrecht und zur Bildungspolitik; Verlag Österreich: Vienna, Austria, 2003.
155.
Tschandl M. The Challenge of the EU Enlargement; Leykam Verlag: Graz, Austria, 2005.
156.
ESD. Series of Discussions in the “European Forum for Sustainable Development”; ESD: Vienna, Austria, 2005.
157.
Medidaprix. Mediendidaktischer Hochschulpreis, Digitale Medien in Lehre und Hochschulentwicklung 2007. Available online:
www.medidaprix.org (accessed on 6 November 2023).
160.
Standard 2005, Treibhausgas-Plus von 5,9 Prozent – Umweltminister Bartenstein: Kyoto ist trotzdem erreichbar. Tageszeitung “Der Standard”. 20.1.2005. Available online:
http://derstandard.at/?id=1924371 (accessed on 6 December 2023).
161.
Temple J. The new growth evidence.
J. Econ. Lit. 1999,
37, 112–156.
[Google Scholar]
162.
Sun JW. Energy demand in the fifteen European Union countries by 2010 —A forecasting model based on the decomposition approach.
Energy 2001,
26, 549–560.
[Google Scholar]
164.
Fagerberg J. Technology and International Differences in Growth Rates.
J. Econ. Lit. 1994,
32, 1147–1175.
[Google Scholar]
165.
Ehrlich I, Lui F. Bureaucratic Corruption and Endogenous Economic Growth. J. Polit. Econ. 1999, 107, 54–76. doi:10.1086/250111.
166.
Ades AF, Glaeser EL. Evidence on Growth, Increasing Returns, and the Extent of the Market.
Q. J. Econ. 1999,
114, 1025–1045.
[Google Scholar]
167.
Acemoğlu D, Johnson S, Robinson JA. Reversal of Fortune: Geography and Institutions in the Making of the Modern World Income Distribution.
Q. J. Econ. 2002,
117, 1231–1294.
[Google Scholar]
169.
Nakićenović N, Grübler A, McDonald A. Global Energy Perspectives; Cambridge University Press: Cambridge, UK, 1998.
170.
Grübler A, Nakićenović N, Victor DG. Dynamics of energy technologies and global change.
Energy Policy 1999,
27, 247–280.
[Google Scholar]
171.
Foerster Hv. Wahrheit ist die Erfindung eines Lügners – Gespräche für Skeptiker; Carl-Auer-Systeme Verlag: Heidelberg, Germany, 2003.
172.
Dagar V, Yadav A. Constructivism: A Paradigm for Teaching and Learning. Arts Soc. Sci. J. 2016, 7. doi:10.4172/2151-6200.1000200.