1. Introduction
In the quest for decarbonisation, it is essential for different sectors of the economy to collaborate and invest significantly [
1]. The Helium Closed Cycle (HCC) presents a promising avenue for decarbonization by integrating closed-cycle gas turbine technology with hydrogen production. This research explores the HCC system’s dual functionality in meeting energy demands while generating hydrogen, crucial for sustainable and clean energy transitions. Utilizing helium as a working fluid enhances efficiency and minimizes environmental impact, aligning with global efforts to reduce greenhouse gas emissions [
2]. As the world intensifies efforts towards a low-carbon future, understanding and harnessing innovative systems like HCC become imperative for achieving sustainable and environmentally responsible energy solutions. This evaluation focuses on submersible power stations that utilize a helium closed-cycle gas turbine. The concept of a mobile medium-depth submersible gas turbine was conceived at Cranfield [
3] on the basis that it is earthquake and tsunami-proof. A cost analysis is planned soon; where there is an expectation that it could be competitive given the absence of the need to purchase land and invest in widespread construction installations. Furthermore, it would benefit from economies of scale given that a single shipyard could produce tens or even hundreds of these submersibles. These economies are likely to balance the increased costs of the additional parts needed for propulsion and installation and the construction of the hull. Perhaps its most important advantage is that it is proliferation proof. Such a machine could be made and decommissioned in the UK. Similarly, the refuelling process should also take place in the UK where a submersible power plant could leave the generation site and return to a UK base for refuelling. Given the infrequent need for refuelling a very small number of spare installations would be needed. So, on location the submersible would only require suitably protected docking and electricity transmission facilities. In the present case the assumption is made that the plant delivers electricity to local utilities but is made, owned, maintained and operated by the UK. This study offers, for the first time, a quantitative perspective on the helium closed-cycle gas turbine-based infrastructure needs resulting from the evaluation of the two scenarios. In the first scenario, energy requirements were based on replacing fossil fuels with submersible power stations (helium closed cycle gas turbines). In contrast, the second scenario included maintaining energy exports at levels like in the past and substituting oil with hydrogen.
2. Energy Demand Prediction for Libya in 2050
The urgency, global nature, and necessity for substantial investments for decarbonisation are widely recognized [
1,
4]. These investments are crucial to preserve the significant progress achieved over the past century in reducing global poverty [
5]. The proposal of global electricity interconnections to achieve worldwide decarbonization of the energy system is put forth. This proposal entails the integration of renewable energy sources and the exchange of electricity among different regions.
Hence, environmental preservation, sustained economic growth, and the wise use of natural resources are inextricably linked [
6,
7,
8]. Major investors are already gearing up for this transition [
9,
10]. The philosophy of concurrent economic and environmental sustainability, the recognition of the issue’s global nature, and the urgency to engage young talent are paramount. Collaborative efforts spanning multiple sectors in large economic entities can yield significant economies of scale and experiential learning.
EIA plays a distinctive role by offering an impartial perspective on energy markets, which contributes to enhanced transparency and fosters public comprehension of crucial energy matters. In recent times, EIA has expanded its program to cater to a growing clientele, providing coverage of intricate and interconnected energy markets. While renewables will emerge as the primary source for new electricity generation, the utilization of natural gas, coal, and increasingly batteries will aid in meeting power demand and ensuring the reliability of the grid [
11].
This necessitates comprehensive and coordinated transition strategies that span across many economic sectors. In this study, a knowledge gap is addressed by introducing a novel technophilosophical approach [
12] providing a clear understanding of the challenges and requirements, thereby informing these strategies. A comprehensive and quantitative country-level replacement analysis of this kind has not been previously reported in public literature.
Libya, a leading oil exporter and the home country of one of the authors has been selected, here, as a case study for decarbonisation by 2050. Given its size and the planned replacement of hydrocarbon exports with green energy, Libya is a suitable candidate for decarbonisation, permitting an analysis that is both useful and representative [
13]. The volatile political situation in the country posed challenges in selecting a baseline for the study. However, in hopeful anticipation for the country’s journey towards peace and prosperity, national and international data were accessed to estimate future energy demands and daily consumption patterns [
14,
15,
16,
17,
18,
19].
The urgency to decarbonise is a global matter that necessitates significant investments [
1,
4]. These investments are required to preserve the remarkable progress made in reducing global poverty over the past [
5]. As a result, environmental conservation, sustained economic growth, and prudent use of natural resources must proceed in tandem. Major investors have already begun preparing for these transitions [
9,
10]. The philosophy of concurrent economic and environmental sustainability, the recognition of the issue’s global nature, and the imperative to engage emerging talent are crucial [
20]. Collaborative efforts across a variety of sectors in large economic entities will yield significant economies of scale and experiential learning. This calls for comprehensive and coordinated transition strategies that span numerous economic sectors. In this study, a knowledge gap is filled by offering a novel technophilosophical method [
12] which provides a clear perspective on the challenges and requirements, thereby guiding these strategies.
A holistic and quantitative country-level replacement analysis of this kind has not been previously seen in public literature. In hopeful anticipation of the country finding a path to peace and prosperity, national and international data were used to estimate future energy demands and daily consumption patterns.
Through the details of the Libyan Oil Industry [
21,
22,
23,
24] and publications on the use of renewable energy [
25,
26,
27,
28] it was possible to estimate Libyan energy demand and consumption. With an analysis of age demographics [
27]and optimism about Libya’s future, a 2% growth rate was adopted. This rate considers optimistic assumptions, as actual growth has been inconsistent due to the country’s volatile political situation [
29]. As anticipated, there were gaps and inconsistencies in the data. Consequently, an integration process was undertaken, where judgment and experience were used to establish a 2020 baseline and a 2050 scenario. One of the main adjustments needed was reconciling the consumption patterns () with the total consumption as shown in ().
The consumption patterns were integrated to match the total in . Furthermore, the information obtained was presented in various units, so the consumption patterns and sector entries were all converted to PJ and GW for consistency and ease of manipulation. A future risk analysis will be conducted to examine the impact of these corrections and adjustments. It is expected that this more detailed analysis will slightly alter some quantitative outputs, but it is not anticipated to significantly change the magnitude of the results or the main conclusions.
. Decarbonised Libyan Energy Consumption for 2050 based on current energy need.
The 2050 decarbonisation analysis was conducted in two steps: assessing annual demand and adjusting the demand to the daily requirement based on current consumption patterns. The hypothesis of the study is to maximize the use of the length of the coastal strip, which extends to about 2000 km, considering the international regulations in force in the construction of ports. This is one of many possible greening alternatives and the objective here is to produce a view of the outcomes of this single scenario, not to offer it as the best solution. Column 1 of shows the 2020 baseline resulting from the compilation and integration exercise outlined above. The total requirement value calculated for Column 1 (809.47 PJ) does not include the last two items (Gas electricity and liquid fossil fuel for electricity) because these are already included in the fuel energy input (Gas for electricity and liquid fossil fuel for electricity). Column 2 shows an interim step for energy requirements in 2050 based on the consistent annual growth of 2% used for this investigation. This is the hydrocarbon-based demand to be decarbonised and the basis of the calculations for the subsequent columns. Items 5 and 6 have been removed on the premise that fossil fuels would not be used for electricity. The total of Column 2 now includes the electricity demand currently delivered by fossil fuels even though this would be produced using submersible power stations in the replacement scenario.
Columns 3, 4 and 5 display the replacement philosophy to retain the same level of benefit. For instance, the energy delivered by jet fuel would be replaced by electricity for short-range flights and hydrogen for medium and long-range flights. For aviation, the assumption is made that post-Covid, the civil aviation sector will need to convert to non-carbon fuels and will grow, given the vast cultural, economic, and social benefits it brings, particularly in business and tourism [
28] In 2050, the Libyan jet fuel requirement would be (The pressing need for decarbonisation is a global issue that will demand significant investments [
1,
4].
These investments are critical for preserving the considerable progress achieved in reducing worldwide poverty over the last century [
5]. As such, environmental conservation, sustained economic growth, and responsible use of natural resources must coexist. Major investors are already preparing for these shifts [
9,
10]. This philosophy of simultaneous economic and environmental sustainability, coupled with the need to globalise the issue and attract young talent, is of paramount importance [
20]. Collaborative measures across diverse sectors in large economies will yield crucial economies of scale and learning through experience. This calls for detailed and coordinated strategies for transitioning across various economic sectors. This study addresses a knowledge gap by introducing a new technophilosophical method [
12] providing a clear understanding of the challenges and necessities, thereby informing these strategies.
A comprehensive and quantitative country-level replacement analysis of this type has not been previously seen in public literature. Libya, a leading oil exporter and the home country of two of the authors has been selected for decarbonisation by 2050. Given its size and the planned replacement of hydrocarbon exports with green energy, Libya is a suitable candidate for decarbonisation, ensuring that the analysis is both useful and representative. The unpredictable political situation in the country posed difficulties in selecting a baseline for the study.
However, in hopeful anticipation of the country finding a path to peace and prosperity, national and international data were utilised to estimate future energy demands and daily consumption patterns [
14,
16,
17,
18,
19]. Using this information, along with details about the Libyan Oil Industry [
23,
24] and publications regarding the use of renewable energy sources [
26,
27,
28], an estimate of Libyan energy demand and consumption was generated.
With an exploration of age demographics [
27] and an optimistic outlook on Libya’s future, a 2% growth rate was adopted. This rate incorporates hopeful assumptions, as actual growth has been inconsistent due to the country’s volatile political reality [
29]. As expected, there were gaps and inconsistencies in the data. Consequently, an integration process was undertaken, where judgment and experience were applied to establish a 2020 baseline and a 2050 scenario. One of the main adjustments needed was reconciling the consumption patterns () with the total consumption (). The consumption patterns were integrated to match the total in .
Furthermore, the information obtained was presented in various units, so the consumption patterns and sector entries were all converted to PJ and GW for consistency and ease of manipulation. A future risk analysis will be conducted to examine the impact of these corrections and adjustments. It is expected that this more detailed analysis will slightly alter some quantitative outputs, but it is not anticipated to significantly change the magnitude of the results or the main conclusions.
The 2050 decarbonisation analysis was conducted in two steps: assessing annual demand and adjusting the demand to the daily requirement based on current consumption patterns. The premise of the study is to install submersible power stations that are utilized with a capacity that produces 1GW for each plant. This is one of many possible greening alternatives and the objective here is to produce a view of the outcomes of this single scenario, not to offer it as the best solution. Column 1 of shows the 2020 baseline resulting from the compilation and integration exercise outlined above. The total requirement value calculated for Column 1 (809.47 PJ) does not include the last two items (Gas electricity and liquid fossil fuel for electricity) because these are already included in the fuel energy input (Gas for electricity and liquid fossil fuel for electricity). Column 2 shows an interim step for energy requirements in 2050 based on the consistent annual growth of 2% used for this investigation. This is the hydrocarbon-based demand to be decarbonised and the basis of the calculations for the subsequent columns. Items 5 and 6 have been removed on the premise that fossil fuels would not be used for electricity.
The total of Column 2 now includes the electricity demand currently delivered by fossil fuels even though this would be produced using submersible power stations in the replacement scenario. Columns 3, 4 and 5 display the replacement philosophy to retain the same level of benefit. For instance, the energy delivered by jet fuel would be replaced by electricity for short-range flights and hydrogen for medium and long-range flights. For aviation, the assumption is made that post-Covid, the civil aviation sector will need to convert to non-carbon fuels and will grow, given the vast cultural, economic, and social benefits it provides, particularly in business and tourism [
30].
By 2050, the Libyan jet fuel requirement would amount to 44.3 PJ of fuel energy (Item 3, column 2). Based on the evaluation in [
31] relying on [
32] of the aviation jet fuel energy requirement would be delivered by electric propulsion and the remaining 85% by hydrogen gas turbine propulsion systems. These replacement factors are shown in Item 3 Col 3 as 0.15 and 0.85. As such, 15% of this would be replaced by electricity and the remaining 85% by hydrogen (columns 3 and 4). To deliver the same benefit, the amounts of energy required would change. 15% of the 2050 jet fuel energy requirement is 6.6 PJ. If the same propulsive power were to be delivered by electricity, the energy requirement would be much smaller. Conversion from fuel energy to propulsive power is relatively low due to the need to use a thermodynamic cycle (the gas turbine) to convert the heat input of the fuel into propulsive power.
In the present analysis, a levelized average value of 30% is used for the thermal efficiency of the gas turbines used for smaller airliners. If electrical power is used, the conversion from electrical power at the source, allowing for larger weight, transmission losses, and electrical equipment losses were estimated at 70%. Hence the electrical power needed to deliver the same propulsive power as 6.6 PJ of fuel energy (Item 3, Col 4) is much lower: 2.85 PJ (Item 3, Column 6). On the other hand, the amount of energy delivered by hydrogen would increase. Based on the evaluation in [
31], airliners of the first innovation wave would have more voluminous bodies, resulting in higher drag.
Thus, the hydrogen energy needed would be larger, in this analysis by 10%. So, to replace the propulsive power obtained from 37.7 PJ of conventional fuel for 2050 (Item 3, Col 4), 41.45 PJ of hydrogen would be needed (Item 3, Column 8). This hydrogen, in the present analysis, is produced using seawater electrolysis and needs to be liquefied with a combined efficiency of electrolysis and liquefaction, estimated here, of 55%. So, the production of 41.45 PJ of hydrogen, 345.4 kilotons per annum (Item 3, Column 9), would require 75.36 PJ (Item 3, Column 7). Therefore, to provide the 2050 propulsive power requirement for aviation, 44.33 PJ of conventional fuel energy would be needed. In a decarbonised scenario, the same requirement would be delivered by 2.850 PJ of electrical energy generation and 41.45 PJ of hydrogen. This hydrogen, in turn, would require 75.36 PJ of electrical energy to be generated.
. Demand curves for 2050 used in the study.
Similar assessments were performed across the list of items, facilitating the calculation of the electrical and hydrogen requirements. The hydrogen requirements, in turn, led to their respective electrical requirements (column 7). It was assumed that aviation would exclusively require liquid hydrogen, while all other sectors would utilise hydrogen gas. Decker states that the global liquid production of hydrogen is slightly more than 100 ketones p.a., which is about 0.15% of global hydrogen production, making this approximation reasonably precise for the current analysis [
33]. (col 10) shows that 28.5 percent of the produced hydrogen is liquid hydrogen for aviation. This proportion will remain constant throughout the study, and the global efficiency of hydrogen production will be maintained at 0.65 due to the proportion of the produced hydrogen being liquid.
Therefore, for a decarbonised Libya of 2050 (), without restricting economic growth, the total energy required would be 630 PJ of electrical energy, of which 407 PJ would be used directly as electrical energy and the remainder used to produce hydrogen. It is noteworthy that the decarbonisation of a country has resulted in a reduction (from 809 PJ to 630 PJ) of primary energy and a sizeable increase (from 108 PJ to 630 PJ) in electrical energy requirement. The main reason for the reduction in primary energy is that a large portion of fossil fuel energy is currently used in thermodynamic cycles with thermal efficiencies ranging from 0.15 to 0.6, which often leads to substantial waste of thermal energy. This may change in the future as additional hydrogen production requirements are included.
In the initial column of , the depicted data represents the demand for electrical energy, as illustrated in . Subsequently, the second column in the table indicates the corresponding energy required to fulfil this demand.
. Analysis for the Winter season.
3. Adjustments for Daily Demand Considerations
When transitioning from traditional fossil fuel energy sources to submersible power stations, it is crucial to ensure demand is met. By 2050, machinery with an efficiency exceeding 65% is expected to be available. Combined with electrolyser efficiencies surpassing 70%, this can deliver efficiencies from electricity to electricity of 0.45 to 0.5. Moreover, HeCCGTs Helium Closed cycle gas turbine generates a substantial stream of thermal energy, which can be beneficially used in various areas, including desalination [
34]. This advantage is not included in this analysis. It is anticipated that these HeCCGTs will be situated near the electrolysing stations. In this study, the HeCCGTs are assumed to be 1000 MW Helium Closed cycle gas turbine units (accounting Considering the change in water temperature in different seasons, off-design performance, and degradation) with a thermal efficiency of 60%. Thus, in addition to the hydrogen produced for the replacement scenario depicted in , additional hydrogen will need to be generated for use for (self-sufficiency and export).
presents the demand curves for this study. The patterns used are based on Libyan operating information [
11,
14] and have been adjusted to meet the total annual requirement of 406.89 PJ for 2050, as evaluated in section 3 and shown in . Altogether, the grid evaluated here needs to deliver:
- The electricity demand of 406.89 PJ in the daily patterns is shown in .
- The 1210.7 ketones of hydrogen (3.32 k tonnes/day, liquid & gas), require 223.7 PJ annually.
4. Assessment of Requirements Based on the Summer Season
The basic premise of this investigation is that ports including submersible power stations will be constructed and operated at full capacity, considering the location. Libya located in the Mediterranean Sea, which extends for about 2000 km, was selected for this purpose to build the ports on it. The demand patterns represented in were used, representing the year as four equal seasons of 91.25 days each. The first step was to take the maximum energy demand value as a reference standard to calculate the number of turbines of helium closed-cycle gas turbines required to meet the total electricity demand.
These ports were identified as being located along Libya’s territorial waters. To meet the electrical needs of this region, the study estimated the need for 27 generating stations with a capacity of 1 gigawatt, as shown in , the number of power generation stations required.
. Electrical Supply and demand on a winter day. H2.
The next phase of this evaluation focuses on submersible power stations that utilize a helium closed-cycle gas turbine. These power stations are designed for continuous energy production and rely on variations in seawater temperature throughout the day and seasons as represented in . Column 3 in our data displays the performance of these submersible power stations for each hour of the day. To ensure the feasibility of the submersible power plant project, it needs to accomplish several crucial tasks. First, must attain high cycle thermal efficiencies. Additionally, must determine the appropriate sizes for all the machinery components, including the reactor and turbomachinery, and consider their respective weights. Furthermore, it needs to integrate high-speed propulsion systems effectively. Another important aspect of the analysis is comparing the thermodynamic properties of helium turbomachinery in the gas flow path to those of air-breathing gas turbines. This comparison will help to understand the impact of using helium and its implications. Also, a feasibility analysis to assess whether the installation of the turbomachinery can provide the required power output [
33,
34,
35,
36,
37].
When compare helium-working turbomachinery to air-working gas turbines, one significant difference arises. Helium, owing to its low molecular weight, would necessitate a greater number of compression and expansion stages for a given pressure ratio. This can be clearly illustrated by looking at the specific heat of helium compared to air; helium has approximately five times the specific heat of air. Since the temperature rise per stage is inversely related to the specific heat and directly linked to the pressure rise per stage, it becomes evident that helium would require more stages to achieve the same pressure ratio [
38]. Although helium offers distinct advantages over other working fluids in thermodynamic cycles, its low molecular weight does lead to an increased number of stages in turbomachinery. However, it is worth noting that this drawback is partially offset by the potential for higher peripheral speeds that can be attained [
39].
The investigation involved conducting an extensive analysis of pressures and temperatures at various phases within the cycle. This systematic examination was performed to outline the critical factors that guide the selection of the most suitable thermodynamic cycle. Emphasizing the importance of these findings, the results presented here were obtained through the application of precise and specialized thermodynamic equations.
. Helium closed cycle gas turbine Power output vs. sea water temperature.
In the planning of the future
helium gas turbine plant, specific design parameters were established for the turbine inlet conditions, with a temperature of 850 °C (1562 °F) and a pressure of 6.0 MPa (870 psia). However, achieving this specified temperature proved unattainable in the Oberhausen II plant. Consequently, a temperature of 750 °C (1382 °F) was chosen, considering the stress considerations of the tube material in the external coke-oven gas-fired heater.
To address this change, a closed-cycle system was adopted, incorporating intercooling and recuperation. The essential characteristics of the plant are outlined in .
. Salient features of operated helium turbomachinery [
40].
The isometric sketch of the distributed power conversion system [
40], serves as a convenient tool for illustrating the plant layout [
41]. A decision was made, as documented in [
42], to have the horizontal turbomachinery installed within three substantial steel vessels. These groupings were organized as follows: (1) the LP compressor rotor, (2) the combination of the HP compressor and HP turbine, and (3) the LP turbine. The first two assemblies were combined onto a single shaft, with a rotational speed of 5500 rpm. The generator, having a rotational speed of 3000 rpm, is driven from the LP turbine end. The rotors were interconnected via gears, although the selected shaft arrangement resulted in only a minimal amount of power being transmitted through the gearbox. This configuration was established to ensure that the dynamic behaviour matched that of the large single-shaft reference helium gas turbine plant design concept [
3].
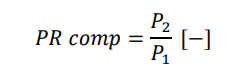
This equation illustrates the relationship between the pressure ratio across a compressor in a thermodynamic system.
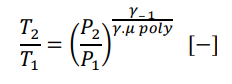
The temperature ratio, denoted as $$\frac{T_2}{T_1}$$, is expressed in terms of the pressure ratio:
This equation establishes a connection between the temperature ratio across the compressor and the pressure ratio. Here, γ represents the heat capacity ratio and poly μ poly stands for the polytropic efficiency.
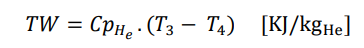
This equation evaluates the amount of work performed by the compressor, where represents the specific heat at constant pressure for helium.
The turbine’s work output in the system is represented by this equation.
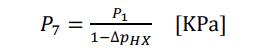
This equation evaluates the pressure following a heat exchanger while considering a decrease in pressure within the heat exchanger.
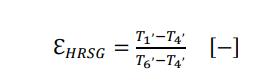
It defines the efficacy of a heat recovery steam generator, indicating its ability to efficiently recover heat.
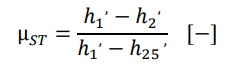
This equation articulates the efficacy of a steam turbine in converting thermal energy into mechanical work.
The work required to pump water is calculated by this equation, which involves specific volume (v) and changes in pressure.
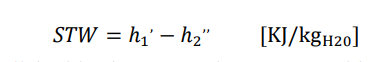
The specific total work accomplished in the system is represented by this equation, which encompasses changes in enthalpy.
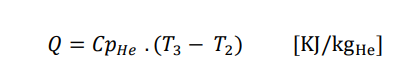
This equation determines the heat input to the system, where the specific heat at constant pressure for helium is represented by Equation (10).
Understanding how the system performs in different seasons depends on the balance between overall pressure ratio (OPR) and thermal efficiency (Etath). When OPR increases as it represented in , so does Useful Work, emphasizing the significant role of total pressure ratio in influencing efficiency and power production. Studying these trends helps find the optimal settings for a good balance between efficiency and specific power output.
. Overall Pressure Ratio vs. thermal efficiency & Specific Power.
5. Helium: A Pioneering Coolant for Advanced Power Plants
Helium is distinguished as a unique coolant option for prospective helium power plants, owing to its distinct thermodynamic and chemical properties. Firstly, the atomic structure of helium prevents the transportation of radioactivity, negating the requirement for a double-loop configuration to confine radioactive ions within the reactor. With appropriate filtration and cooling systems, shielding becomes necessary only for the reactor itself, achieved through a pressurized vessel and concrete shield.
Helium functions within a closed Brayton cycle, preventing the fouling of turbomachinery and heat exchangers, a common occurrence in open-cycle gas turbines. This feature also facilitates operation at higher minimum pressure levels and, consequently, lower overall pressure ratios, resulting in smaller turbomachinery with fewer stages [
3].
When helium turbomachinery is designed, there is a notable reduction in the drop of polytropic efficiency caused by the Reynolds number effect. The higher velocity of sound in helium proves to be advantageous in the design of turbomachinery, enabling higher peripheral speeds to be attained before encountering Mach effects. While a greater number of turbomachinery stages may be required due to helium’s low molecular weight, the ability to achieve higher peripheral speeds partially counterbalances the negative impact of this lower molecular weight [
39].
In the exploration of Generation IV reactor power plants, research has been conducted on the cooling of turbines in high-temperature helium gas cycles, which has revealed potential advantages. By implementing superior materials for turbine blades and optimizing the cooling fractions, it becomes possible to achieve turbine entry temperatures (TETs) as high as 1200 °C [
2]. This results in a significant improvement in the efficiency of the cycle. The elevation of TET to 1200 °C demonstrates a noteworthy decrease in the levelized unit electricity cost (LUEC), with reductions of 22.7% for the simple cycle recuperated and 19.8% for the intercooled cycle recuperated. When determining the configuration of the cycle for gas-cooled fast reactors (GFRs) and very high-temperature reactors (VHTRs), critical considerations include the selection of components, the arrangement of the system, and the choice of coolant. Numerous investigations have been conducted on the impact of the inlet temperature of the cycle on both the pre-cooler and the overall efficiency of Simple and Intercooled Helium Gas Turbine Cycles for Generation IV Nuclear Power Plants [
43]. The temperature at which the coolant enters the system is identified as a significant factor that affects both the dissipation of heat and the efficiency of the cycle. It is worth noting that different configurations of the pre-cooler, such as co-current and counter-current setups, lead to distinctive outlet temperatures for the heat sink and affect its compactness [
44,
45]. The selection of the operational fluid in this cycle carries substantial importance in determining the pressures, temperatures, and overall efficiency of the power plant. The thermodynamic and thermal characteristics of the fluids hold significant relevance in establishing the outcomes of performance [
44,
46]. The selection of the working medium in inventory control systems for nuclear-powered closed-cycle gas turbines has a notable influence on the design and performance attributes. Helium, when utilized as a working medium, provides benefits in relation to cycle effectiveness and facilitates the creation of condensed inventory tanks. Nonetheless, it incurs greater long-term operational expenses in comparison to alternative mediums [
47]. Several technical studies have investigated the implementation of inventory control requirements for a nuclear-powered closed-cycle gas turbine power plant. These investigations have focused on factors such as the influence of the initial inventory tank pressure on control levels, the potential advantages of using multiple tanks to increase the overall size of the inventory control tank, and the application of insulation to mitigate temperature fluctuations [
48].
Column 2 displays the electricity demand for each hour in gigawatts (GW), reflecting the amount of power needed by consumers at that specific hour. In Column 3, it can see the gigawatts (GW) of electrical power generated by
a helium cycle gas turbine during each hour. Column 5 represents the energy balance, which is calculated by subtracting the energy demand from the energy supply for each hour. This helps us determine whether there is an excess or deficit of energy during that time.
Column 7, titled “Electrical Power for H2 - GW,” reveals the amount of electrical power dedicated to hydrogen (H
2) production. Column 8 showcases the energy output from hydrogen (H
2) fuel cells for fuel cell vehicles (FCVs) in terajoules (TJ). Column 9, labelled “Tonnes H
2 Produced,” provides information on the quantity of hydrogen (H
2) produced in tonnes for each hour. Column 10, “Tonnes H
2 in Storage,” indicates the cumulative amount of hydrogen (H
2) stored over the course of time. The “Total” row at the bottom presents aggregated values for specific columns, such as total power demand, total energy generated by the
helium cycle gas turbine, and the overall supply-demand balance.
One of the constraints of the evaluation is the hydrogen production of 3699 tonnes/day explained above. The bottom row shows that for a winter day, 57.92 ketones of hydrogen, and the remainder is the 3693 tonnes/day requirement. Column 7 offers a view to estimating the electrolysis capacity and Column 10 offers information helpful for storage requirements. A particular assumption in this study is that the 3693 tonnes of hydrogen needed every day is consumed very quickly. shows the electrical supply and demand patterns. The blue line is the demand. This demand is met by a helium closed-cycle gas turbine. The very large excess of supply over demand is used to electrolyse hydrogen for use in other economic sectors and to produce the hydrogen for sufficiency and export, as shown in the Analysis in ,5 below.
. Analysis for the spring season.
. Analysis for the Summer season.
6. Summer, Spring and Autumn Seasons
This was followed by evaluation of other seasons. In these, the closed cycle helium gas turbine was supposed to continue delivering its maximum output, which is now greater because the power output depends on the seawater temperature which was generally higher in the other three seasons compared to the summer season.
As for the sites that were chosen, most of them were in the Mediterranean Sea in the north of the country, as it is overlook a sea line 2000 kilometres long, which allows the establishment of many ports in accordance with international specifications and policies [
49]. shows details of the spring semester. This season is characterized by lower demand () (this is evident when comparing columns 3 in and ). There is a surplus in hydrogen production that can be exported at 53.33 thousand tons/day. Like a daily necessity, they are meant to be removed from storage. and show the results of the other. (a) and (b) explore the relationship between electricity supply and energy demand throughout the year for self-sufficiency and export.
. (a) & (b) Electrical Supply and power demand for the year Self Sufficiency and Export.
7. A View of the Whole National System
An examination of the above information reveals a great deal of useful detail to provide foundation knowledge for, among other things, policymaking, and national investments The installed nominal output needed is 27 GW, delivering less because of the maintenance factors. The electrolyser requirement is determined by the maximum that takes place in the spring at 2:00 (column 8, ) which is 23.77 GW.
In addition, provisions have been implemented to ensure there is an emergency backup to store hydrogen in preparation for potential emergencies. These measures are intended to ensure sufficient supplies for two days of use, to serve as a precautionary approach to address unforeseen circumstances and to maintain a reliable reserve of hydrogen during critical situations. Current electricity capacity in Libya is 11 GW [
50,
51] and the transmission grid is of a commensurate size.
The significant increase in electricity capacity needed to achieve the decarbonization target is due in part to replacing fossil fuel road transportation with electric systems and in part to replacing high-use fossil fuel power plants with non-carbon systems such as helium closed cycle gas turbine (submersible power plants).
It is beneficial to locate the hydrogen grid very close to the coast on the premise that seawater will be used for electrolysis. An evaluation is needed to select between direct seawater electrolysis or to desalinate seawater and electrolyse it subsequently [
49,
52]. The use of seawater to produce hydrogen is a necessity given the scarcity (or geographical maldistribution) of fresh water in many parts of the world. The location of electrolysers and storage farms can be placed near the coast to minimise hydrogen transmission inland. So, in this scenario, the electrical grid and hydrogen grid would be distributed throughout the country would be concentrated near the Mediterranean coast. shows the results for autumn season as described for the winter, spring, and summer seasons.
shows a summary of these requirements with the electrolyser requirement adjusted by an availability factor of 0.95 and the storage and transmission requirements adjusted by an availability factor of 0.9.
. Analysis for the autumn season.
. National requirements – two scenarios: meeting demands and using helium closed cycle gas turbines and exporting yearly 2100 PJ of hydrogen for continuous-duty helium closed cycle gas turbines.
The author proposes it is logical to group the hydrogen infrastructure in hydrogen farms by the Mediterranean coast to capitalise on economies of scale and integration; also reducing hydrogen transmission costs. These hydrogen farms could be located close to the main cities, Tripoli, and Benghazi where an important fraction of the demand is located. These cities also have the largest airports in the country where most of the liquid hydrogen will be used, noting that hydrogen for aviation will comprise 28% of the hydrogen demand (). These hydrogen farms would comprise the electrolysers, if adopted the desalination plant, the storage facilities, and where appropriate the liquefaction plant. Reviewing electrolyser and associated technologies [
53,
54,
55,
56]. The authors concluded that two hydrogen farms of approximately 270 km2 each would meet the requirements of the demand and the Helium closed cycle gas turbine produced. shows the proposed location of the hydrogen farms and Helium closed-cycle gas turbine [
55,
57].
In the scenario evaluated here, the hypothesis is that this green hydrogen-electric grid meets the country’s winter requirements as it has the highest value of energy demand, Therefore, for the rest of the year, the author suggests using the winter season as a bench point for the rest of the seasons. The excess capacity over consumer needs that occurs in the four seasons provides excess electrical energy that is used to produce hydrogen for export. The excess hydrogen produced daily is shown in column 8 at the bottom of the table for each season. The values are 575, 5848, 4511, and 4960 tonnes for winter, spring, summer, and autumn. This delivers a total of 1.054 Megatons of Hydrogen each year, which equates to 128 PJ each year, exported in four seasons for scenario Self-sufficiency.
North Africa is seen to have great potential for energy exports. green and conventional. In 2021 Libya used exported slightly over 1 million barrels/day of crude oil [
58] this is approximately 49 Megatons of oil each year with an energy content of 2100 PJ per year. A reasonable ambition would be to retain Libya’s international position as an energy exporter. Then a similar analysis can be carried out using this method for a scenario where Libya is exporting 2100 PJ of Hydrogen each year. This could be exported by tankers [
59] or by pipeline. The corresponding results for this energy export scenario are shown in the lower row of . This type of analysis could be used for different levels of export to deliver the appropriate quantitative results.
The Helium closed cycle gas turbine power unit proposed here is somewhat higher, at 1 GW. It is indicated that the installed capacity is 27 gigawatts and the. This is the result of estimates and margins arising from weather and operating factors referred to in Section 5.
Furthermore, the grid transmission capacity is needed to minimize the impact of curtailment [
60,
61]. Curtailment may be needed for maintenance, excess power over demand, and lack of transmission lines [
62]. Additionally, in this investigation, very few instances of excess power over demand are expected given that the basis of the generation system presented here relies on ample excess power to produce hydrogen for internal use and export.
One more detail to highlight is that the total Helium closed cycle gas turbine electricity generated is much larger than the 630 PJ (407 PJ of electrical demand plus 223 PJ for hydrogen) required to satisfy the national demand. This is because of the need to produce additional Hydrogen for the exports.
8. A Foundation Baseline for Future Policy and R&D Investments
The present study has the appropriate accuracy for setting national and international research, development, and financial agendas. It offers valuable insights in a single electricity generation solution and single energy storage approach and helium closed cycle gas turbine power with their necessary ancillary systems. It also provides a quantitative platform for evaluation of alternatives. This is a very useful baseline for cascading and evaluation of alternatives and R&D requirements necessary for the decarbonisation agenda of a country. There are uncertainties and alternatives, described below, that will require further analysis. These evaluations will yield refinements but will not alter the main conclusions. For example, a key R&D issue that arises is how to produce hydrogen. Here seawater is advocated as the feedstock, to protect scarce freshwater supplies, currently an issue in many parts of the world. Advances are taking place in seawater electrolysis. Another alternative is to produce hydrogen in two steps, first desalination, followed by electrolysis of the resulting water stream.
A techno-economic analysis of the options is needed to make an appropriate selection. Solutions are likely to vary, dependent on the features of different geographic locations and it is likely that depending on circumstances, a portfolio approach will be needed. Within this context, there is also a choice to be made of the right electrolyser from the options available. In the current research, the demand patterns were maintained as constant. Demand management emerges as a viable strategy that could potentially offer cost advantages by shifting peak consumption times to align more closely with energy production, therefore diminishing the need for equipment. A managed decrease in demand is also a feasible approach. For instance, the UK has noticed a 25% decline in electricity demand from 2003 to 2022 [
63].
Every oil exporting country has a social duty to consider its wealth generation abilities once the oil demand dwindles because of environmental requirements and policies. Libya currently exports about 80% of the oil it produces to Europe [
64]. It is logical to expect that these energy exports will continue to be beneficial. Europe is a large energy consumer and is on a clear road to decarbonisation. So, there will be a clear demand for Libya’s energy exports as these become greener. The question then arises. Should Libya export liquid hydrogen by ship or gaseous hydrogen by pipeline or electricity to Europe? In the present study, the export of hydrogen is assumed to be gas. However, the likely solution is a mixture of the three. The importance of each of the three opportunities can be made visible following a detailed TERA evaluation of the costs, risks and benefits of the exporting technologies and markets.
shows the proposed distribution for establishing ports that helium cycle gas turbines in the sea on the northern Libyan coast.
. Location of facilities in Libya courtesy mapsoftheworld.com, annotated by the authors.
Worldwide, there has been a significant surge in Renewable energy capacity over the past ten years, with a yearly average increase of 22%. By the end of 2015, this figure had reached a staggering 432 GW. Most of this capacity - around 73% - was contributed by just five countries: China, the United States, Germany, India, and Spain [
65]. Given the scale of investment envisaged and the influence of global geographic opportunities, this is an exercise that will require extensive and bespoke. Often different geographic areas will require different solutions and a portfolio approach could be the outcome. TERA evaluations [
30,
66].
Significant cost benefits can be realized. Expected improvements in these areas will come from accumulated experience, volume, and technology acquisition.
The design of hydrogen systems in large helium closed cycle gas turbines or parks is another area receiving and will continue to receive considerable focus. Consolidating hydrogen systems within helium closed cycle gas turbine or parks will offer economies of scale and experience, resulting in reduced hydrogen transmission, health and safety investments, operational scale, and cost benefits from experience acquisition. Unit costs of hydrogen tanks become more economical as capacity increases.
Another crucial aspect that warrants further exploration is the source of electricity [
67]. The choice of helium closed cycle gas turbine is highly rational in the case of Libya, given its substantial coastal sea resources. However, the capacity requirements for both generation and storage within the system are substantial. Other energy sources will be evaluated [
68].
In addition to helium closed cycle gas turbine, Libya could potentially harness wave energy due to its extensive coastline, and other opportunities that necessitate a detailed Techno-Economic Resource Assessment (TERA).
Realistic assumptions were made regarding the redundancy needed, availability, and other capacity-constraining factors for several inputs. Similarly, ample opportunities exist to explore in terms of techno-economic performance. As such, this study serves as a foundation for a more detailed techno-economic optimization that examines the opportunities and options outlined above. It also enables the beginning of cost estimation for the highly expensive transition towards a decarbonized economy.
9. Conclusions
In the current research, a knowledge gap is bridged by introducing a unique, quantitative ethnophilosophical method. This method provides a statistical perspective on energy requirements and economic growth to inform decarbonization strategies. No such comprehensive and quantitative country-level replacement analysis has been found in the public domain before. Therefore, the contribution lies in the quantitative visualization of infrastructure requirements, derived from the evaluation of two scenarios: energy self-sufficiency and matching current oil exports.
The foundational study is presented as a demonstrative example, without making judgments, recommendations, or optimizations. However, several pertinent conclusions surface. The first, despite numerous uncertainties and a singular solution examination, is that the cost and infrastructure requirements will be enormous. A cost estimate will be conducted shortly, but even before that, Table 7 illustrates the tremendous equipment needs; these will come with a high price tag. Even though the current investigation is based on singular choices, these are competitive, validating the order of magnitude of the requirement.
While the study was conducted with a focus on Libya - a country with a long marine coastline that allows it to construct many submersible power plants - the principles, findings and implications have global applicability. The substantial increase in electricity capacity required for decarbonization is partly due to the replacement of transport fossil fuels with electric and hydrogen systems, and partly due to the replacement of high-utilization fossil fuel electricity-generating plant with utilization decarbonised systems.
The concept of the hydrogen farm warrants detailed future scrutiny. It holds the promise of reducing costs, even though the order of magnitude of the overall decarbonizing investment isn’t expected to change significantly. Careful integration of different elements will also yield savings. Moreover, the strict Health and Safety measures necessary for hydrogen operations will be confined to a small number of specific areas, namely the locations of hydrogen farms within a country. A comprehensive Techno-Economic Resource Assessment (TERA) represents the next stage in this research.
The process of transitioning to more sustainable practices will necessitate a large-scale increase in electrification. This foundational analysis can serve as a starting point for research and development, investment planning, and policymaking at the beginning of the road to decarbonization.
Acknowledgments
We would like to express our gratitude for the invaluable support that went beyond the scope of author contributions and funding. Special thanks are extended to those who provided administrative and technical assistance. Your contributions have played a pivotal role in the success of this research. Also, I express my sincere gratitude to the Libyan embassy for generously supporting my PhD.
Ethics Statement
Not applicable.
Informed Consent Statement
Not applicable.
Funding
We wish to clarify that this research received no external funding. The entirety of the project was carried out without financial support from external entities.
Declaration of Competing Interest
The authors declare that they have no known competing financial interests or personal relationships that could have appeared to influence the work reported in this paper. We affirm that the research and its outcomes were conducted with impartiality and without any potential conflicts of interest.
Nomenclature
FCV – Fuel Calorific Value
GJ/T – Gigajoules/tonne
H2 – Hydrogen
HeCCGT – Helium closed cycle gas turbine.
kTonne – kilotonne = 1000 tonnes
MT – mega tonnes (million tonnes)
MTOE – Million tonne oil equivalent
NOx – Nitrogen Oxides
PJ – Petajoules = 1015 Joules
R&D – Research and Development
TERA – Technoeconomic Environmental Risk Analysis
TJ – Terajoule = 1012 Joule
References
1.
Dray L, Schäfer AW, Grobler C, Falter C, Allroggen F, Stettler ME, et al. Cost and emissions pathways towards net-zero climate impacts in aviation.
Nat. Clim. Chang. 2022,
12, 956–962.
[Google Scholar]
2.
Gad-Briggs A, Nikolaidis T, Pilidis P. Analyses of the effect of cycle inlet temperature on the precooler and plant efficiency of the simple and intercooled helium gas turbine cycles for generation IV nuclear power plants.
Appl. Sci. 2017,
7, 319.
[Google Scholar]
3.
Serna, J. Submersible Nuclear Power Station. Master’s Thesis. Cranfield University, Bedfordshire, UK, 2020.
5.
Goerwitz RL III. Review of Factfulness: Ten Reasons We’re Wrong About the World—and Why Things Are Better Than You Think, by Hans Rosling, Anna Rosling Rönnlund, and Ola Rosling.
Numeracy 2019,
11, 19.
[Google Scholar]
6.
Ettore F, Bompard D, Grosso D, Huang T, Profumo F, Lei X, et al. World decarbonization through global electricity interconnections.
Energies 2018,
11, 1746.
[Google Scholar]
7.
Guo F, Van Ruijven B, Zakeri B, Krey V, Riahi, K. Global Energy Interconnection: A scenario analysis based on the MESSAGEix-GLOBIOM Model, 2021. Available online:
www.iiasa.ac.at (accessed on 02 November 2023).
8.
Mazza A, Francesco E, Bompard E, Chicco, G. Applications of power to gas technologies in emerging electrical systems.
Renew. Sustain. Energy Rev. 2018,
92, 794–806.
[Google Scholar]
9.
Eirdosh D, Hanisch, S. Evolving schools in a post-pandemic context. In COVID-19: Paving the Way for a More Sustainable World; Springer: Berlin/Heidelberg, Germany, 2021, pp. 465–480.
14.
Rawesat Y, Salah S. Energy Demands and Daily Consumption Patterns in Libya. Private Communication, 2021.
20.
Parker RJ, Pilidis P. The light beyond the clouds.
Aeronaut. J. 2021,
125, 1467–1468.
[Google Scholar]
26.
Reksten AH, Thomassen MS, Møller-Holst S, Sundseth K. Projecting the future cost of PEM and alkaline water electrolysers: a CAPEX model including electrolyser plant size and technology development.
Int. J. Hydrog. Energy 2022,
47, 38106–38113.
[Google Scholar]
28.
Almaktar M, Shaaban M. Prospects of renewable energy as a non-rivalry energy alternative in Libya.
Renew. Sustain. Energy Rev. 2021,
143, 110852.
[Google Scholar]
30.
Brouwer KM, Bergkamp L. Road to EU Climate Neutrality by 2050: Spatial Requirements of Wind/solar and Nuclear Energy and Their Respective Costs; Renew Europe and ECR Group: Brussels, Belgium, 2021.
31.
Huete J, Nalianda D, Pilidis P. Propulsion system integration for a first-generation hydrogen civil airliner?
Aeronaut. J. 2021,
125, 1654–1665.
[Google Scholar]
32.
Schäfer AW, Barrett SR, Doyme K, Dray LM, Gnadt AR, Self R, et al. Technological, economic, and environmental prospects of all-electric aircraft.
Nat. Energy 2016,
4, 160–166.
[Google Scholar]
34.
REFHYNE. “REFHYNE Project.” Available online:
https://refhyne.eu (accessed on 13 December 2022).
38.
McDonald CF, Orlando RJ, Cotzas GM. Helium Turbomachine Design for GT-MHR Power Plant; No. GA-A--21720; General Atomics, San Diego, CA, USA, 1994.
39.
Phillips KE. Helium Gas Turbines for Nuclear Power; US Naval Postgraduate School: Monterey, CA, USA, 1956.
40.
McDonald CF. Helium turbomachinery operating experience from gas turbine power plants and test facilities.
Appl. Therm. Eng. 2012,
44, 108–142.
[Google Scholar]
42.
Zenker P. The Oberhausen 50 MW Helium Turbine Plant. Combustion 1976, 47.
43.
Gad-Briggs A, Pilidis P, Nikolaidis T. Analyses of long-term off-design performance strategy and operation of a high-pressure ratio intercooled brayton helium gas turbine cycle for generation IV nuclear power plants.
J. Nuclear Eng. Radiat. Sci. 2018,
4, 041014.
[Google Scholar]
44.
Gad-Briggs A, Pilidis P, Nikolaidis T. A Review of Brayton Helium Gas Turbine Cycles for GFR and VHTR Generation IV Nuclear Power Plants. In Proceedings of the 26th International Conference on Nuclear Engineering, London, UK, 22–26 July 2018.
45.
Gad-Briggs A, Pilidis P, Nikolaidis T. A review of the turbine cooling fraction for very high turbine entry temperature helium gas turbine cycles for generation IV reactor power plants.
J. Nuclear Eng. Radiat. Sci. 2017,
3, 021007.
[Google Scholar]
46.
Osigwe EO, Gad-Briggs A, Nikolaidis T, Pilidis P, Sampath S. Performance analyses and evaluation of CO
2 and N
2 as coolants in a recuperated Brayton gas turbine cycle for a generation IV nuclear reactor power plant.
J. Nuclear Eng. Radiat. Sci. 2020,
6, 021102.
[Google Scholar]
47.
Osigwe EO, Gad-Briggs A, Pilidis P, Nikolaidis T, Sampath S. Inventory control systems for nuclear powered closed-cycle gas turbine: technical studies on effect of working fluid options. In Proceedings of the 27th International Conference on Nuclear Engineering, Tsukuba, Japan, 19–24 May 2019.
48.
Osigwe EO, Gad-Briggs A, Obhuo M, Pilidis P. Techno-economic study on the implementation of inventory control requirements for a nuclear-powered closed-cycle gas turbine power plant.
J. Nuclear Eng. Radiat. Sci. 2021,
7, 31301.
[Google Scholar]
55.
Mohammed-Ibrahim J, Moussab H. Recent advances in hydrogen production through seawater electrolysis.
Mater. Sci. Energy Technol. 2020,
3, 780–807.
[Google Scholar]
57.
Herzog B. Möglichkeiten von Wasserstoff-Elektrolyseuren in Flexibilitätsmärkten; Technical Report; Siemens AG: Munich, Germany, 2017.
59.
Alkhaledi A, Sampath S, Pilidis P. A hydrogenfueled LH2 tanker ship design.
Ships Offshore Struct. 2022,
17, 1555–1564.
[Google Scholar]
60.
Ali A. Proposed Design of Distribution Network Considering Sensor Measurement Strategy on Active Network Management: A Case Study. Master’s Thesis, Renewable Energy systems and the Environment, Strathclyde University, Glasgow, UK, 2022.
62.
Vargas LS, Bustos-Turu G, Larrain F. Wind Power Curtailment and Energy Storage in Transmission Congestion Management Considering Power Plants Ramp Rates.
IEEE Trans. Power Syst. 2015,
30, 2498–2506.
[Google Scholar]
66.
Karumbaiah N. Impact of Environmental Taxation Policies on Civil Aviation - A Techno-economic Environmental Risk Assessment. PhD Thesis, Cranfield University, Bedfordshire, UK. 2012.
67.
BadiN I, Pamučar D, Stević Ž, Muhammad LJ. Wind farm site selection using BWM-AHP-MARCOS method: A case study of Libya.
Sci. Afr. 2023,
19, e01511.
[Google Scholar]
68.
Igie U, Abbondanza M, Szymański A, Nikolaidis T. Impact of compressed air energy storage demands on gas turbine performance.
Proc. Inst. Mech. Eng. Part A J. Power Energy 2021,
235, 850–865.
[Google Scholar]