1. Introduction
To exploit the potential of renewable energy sources in power generation and to reduce their negative impacts on the distribution network, microgrid technologies have been developed [
1,
2]. A microgrid (MG) is a small-scale power grid consisting of renewable energy sources (RESs) such as wind, solar, and energy storage systems (ESSs) with interconnected electrical loads within a well-defined boundary [
3]. Microgrids can operate in parallel with the public power grid or independently. Grid-connected microgrids improve grid robustness and efficiency by enabling smooth adjustment of operations and increasing grid resilience in the event of interruptions. In island mode, the microgrid is disconnected from the main utility grid and operates independently with the micro-sources to supply power to the connected loads [
4]. In this mode, the microgrid acts as a controllable load or power source and can supply or receive power from the main grid [
5]. MG increases the stability of the distribution grid during grid failures, improves power quality, and acts as an emergency power source for the main supply grid [
6,
7,
8,
9,
10]. However, MG integration changes the current flow on the distribution network from unidirectional to bidirectional; which adversely affects system protection, and control, causing power imbalances, and voltage fluctuations [
11]. The liberalization of the electricity market and the reduction of subsidies for renewable energy force distribution network operators (DNOs) to actively seek new technologies to improve the reliability of the distribution system, resulting in the emergence of network microgrids (NMGs). A network microgrid is the physical and functional connection of a group of microgrids. NMGs offer multiple benefits to all energy stakeholders; however, due to the intermittent nature of renewable energy sources in microgrids, network instability, and poor power quality are some of the challenges [
12]. The power electronics unit is one of the essential components of a microgrid and offers diverse benefits to the grid. It improves various microgrid applications such as renewable energy integration, energy storage, and power conversion. Moreover, power electronic converters can not only realize maximum power point tracking of RESs but also flexibly control the active and reactive power supplied to the microgrid. The flexible controllability of power electronic converters in microgrids also enables advanced calculations and optimization of microgrid operation and management [
13]. Due to advancements in technologies, power electronic transformers (PETs) emerged and attracted increasing attention for various applications in microgrids. PET uses power electronic converters on both the primary and secondary sides of high-frequency or medium-frequency transformers. PET improves grid stability and power quality [
14]. To investigate different scenarios of power quality problems in interconnected microgrids operating in stand-alone and grid-connected modes, this paper proposes a multi-port power electronic transformer (MPPET). The proposed bidirectional MPPET consists of more than one port for different purposes, hence the name multi-port power electronic transformer.
Power electronic transformers, also known as solid-state transformers, have high scalability and multiple ports and are anticipated to be extensively employed in microgrids. When integrating multiple energy sources or loads, multi-port SST (MPSST) is one of the technologies to consider. It is ideal for applications involving zonal AC/DC hybrid microgrids with varying power sources and load voltage levels. MPSSTs improve system power density and permit multidirectional power flow. Separating the interface with a high-frequency transformer is one way to set up the MPSST. This allows us to regulate the power flow. A multi-port SST structure is also present to facilitate access to the low-voltage DC (LVDC) and high-voltage DC (HVDC) bus. More control freedom is offered by this structure, but an excessive number of port accesses may cause instability on the LVDC/HVDC bus. As a result, the number of ports may make the system less reliable and increase control complexity. For three-port systems, MPSST has thus been highly recommend [
15,
16,
17,
18]. The aims of this paper include: (i) to design community microgrids based on renewable energy sources that can operate autonomously as well as in grid-connected mode, (ii) to design and test a bidirectional MPPET for microgrids interface and compare the performance of interconnected microgrids with and without power electronic transformers interface, (iii) to study the steady state and dynamic operation of a multiport power electronic transformer with nested microgrid during various events on the grid, (iv) to investigate the power quality and stability enhancements of the proposed multiport power electronic transformer compared to the normal line frequency transformer. The rest of the paper is organized as follows: the modeling of the proposed microgrid is discussed in Section 2, Section 3 presents the concept of the proposed bidirectional power electronics transformer for microgrid interface, simulation scenarios, and results analysis are presented in Section 4, while Section 5 present the conclusion of the investigation.
2. Modeling of the Proposed Microgrid
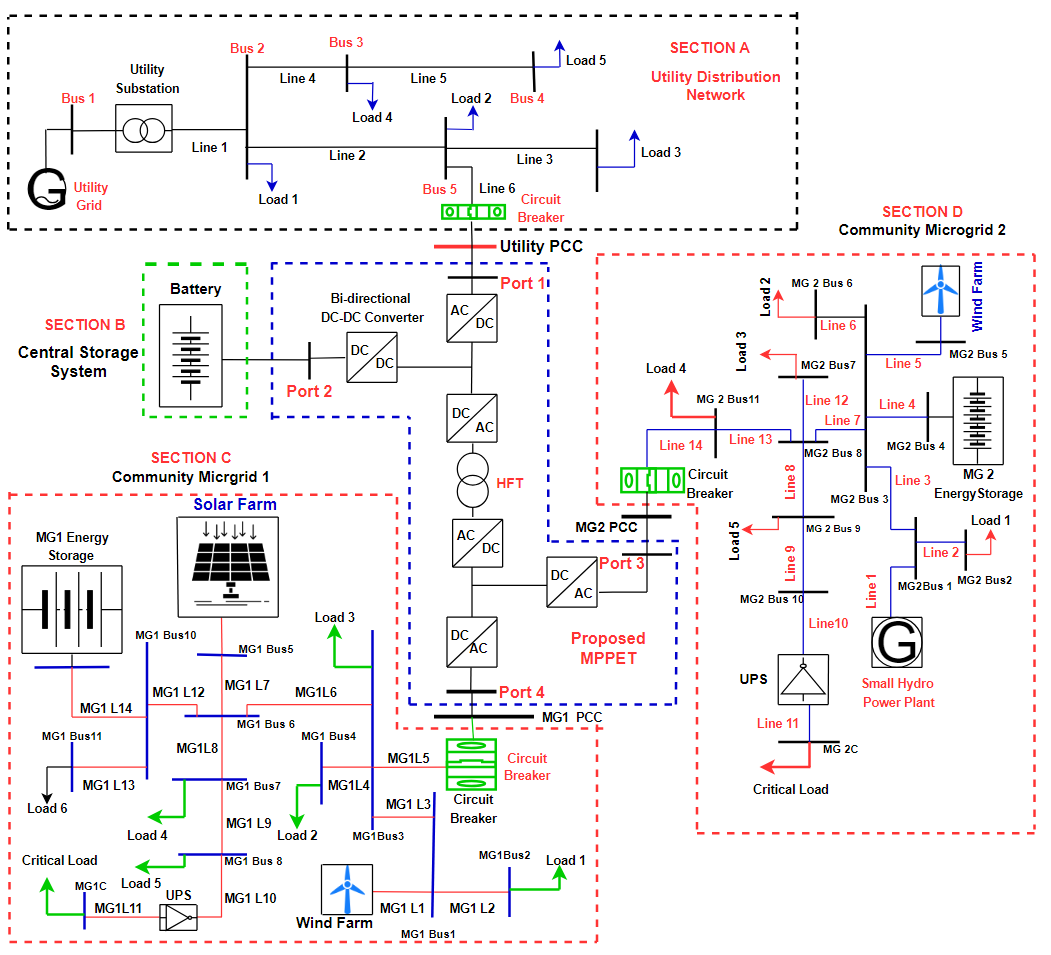
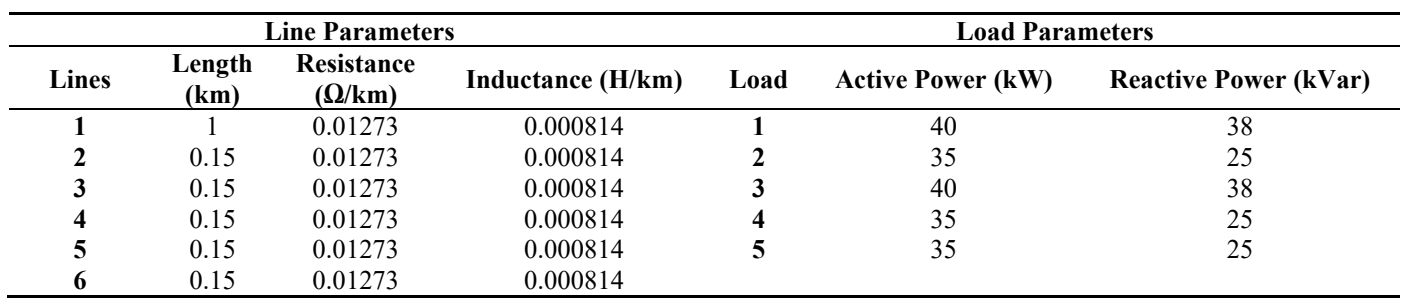
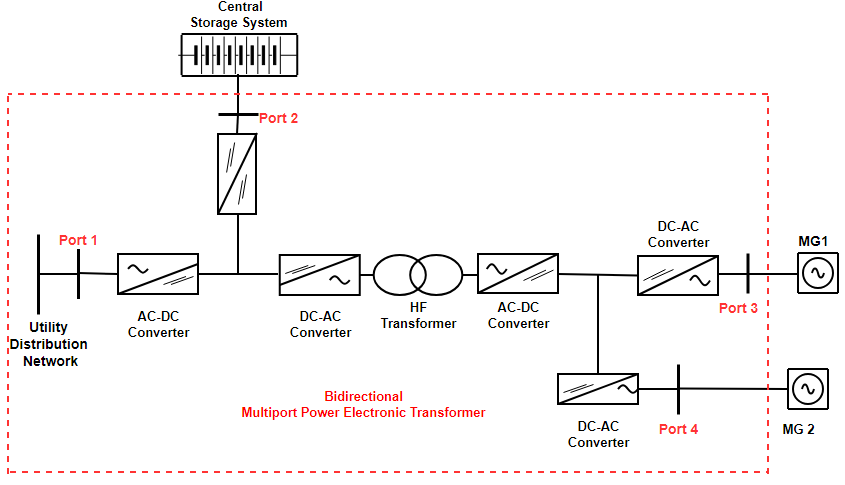
The proposed architecture of the power network under investigation is shown in . It consists of a utility distribution network as shown in section A of the proposed power network, the central storage system is shown in section B, while sections C and D depict community microgrids 1 and 2 respectively. The utility grid is connected to the proposed MPPET at port 1 through line 6 via a circuit breaker, and utility point of common coupling (PCC), as shown in . The central storage system is integrated into the proposed MPPET at port 2 via a bidirectional DC-DC converter while microgrids 1 and 2 are integrated into the proposed MPPET through ports 3 and 4 respectively as shown in sections C and D. The investigated network is designed and modeled using MATLAB/ SIMULINK. shows the simulated line and load parameters of the proposed utility distribution network.
. Complete single-line diagram of the proposed power network under investigation. (The arrows are labeled as loads).
. Utility distribution network parameters.
Community microgrids can remain connected to the main utility grid while conducting energy arbitrage and providing system support services [
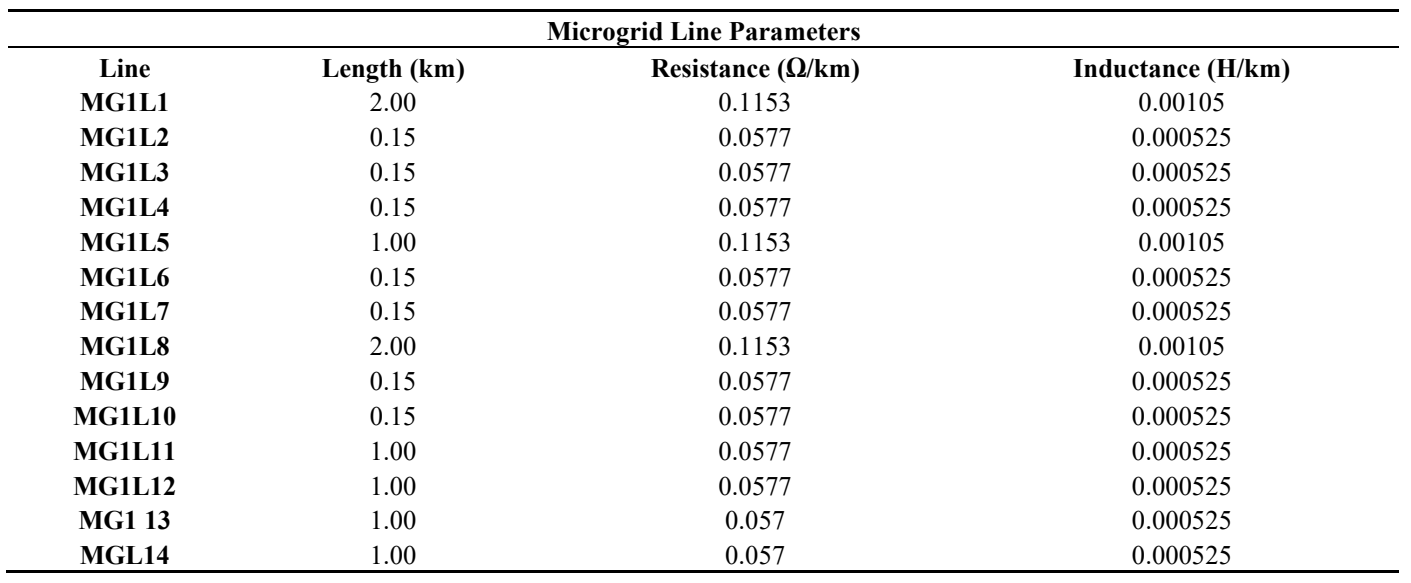
19]. Community microgrids can improve the reliability of power grids by keeping electricity flowing during natural disasters. In addition, by creating new revenue streams for all energy stakeholders, reducing network congestion, and shelving network expansion costs, community microgrids can reduce energy costs while having positive financial and environmental impacts. In this paper, the designed community microgrids are RESs based on battery energy storage systems (BESs). RESs used are wind, solar, and small hydropower plants. The analysis in this paper is conducted using two community microgrids, Microgrids 1 and 2, as shown in sections C and D of . The microgrids are connected to the main distribution network via 0.415 kV buses. In this paper, the proposed community microgrid 1 consists of a solar farm and wind farm, while a small hydroelectric power plant and wind farm are used in community microgrid 2. Both microgrids have energy storage systems and critical loads interconnected by a high-frequency transformer (HFT) based uninterruptible power supply (UPS). The HFT-based UPS not only ensures a continuous supply of power to the critical load it also prevents grid interruption from escalating from the input source to the connected load. In this paper, community microgrids 1 and 2 are similar, and the simulation parameters are identical. However, lists the simulation line parameters for MG1, while depicts the load parameter for the microgrid.
. Microgrids simulated line parameters.
. Microgrids load parameters.
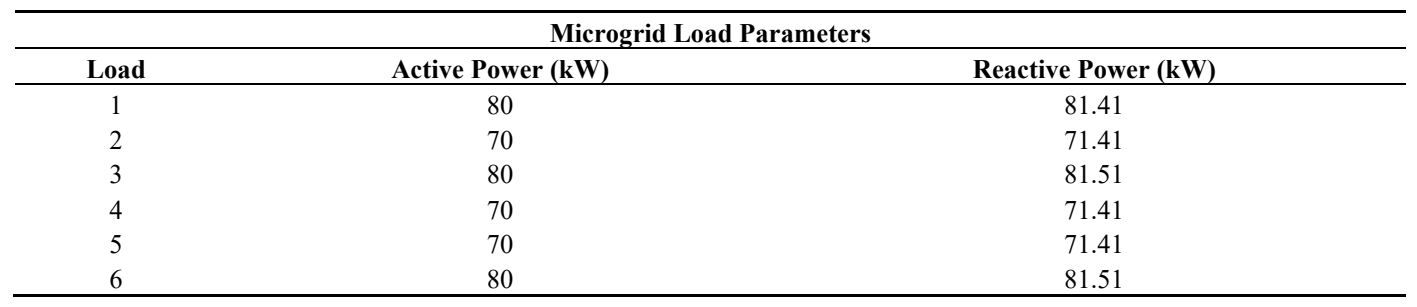
The proposed wind farm layout is shown in . Three 2 MW wind turbines connected to an 11-kV distribution network make up the 6 MW wind farm. Power is exported to a wind farm substation (11/0.415 kV) via a 2 km/11 kV feeder. As seen in , the step-down voltage from the substation is directly connected to the community microgrid. Double-fed induction generator (DFIG) based wind turbine (WT) is used in the design. DFIG technology maximizes turbine speed during wind gusts, minimizing mechanical stress on the turbine and maximizing wind energy production at low wind speeds. illustrates the connection of a wind farm to the microgrid.
. Typical layout of a wind farm.
The output power of the wind turbine is given in Equation (1) [
16,
17,
18,
19].
where
CP is the performance coefficient of the WT, the WT radius is
RT (m), $$\rho$$ is then air density (
kg/m3), and
VWind is the wind speed (
m/s). The performance coefficient (
CP) depends on the tip-speed ratio (
λ) and the blades’ pitch angle (
θ). The tip-speed ratio is defined as
ω = angular velocity of the blade (
rad/s)
2.3. Small Hydro-Power Plant
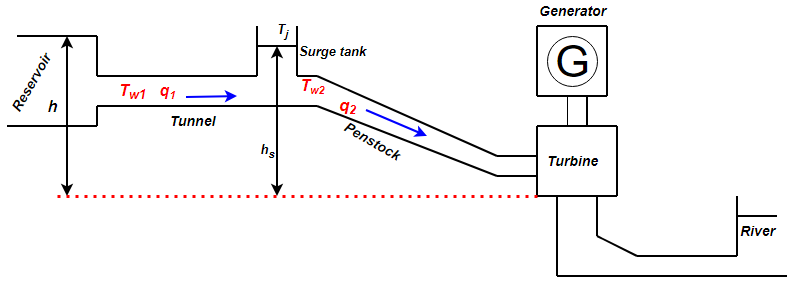
Hydropower plants with a generation capacity between 1 and 10 MW are considered small hydropower plants. The maximum output of a small hydroelectric power plant is determined by the constant flow of water. Head and flow are essential components of hydroelectric power generation. Head and flow are terms that describe the height and volume of gradient over which water falls in a given time. Energy production is maximized at high head and flow; high water flows over a steep gradient generate high energy. In hydroelectric power plants, water is passed through a turbine to produce electricity that drives an electrical generator. The electricity generated can be fed into a grid or used directly [
20,
21,
22]. shows the general structure of a small hydroelectric power plant (SHP), which consists of an electric generator, a speed controller, a reservoir, a water tunnel, a penstock, and a hydraulic turbine [
22,
23].
. Single line diagram of a small hydropower plant.
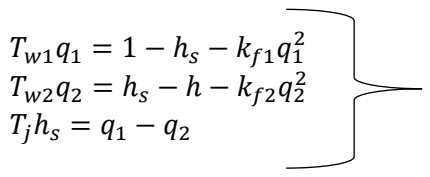
Since the rate of change of flow in the gate can be determined by comparing the water momentum in the pressure pipeline with the pressure head in the pipeline, as shown by equation [
22,
23], the dynamic of the tunnel is determined using the momentum laws.
where
ht and
hst are the turbine head and surge tank respectively, which are given in per unit with
hbase defined as the static head of the water column above the turbine.
kf1 and
kf2 are the friction losses on the conduit;
q1 and
q2 are the normalized flow rates on the tunnel and the penstock, respectively.
Tw1 and
Tw2 are the starting times of water in tunnel and penstock, which are defined as:
where
qbase is the turbine’s flow rate when the gate is fully open;
L is the length,
A is the area of the tunnel or penstock, and
g is the gravitational acceleration.
Tj is the storage constant of the surge tank.
where
As is the cross-section area of the surge tank. The pressure head through the turbine is associated with the flow rate and gate position, if the turbine can be depicted by the valve feature, as follows:
where
y is the gate position. The power generated by the turbine is calculated as the product of the flow rate and the head. However, if the turbine is not 100% efficient, then its losses are included subtracting the no-load flow from the actual flow. There is also a damping effect present which is dependent on gate opening for any load condition, the turbine power is given as:
where
At is the constant of proportionality and
qnl is the no-load flow rate of the hydro-turbine. ∆
ω is the turbine/rotor speed deviation and
D is the damping coefficient. Equations (6) and (7) represent the non-linear turbine model. Conventional PI and PID controllers have been widely used to control hydro-turbines. The classical PID controller is given as [
22,
23]:
where
Kp,
Ki, and
Kd are the proportional, integral, and derivative gains, respectively. The servo-motor is used to control the position of the valve and to regulate the flow of water in the turbine coordinated by the governor. The model of the servomotor for the HTGS can be described as:
where
Ty is the time constant of the servomotor. This model is considered non-linear since the output can be saturated (0 <
y ≤ 1) [
22,
23,
24].
2.4. Solar Farm Modeling
A solar farm is a large-scale installation of solar photovoltaic (PV) or other solar energy harvesting technologies to capture solar radiation for energy production [
25,
26,
27,
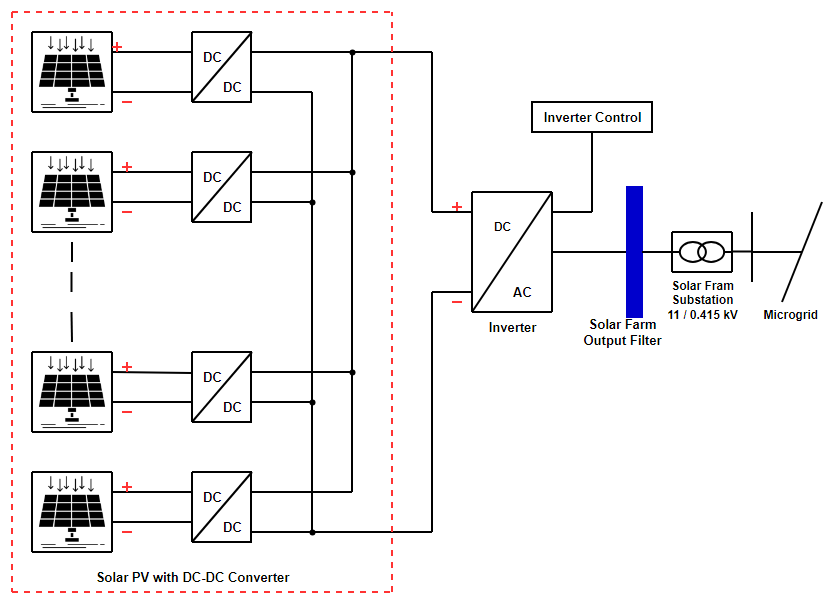
28]. The basic structure of a solar farm is shown in .
. The basic structure of a solar farm.
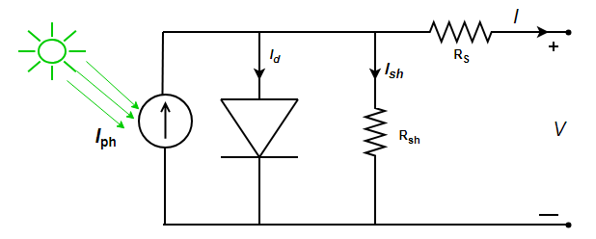
1000 kW solar farm designed for this study is connected to the solar farm substation (11 kV/0.415) via DC-DC converter and voltage source converter which export power to the community microgrid. LCL output filter is designed for the solar farm. A photocurrent source and a diode coupled with series and shunt resistors can be used to represent the single diode model of a photovoltaic module as shown in .
. Single diode model of a photovoltaic module.
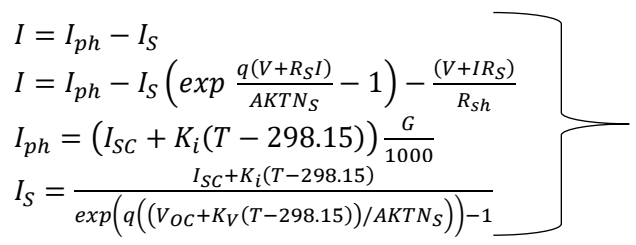
Equation (10) represents the mathematical model of the photovoltaic module [
29]:
where
I is the output Current (A),
Iph is the panel photocurrent (A), the Diode saturation current (A) is represented as
IS, Solar irradiation in (
W/m2) is denoted by
G,
K is the Boltzmann’s constant in (
J/K),
q is the electron charge (C), the series resistance (Ω) and shunt resistance (Ω) are given as
RS and
RSh respectively. The Junction temperature (K) is represented as
T, the output voltage, and open circuit voltage are given as
V and
VOC (
v) respectively,
NS is the number of cells,
Ki is the Cell’s short circuit current temperature co-efficient,
A is the ideality factors and
KV is voltage/temperature coefficient.
2.5. Uninterruptible Power Supply (UPS)
An uninterruptible power supply (UPS) is an electrical device that maintains an emergency and continuous power supply to a vital load in the event of a power outage or grid malfunction. This work proposes the use of a HFT-based UPS to ensure continuous power supply to the critical loads in the community and also prevent the impacts of disturbances on the grid from escalating to the output of the connected critical loads. shows the structure of the proposed UPS. It consists of an input AC-DC converter, a bidirectional DC-DC converter for battery storage, DC-AC and AC-DC converters at the primary and secondary sides of the HFT transformer. The output stage comprises of DC-AC converter which integrates the UPS to the critical loads. The UPS not only ensures a constant power supply but also isolates the loads from the main network during power interruptions in the network while maintaining the quality of the power supply.
. Simplified block diagram of the high-frequency transformer-based UPS.
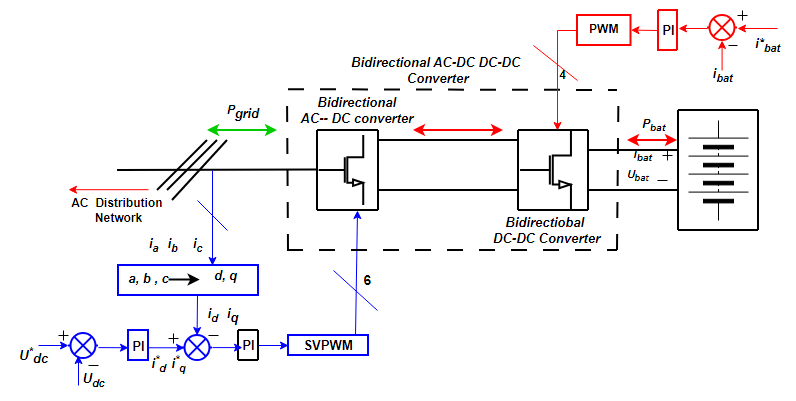
The storage system is made up of bidirectional AC-DC converters which connect the system to the AC grid and bidirectional DC-DC converters with a battery controller. The AC-DC converter transforms AC to DC and the bidirectional DC-DC converter manages the power flow between the DC bus and the battery. The structure of the battery storage for charging and discharging with the control system is shown in .
. Storage system with controller. The arrows indicate the power flow direction.
3. Proposed Bidirectional MPPET for Microgrids Interface
The essential elements for the effective operation and integration of MGs include power electronic devices and communication links [
30]. However, they are extremely vulnerable to issues like power quality, instability, and cyber-attacks. To overcome these and some other microgrid challenges as well as enhance higher penetration of renewable-based microgrids into the distribution networks, this paper proposes the use of a bidirectional multiport power electronics transformer (MPPET) for interfacing the utility grid with microgrids. The proposed MPPET is scalable and does not require any special communication devices, thus the system is not liable to cyber-attacks. The basic block diagram of the proposed MPPET is shown in .
. Proposed multiport power electronics transformer.
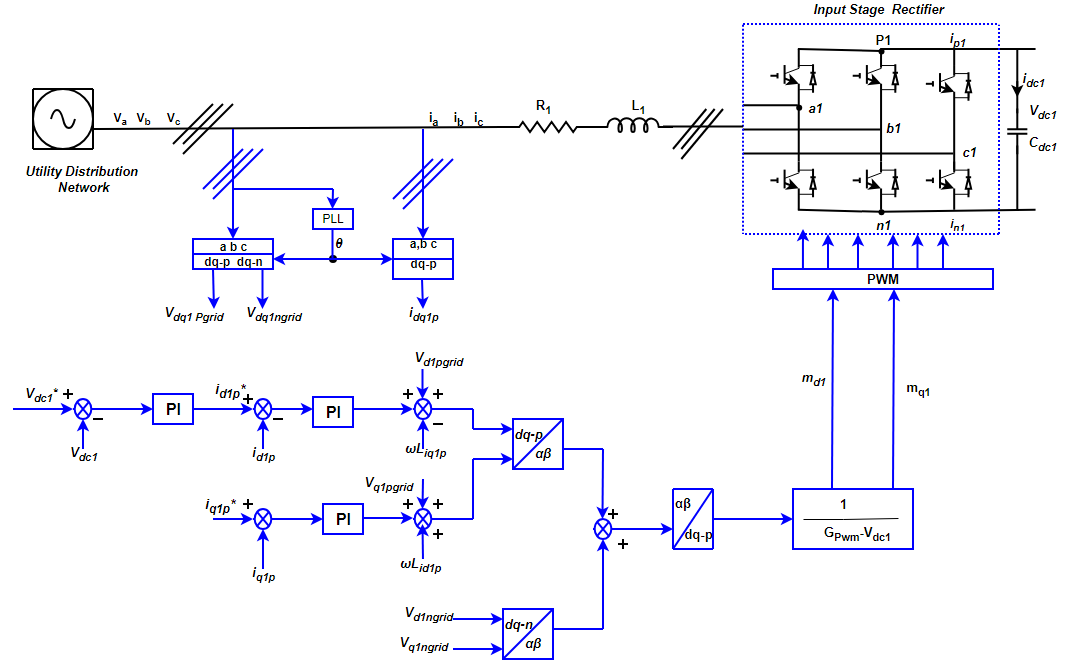
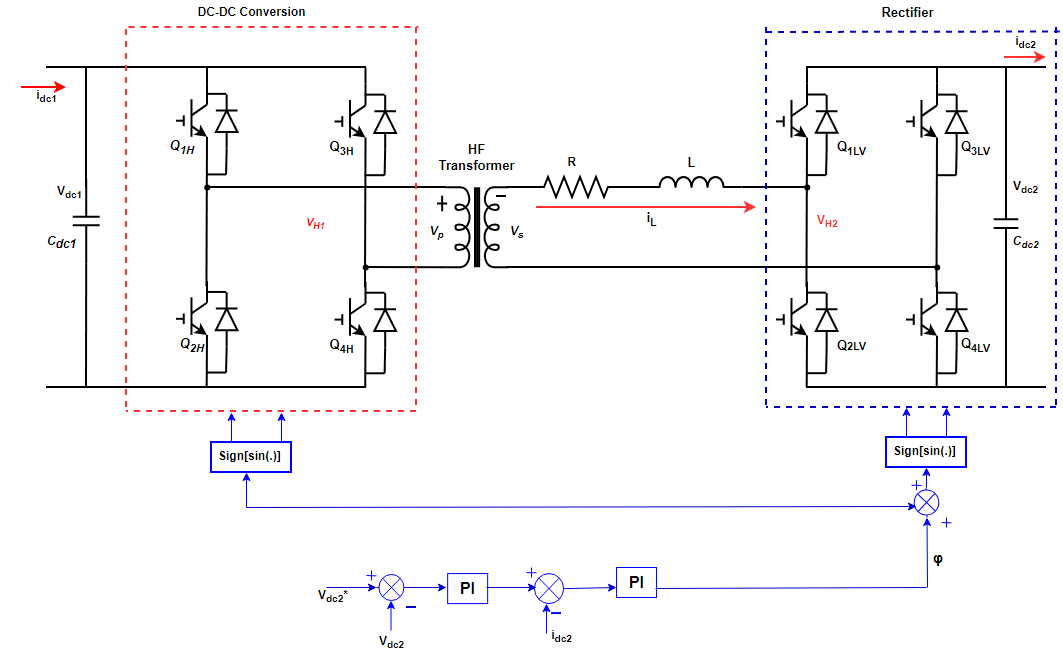
The input stage consists of a three-phase AC-DC converter that acts as a rectifier by converting the AC grid voltage to DC voltage. The second stage is the isolation stage, which consists of DC-AC and AC-DC converters on the medium-voltage and low-voltage sides of a HFT. The medium-voltage side converter transforms the medium voltage into a high-frequency square-wave voltage, which is then applied to the high-frequency transformer’s primary. The secondary side converter converts the translated high-frequency square-wave signal to low-voltage DC voltage. The output stage generates the desired AC waveforms using DC-AC converters. The utility distribution network is connected directly to the MPPET’s input AC port 1 via an AC-DC converter, the central energy storage system is connected to port 2 via a DC-DC converter, while the two community microgrids are connected to the proposed MPPET via DC-AC converters at ports 3 and 4 respectively. depicts the control configuration for the input stage.
. Input stage of the proposed power electronic transformer with a control system.
The
dq model for the HV side converter is given as:
where
id1,
iq1 are the HV-side grid currents in the rotating
dq frame;
vd1conv,
vq1conv are the HV-side converter voltages in the rotating
dq frame;
vd1grid,
vq1grid are the HV-side grid voltages in the rotating
dq frame;
ω1 is the HV-side grid angular frequency;
R1 is the HV-side filter resistance; and
L1 is the HV-side filter inductance. To obtain a noise-free synchronous grid angle required for the
dq transforms, a phase-locked loop (PLL) is used. Two H-bridges form the isolation stage of the PET. The switching method used by primary and secondary H-bridges is high-frequency square wave switching. The phase shift 𝜑 controls the amount and direction of active power flow between the primary and secondary sides [
31,
32].
where
Po is the average power through the transformer;
vdc1,
vdc2 are the capacitor
dc voltages;
m is the high-frequency transformer ratio;
L is the transformer leakage inductance referred to the secondary side; 𝜑 is the phase-shift between central bridges; and
ω is the angular frequency. Current flow to the end-user side is allowed throughout the DC-DC converter when the voltage
vH1 is ahead of the voltage
vH2, which is shown as positive. Voltage
vH2 conducts voltage
vH1 when current flows toward the microgrid; thus, 𝜑 is shown as negative. Regardless of which direction the current flows, the absolute value of this reference phase shift angle is limited to 𝜋/2. To regulate the phase shift, it is important to determine the output capacitor voltage
vH2 as a function of the power flowing through the transformer. There is an inner loop and an outer loop. The inner loop controls the transformer inductance current (
idc2), and the output loop controls the capacitor voltage (
vdc2). When these two control loops work together, oscillations are prevented and the control response is accelerated. shows the isolation level control block diagram.
. MPPET Isolation Stage with control system.
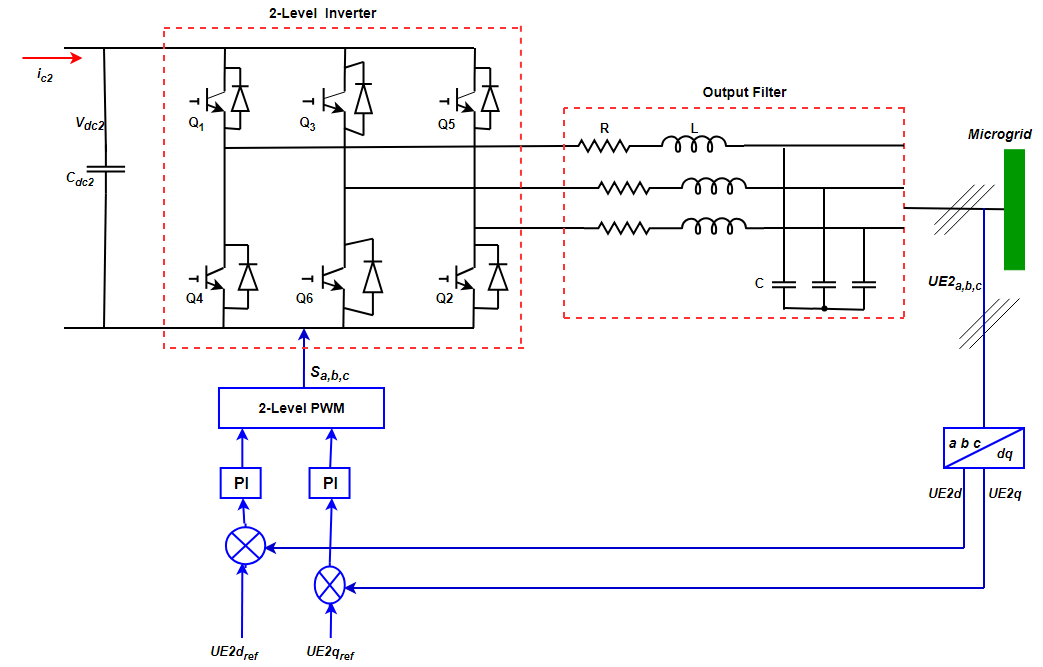
The output stage converter consists of a two-level converter and three-phase converter which acts as an inverter to convert the DC voltage to AC voltage and connect the network to the proposed community microgrids. When transient changes occur in the system under investigation, the output stage delivers a constant output voltage to the connected microgrids independently of the fluctuation in the level of the micro-generation, unbalanced, or balanced current. The output stage inverter with a control system is shown in .
. Output stage of the proposed power electronic transformer with the control system.
Equations (14) and (15) represent the output stage d-q model of the design.
where
LE2 is the interface inductances,
iE2 is the line current on the secondary side,
uE2 is the terminal AC voltage at the secondary side of the transformer,
u2 is output voltages in the secondary and
ω is the grid voltage synchronous angular frequency. The power electronic transformer simulated parameters are listed in .
. Simulation parameters of the proposed power electronic transformer.
4. Simulation Scenarios and Result Discussion
- Case 1: Steady-state operation of the system under investigation with and without PET interface
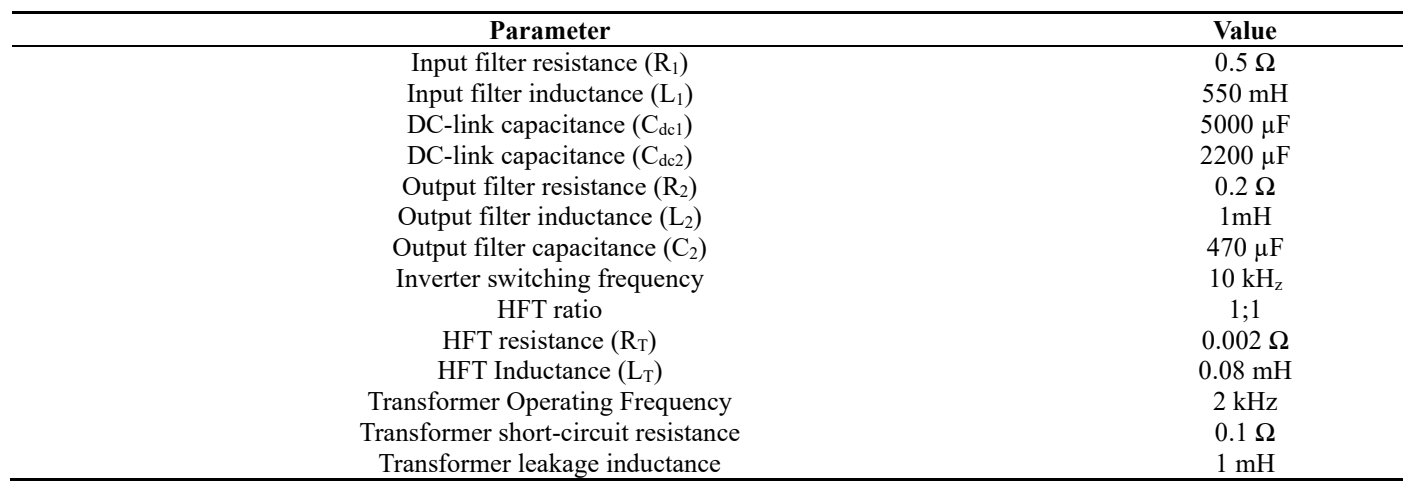
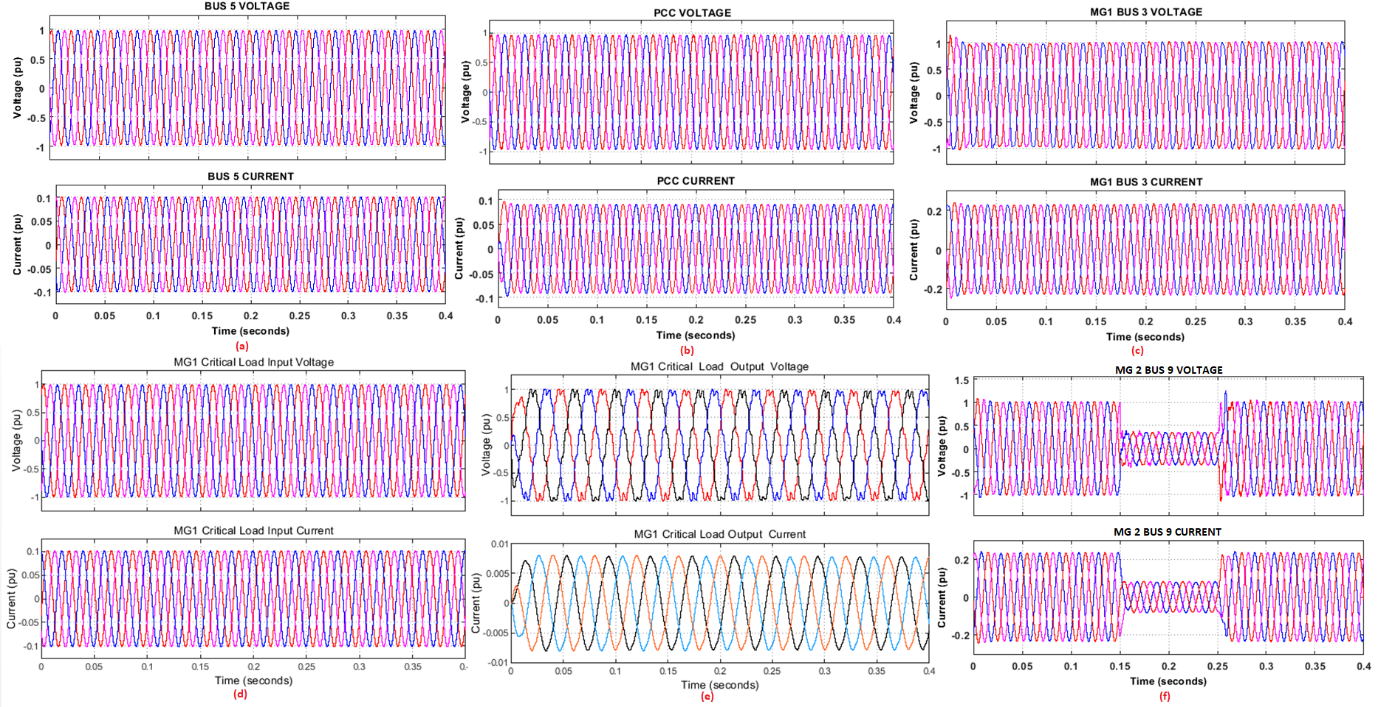
In this case, the proposed network is simulated under normal operating conditions when there are no disturbances on the grid with and without MPPET. , , , and illustrate the steady state simulation waveforms under normal operation of the system.
Figure 12. Utility grid and PCC waveforms during steady-state operation WITH MPPET interface (<b>a</b>) Utility grid Bus 5 Voltage and current with MPPET (<b>b</b>) PCC Voltage and current with MPPET (<b>c</b>) PCC Active and Reactive Power with PET.
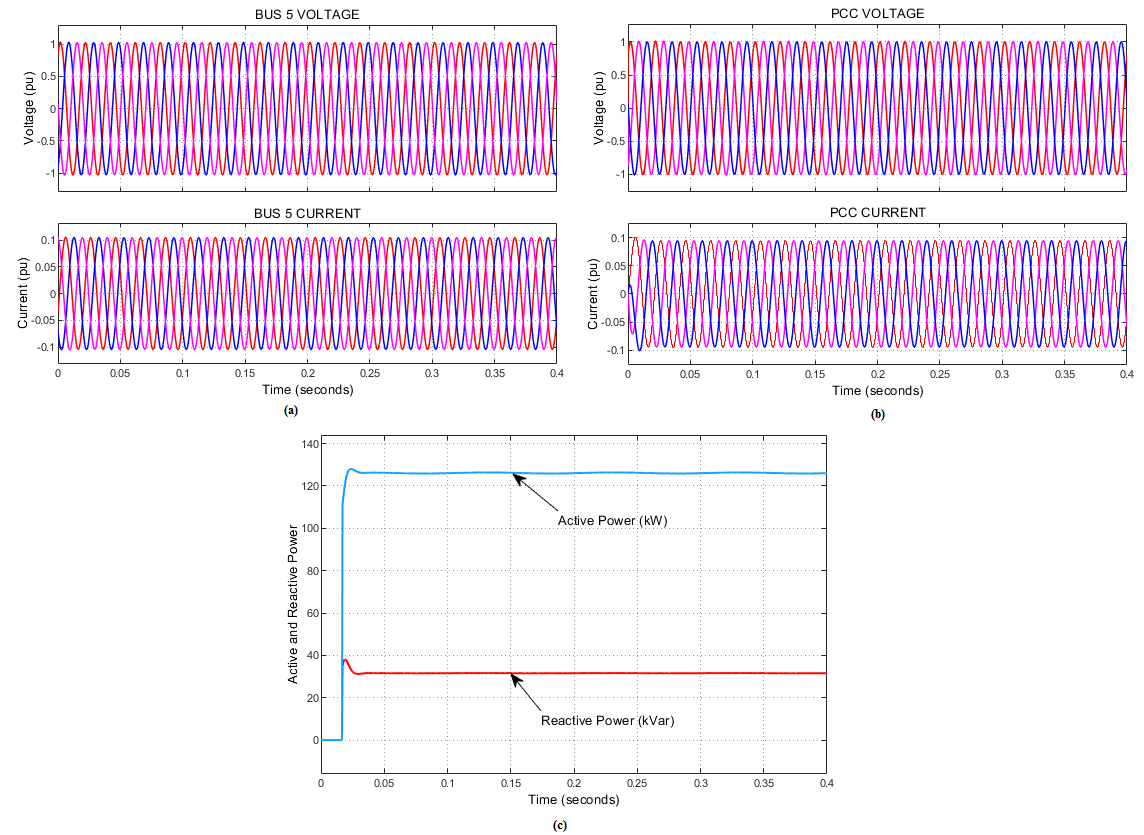
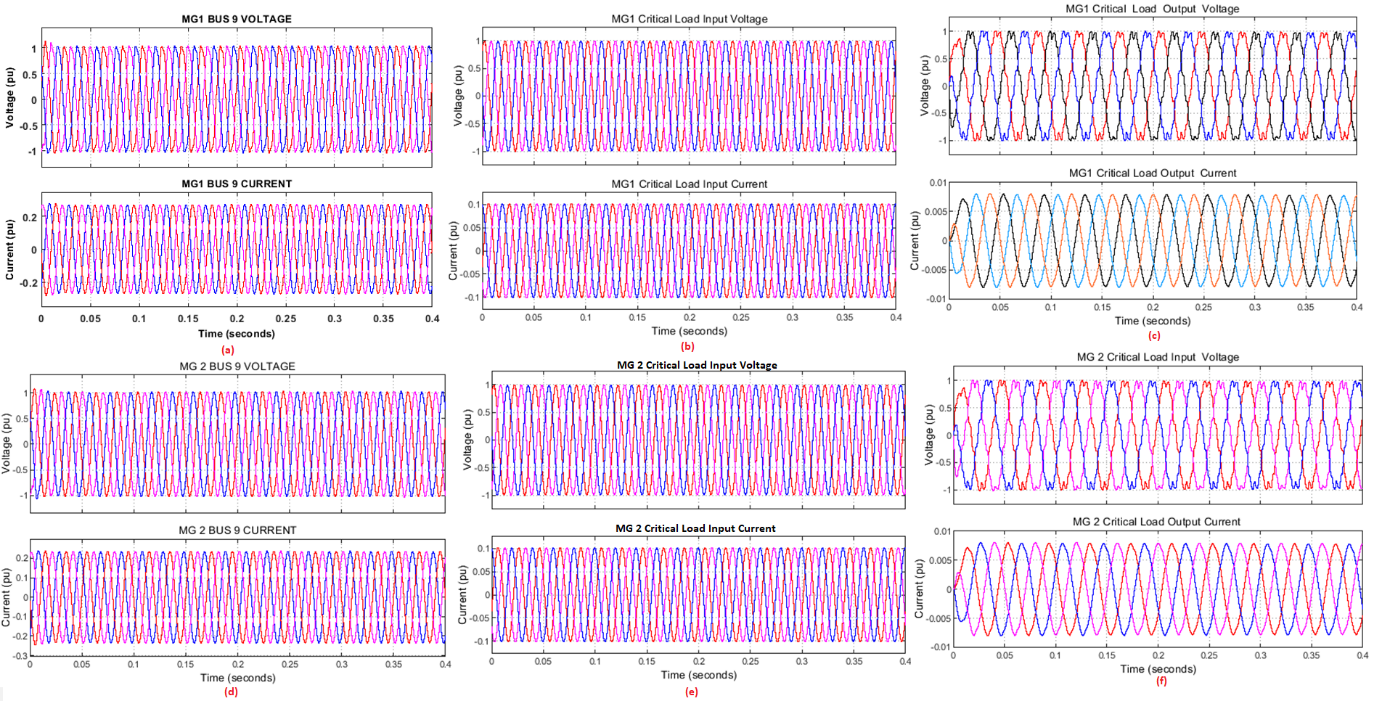
Figure 13. Microgrid 1 and 2 waveforms WITH MPPET interface during steady-state operation. (<b>a</b>) Microgrid 1 Bus 9 Voltage and Current (<b>b</b>) MG1 Critical Load input Voltage and Current (<b>c</b>) MG1 Critical load output voltage and current (<b>d</b>) MG2 Bus 3 Voltage and Current, (<b>e</b>) MG2 Critical load input voltage and current (<b>f</b>) MG2 Critical loads output voltage and current.
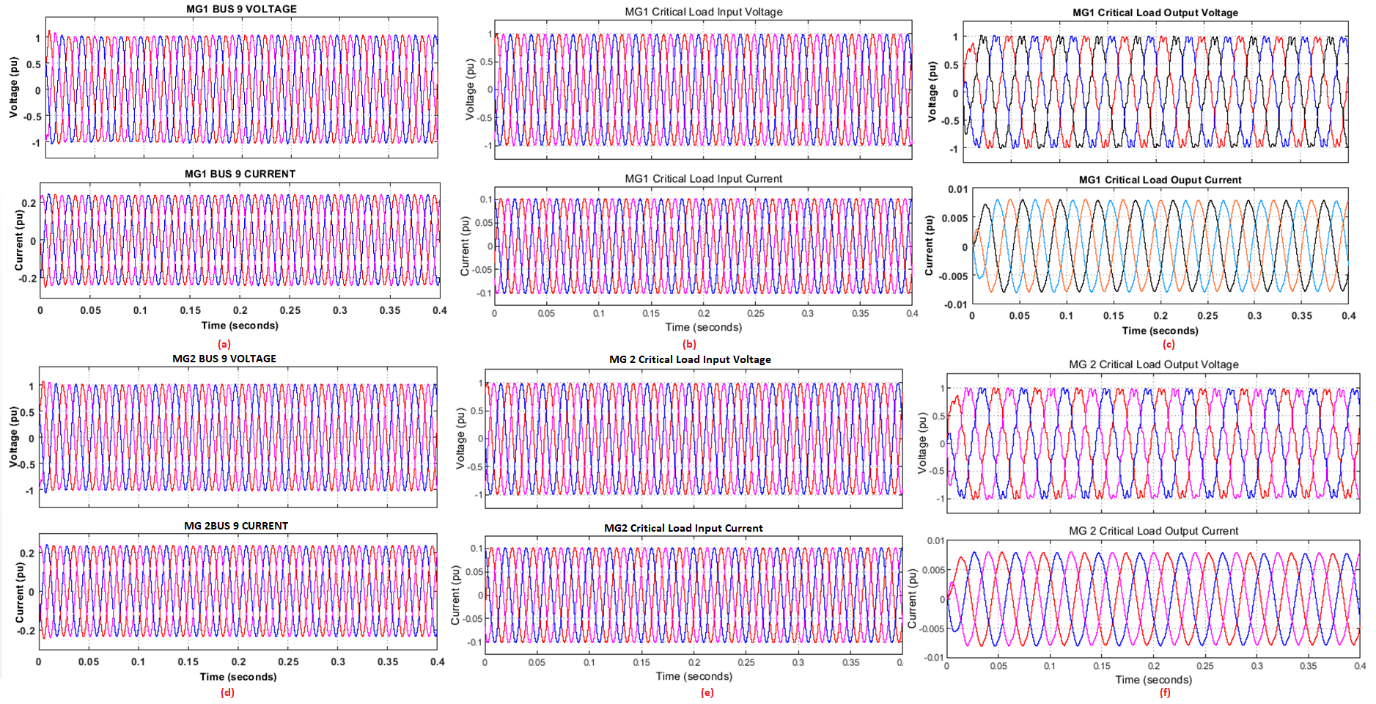
Figure 14. Utility grid and PCC waveforms during steady-state operation WITHOUT MPPET interface (<b>a</b>) utility grid Bus 5 Voltage and current MPPET (<b>b</b>) PCC Voltage and current (<b>c</b>) PCC Active and Reactive Power.
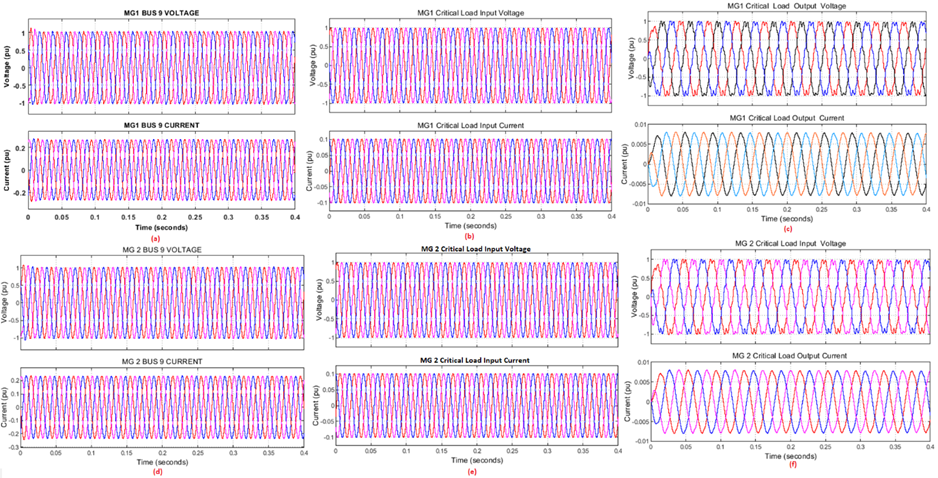
Figure 15. Microgrid 1 and 2 waveforms WITHOUT MPPET interface during steady-state operation (<b>a</b>) MG1 Bus 9 Voltage and Current (<b>b</b>) MG1 Critical Load input Voltage and Current (<b>c</b>) MG1 Critical load output voltage and current (<b>d</b>) MG2 Bus 10 Voltage and Current, (<b>e</b>) MG2 Critical load input voltage and current (<b>f</b>) MG2 Critical loads output voltage and current.
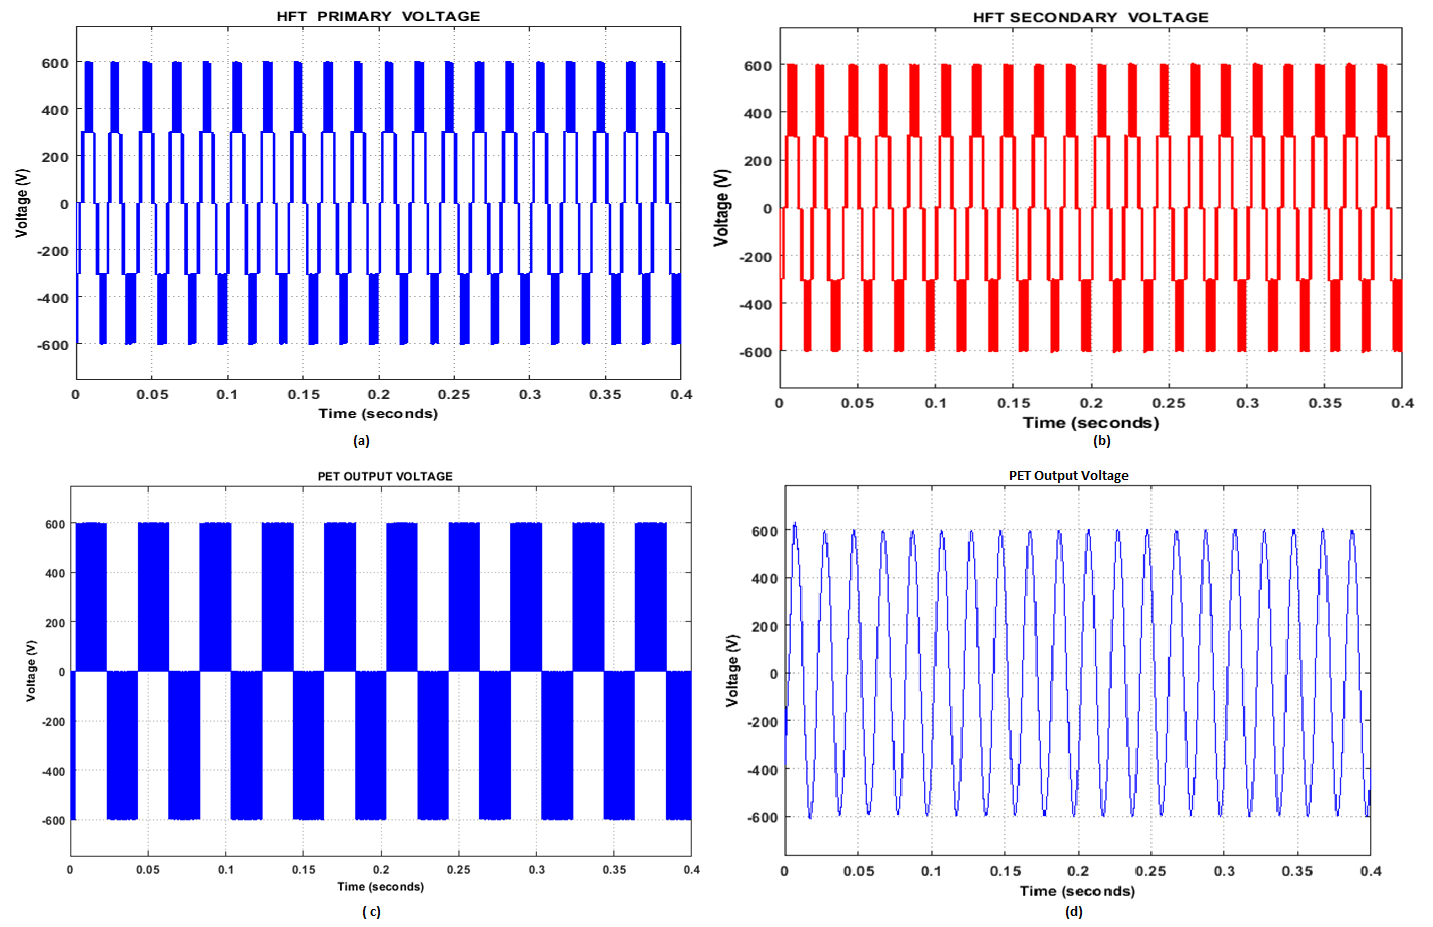
Figure 16. MPPET steady-state characteristics. (<b>a</b>) HFT primary voltage, (<b>b</b>) HFT secondary Voltage (<b>c</b>) HFT Voltage before Filter (<b>d</b>) HFT output Voltage after the filter.
A steady-state scenario is a situation where the system is not subjected to any interruptions. , , and show steady-state simulation waveforms of the system under investigation with and without the MPPET interface. As can be seen in the Figures, the system operates within the IEEE recommended voltage limits of 0.95 and 1.05 p.u. Microgrids and critical loads operate under the recommended per-unit voltage with and without the MPPET interface. The steady-state characteristics, including the HFT primary and secondary voltages and the MPPET input voltage before and after the filter, are shown in . Since the ratio of the working voltages of the transformer is 1:1, the primary and secondary voltages of the HFT are equal, and the HFT output voltage before the filter is a square wave shape, but the voltage after the filter is a sine wave.
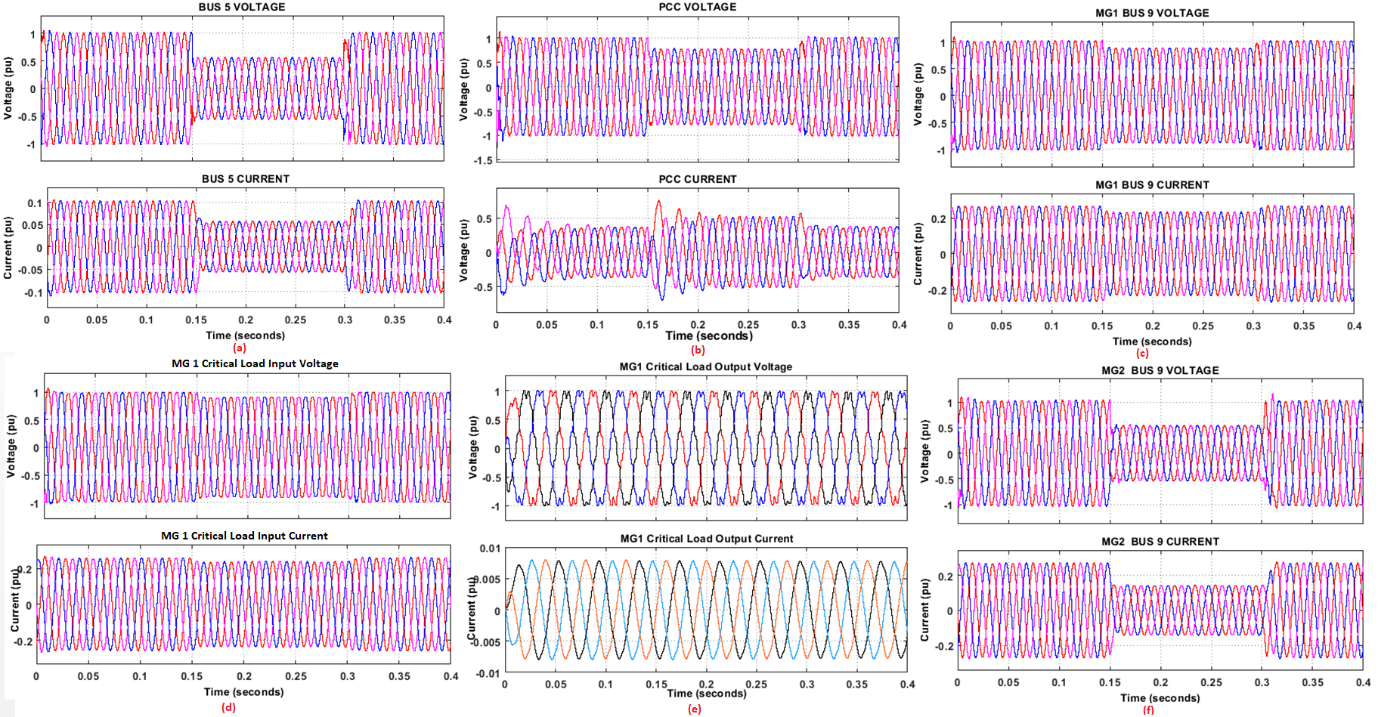
In this case, the investigated network is subjected to a three-phase fault at the utility grid side and also at the microgrid side with and without the MPPET interface to show the isolation capability of the proposed transformer.
i. Fault at Utility grid with and without PET
and show the simulation waveforms of the system during a three-phase fault at the utility grid side.
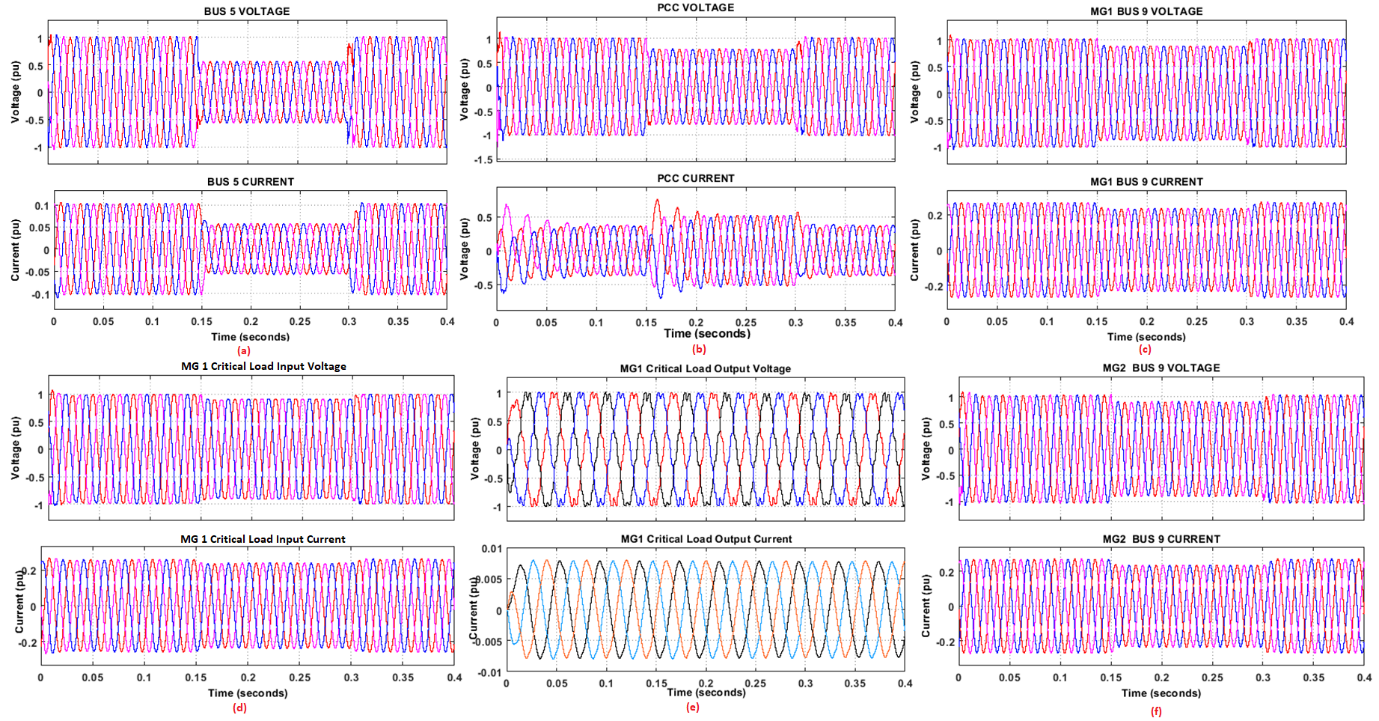
The utility grid, PCC, and microgrid simulation waveforms of the system under investigation with the MPPET interface are shown in . The fault occurs at t = 0.15s and clears off at 0.25s, as can be seen in a,b the fault affected both the utility grid and PCC. Due to the fault isolation ability of the proposed MPPET, the impact of the fault is not transmitted to the connected microgrids, as shown in c–f the system works perfectly and complies with the IEEE per-unit standard. depicts the simulation waveforms of the system without the MPPET interface. As can be seen in the Figures, the effect of the fault spread throughout the investigated power system network, threatening the reliability and stability of the system (a–d,f). However, with the HFT-based UPS, the fault did not propagate to the output of the critical loads, as shown in e.
Figure 17. Simulation waveforms during fault at utility grid WITH MPPET interface (<b>a</b>) Utility grid (<b>b</b>) PCC waveforms (<b>c</b>) MG1 waveform (<b>d</b>) MG1 Critical load input waveforms (<b>e</b>) MG1 critical load output waveforms (<b>f</b>) MG2 waveforms.
Figure 18. Simulation waveforms during fault at utility grid WITHOUT MPPET interface (<b>a</b>) Utility grid (<b>b</b>) PCC waveforms (<b>c</b>) MG 1 waveforms (<b>d</b>) MG1 Critical load input waveforms (<b>e</b>) MG1 critical load output waveforms (<b>f</b>) MG2 waveforms.
In this instance, Line 3 in MG2 experiences a three-phase fault. and show the simulation waveform of the system with and without the MPPET interface.
As shown in a–e, the utility grid, PCC, and microgrid 1 were not affected by the fault due to the isolation capability of the proposed MPPET interface. MG 2, which is the source of the fault, was severely affected as shown in f. In contrast to the situation described above, when the system operated without the MPPET interface, the impact of the fault was distributed across the investigated power grid, as shown in . Nevertheless, the critical load output voltage in MG1 and MG2 was not affected due to the HFT-based UPS, as shown in e.
Figure 19. Fault simulation at microgrid side WITH MPPET interface (<b>a</b>) Utility grid voltage and current waveforms (<b>b</b>) PCC voltage and current waveforms (<b>c</b>) MG1 voltage and current waveforms (<b>d</b>) MG1 Critical load input voltage and current waveforms (<b>e</b>) MG1 Critical load output voltage and current waveforms (<b>f</b>) MG2 voltage and current waveforms.
Figure 20. Fault simulation at microgrid side WITHOUT MPPET interface (<b>a</b>) Utility grid voltage and current waveforms (<b>b</b>) PCC voltage and current waveforms (<b>c</b>) MG1 voltage and current waveforms (<b>d</b>) MG1 Critical load input voltage and current waveforms (<b>e</b>) MG1 Critical load output voltage and current waveforms (<b>f</b>) MG2 voltage and current waveforms.
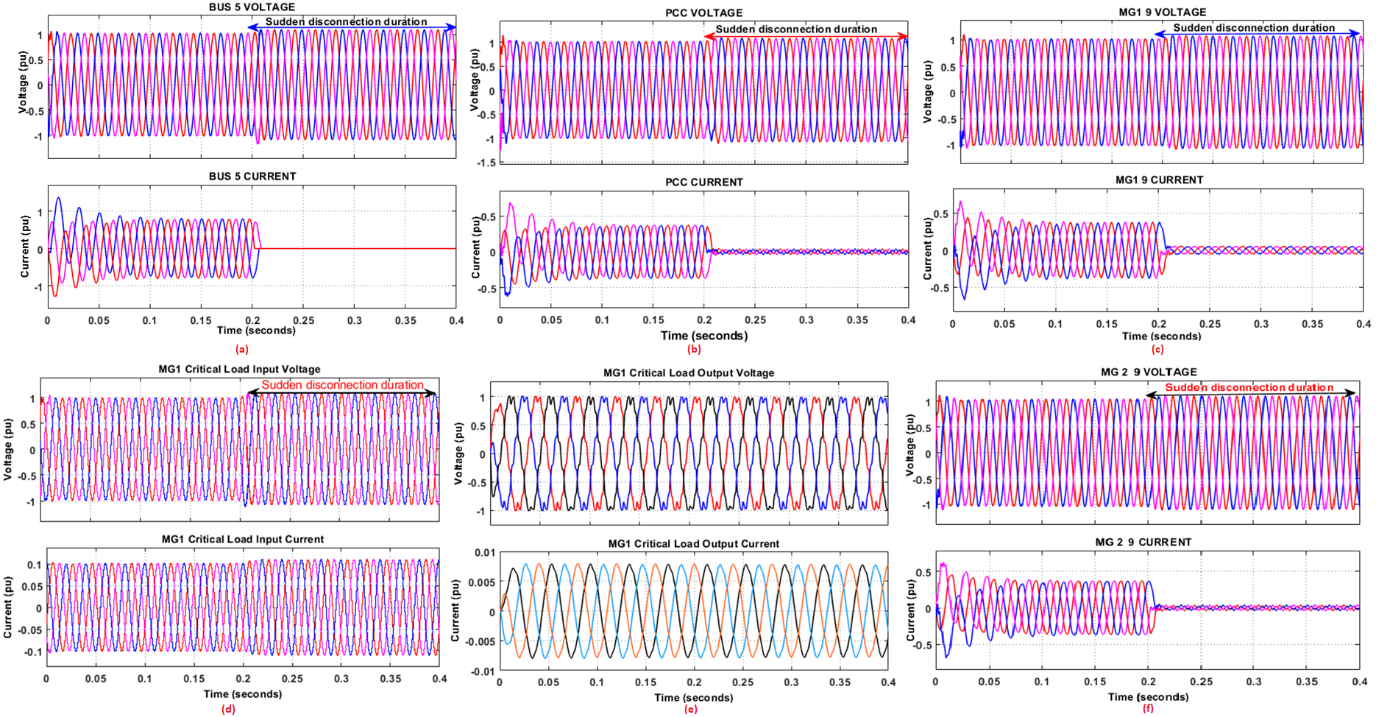
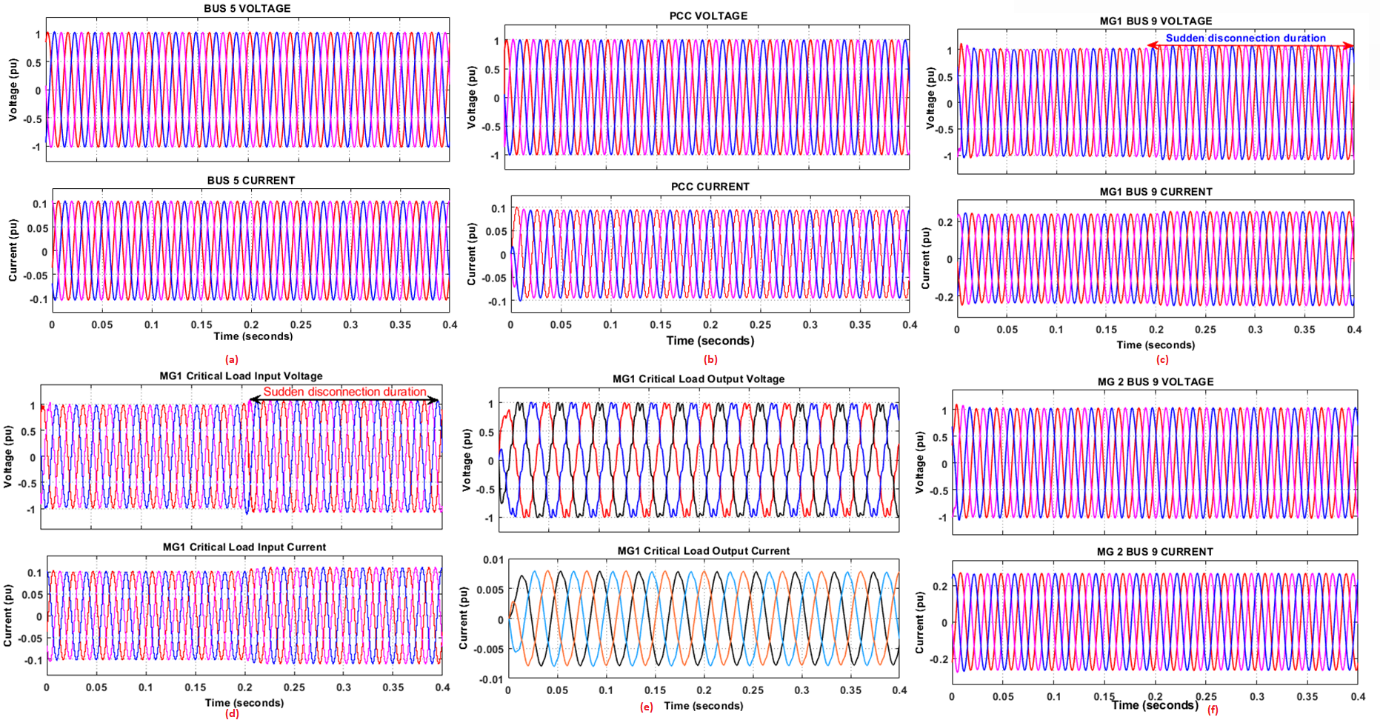
- Case 3: Unplanned Islanding
i. Unplanned islanding of Utility grid with and without MPPET
This section discusses the impact of the sudden isolation of the utility grid from the integrated microgrids with and without the MPPET interface. shows the simulation waveforms of the system under investigation with the MPPET interface, while waveforms of the system without an MPPET interface.
As can be seen in a,b, the utility grid and the PCC were affected by the scenarios, a experienced voltages and current swells, while the PCC experienced voltage collapses, as seen in b. Community microgrids 1 and 2 were not affected by the sudden disconnection of the utility grid due to the isolation ability of the proposed MPPET c–f. This proves the effectiveness of the proposed MPPET in power quality and grid stability enhancement. depicts the unplanned islanding simulation waveforms without an MPPET interface. As can be seen, the impact of the scenario spread across the power system under investigation. At t = 0.2 s, the utility grid, PCC, and the microgrids experienced voltage swell (a–d,f). However, due to the HFT-based UPS, the output voltage of the critical loads was not affected by the sudden islanding of the utility grid e.
Figure 21. Utility grid unplanned islanding simulation waveforms WITH MPPET interface (<b>a</b>) Utility grid voltage and current waveforms (<b>b</b>) PCC voltage and current waveforms (<b>c</b>) MG1 voltage and current waveforms (<b>d</b>) MG1 Critical load input voltage and current waveforms (<b>e</b>) MG1 Critical load output voltage and current waveforms (<b>f</b>) MG2 voltage and current waveforms.
Figure 22. Utility grid unplanned islanding simulation waveforms WITHOUT MPPET interface (<b>a</b>) Utility grid voltage and current waveforms (<b>b</b>) PCC voltage and current waveforms (<b>c</b>) MG1 voltage and current waveforms (<b>d</b>) MG1 Critical load input voltage and current waveforms (<b>e</b>) MG1 Critical load output voltage and current waveforms (<b>f</b>) MG2 voltage and current waveforms.
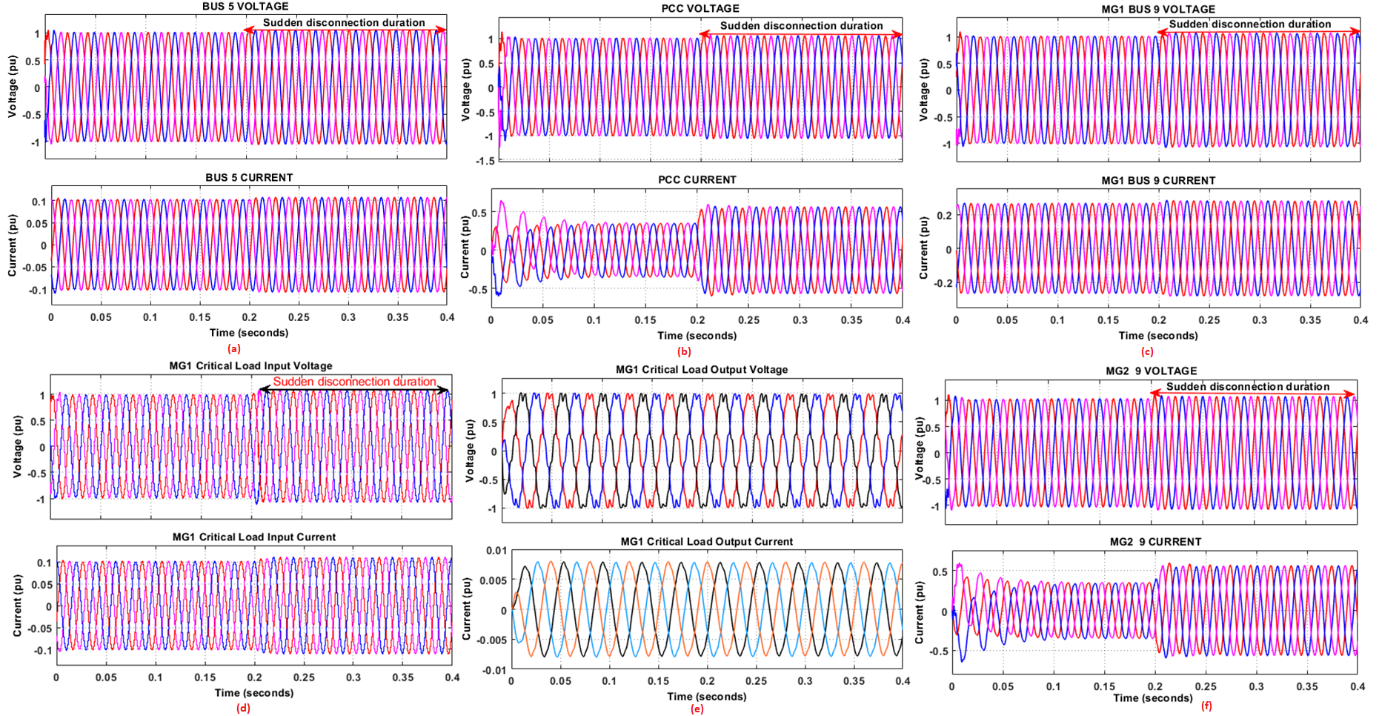
In this case, community microgrid 1 is suddenly disconnected from the power system under investigation to observe the performance of the proposed MPPET in response to the situation on the grid. shows the simulation waveforms of the situation with MPPER interface, while depicts the simulation waveforms without MPPET.
Figure 23. Community microgrid 1 unplanned islanding simulation waveforms WITH MPPET interface (<b>a</b>) Utility grid voltage and current waveforms (<b>b</b>) PCC voltage and current waveforms (<b>c</b>) MG1 voltage and current waveforms (d<b></b>) MG1 Critical load input voltage and current waveforms (<b>e</b>) MG1 Critical load output voltage and current waveforms (<b>f</b>) MG2 voltage and current waveforms.
Figure 24. Community microgrid 1 unplanned islanding simulation waveforms WITHOUT MPPET interface (<b>a</b>) Utility grid voltage and current waveforms (<b>b</b>) PCC voltage and current waveforms (<b>c</b>) MG1 voltage and current waveforms (<b>d</b>) MG1 Critical load input voltage and current waveforms (<b>e</b>) MG1 Critical load output voltage and current waveforms (<b>f</b>) MG2 voltage and current waveforms.
As shown in c, only MG 1, which is the source of the islanding, is affected; the critical load input source is also affected. However, due to the HFT-based UPS, the critical load output voltage is not affected, as seen in e. Some selected bus voltages from the utility grid, PCC, and MG2 are shown in a,b,f, which proves that the impact of the sudden disconnection of MG1 is propagated to other parts of the power grid system under investigation. The unplanned islanding simulation waveforms without the MPPET interface are shown in . The impact of the scenario propagates throughout the power system under investigation. Voltage rises were observed at t = 0.2 s for the utility grid, PCC, and MG1, which are the sources of the sudden disconnection (a–d,f). Nonetheless, the abrupt islanding of the utility grid did not affect the critical loads’ output voltage because of the HFT-based UPS (e).
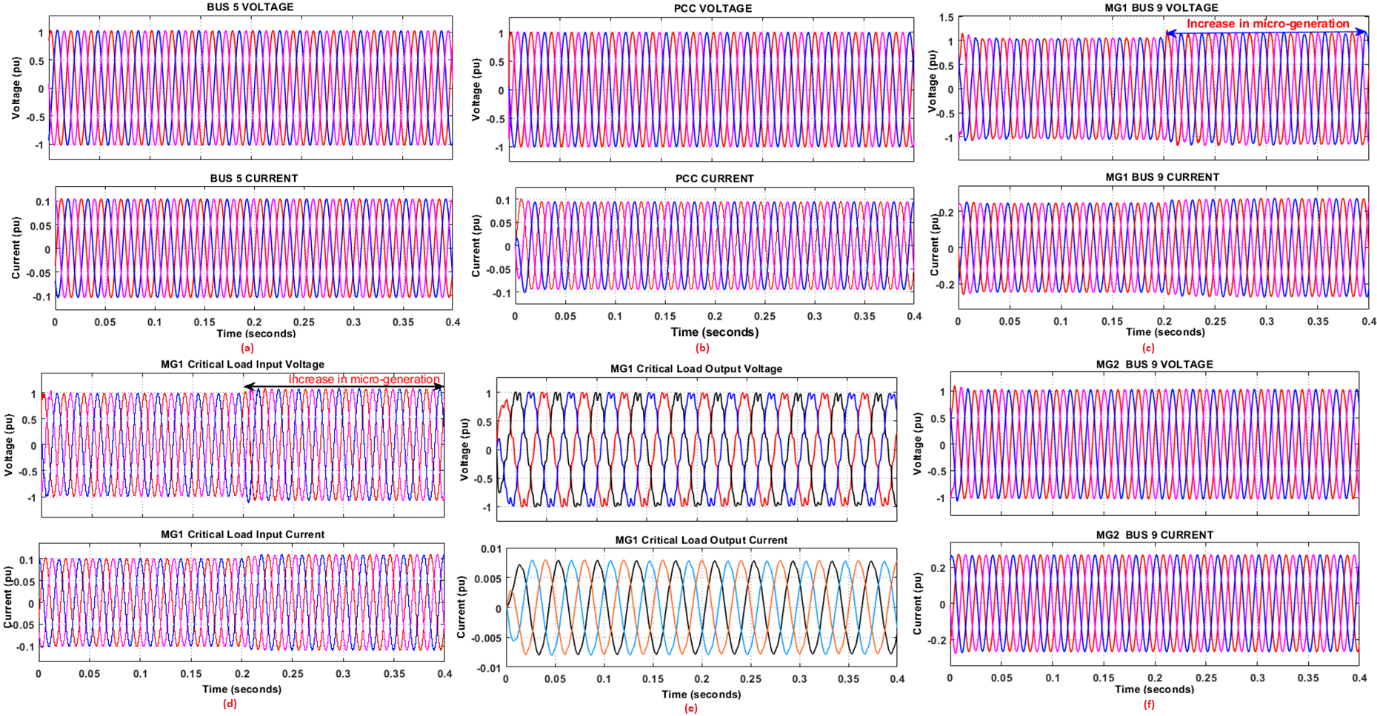
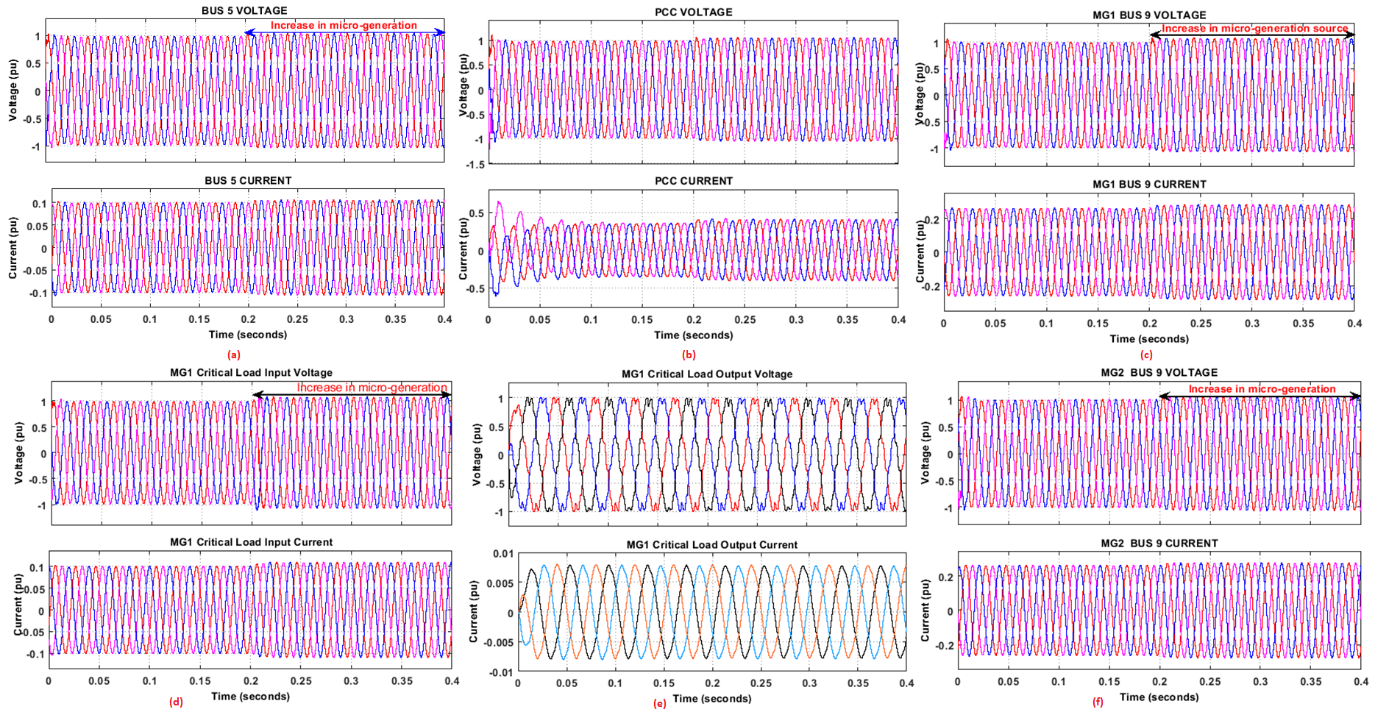
- Case 4: Increase in total power generation from microgrids
This section discusses the sudden increase in total power generated by the solar farm in community microgrid 1 with and without the MPPET interface. and show the simulated waveforms.
Figure 25. Increase in wind farm power production simulation waveforms WITH MPPET interface (<b>a</b>) Utility grid voltage and current waveforms (<b>b</b>) PCC voltage and current waveforms (<b>c</b>) MG1 voltage and current waveforms (<b>d</b>) MG1 Critical load input voltage and current waveforms (<b>e</b>) MG1 Critical load output voltage and current waveforms (<b>f</b>) MG2 voltage and current waveforms.
Figure 26. Increase in wind farm power production simulation waveforms WITHOUT MPPET interface (<b>a</b>) Utility grid voltage and current waveforms (<b>b</b>) PCC voltage and current waveforms (<b>c</b>) MG1 voltage and current waveforms (<b>d</b>) MG1 Critical load input voltage and current waveforms (<b>e</b>) MG1 Critical load output voltage and current waveforms (<b>f</b>) MG2 voltage and current waveforms.
The increase in the total power generated from the solar farm in MG1 causes a voltage rise in the community microgrid, as seen in c. The input voltage to the critical load is also affected, but the output voltage of the critical load is not affected due to the HFT-based UPS, as shown in e. The increase in solar farm power production simulation waveforms without the MPPET interface is shown in . The impact of the situation propagates throughout the power system under investigation; voltage rises were observed at t = 0.2 s (a–d,f). However, the scenario did not affect the critical loads’ output voltage because of the HFT-based UPS (e).
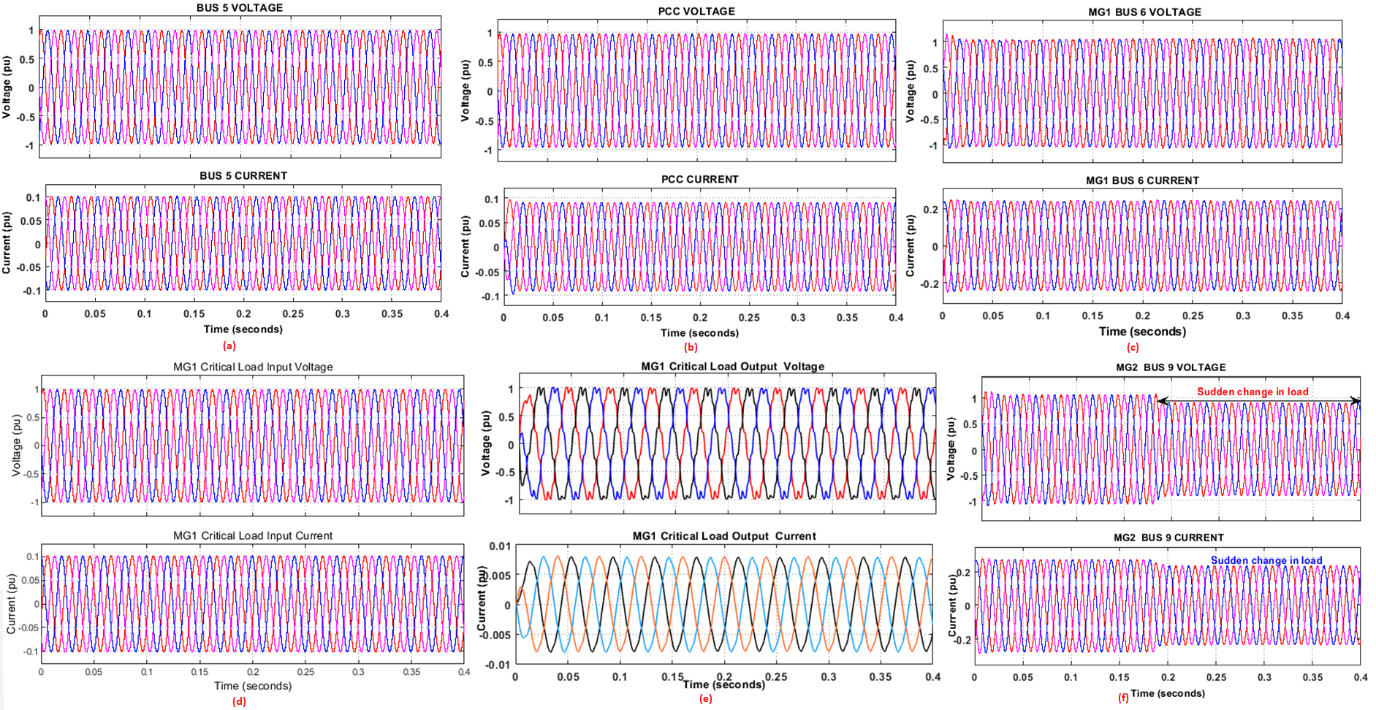
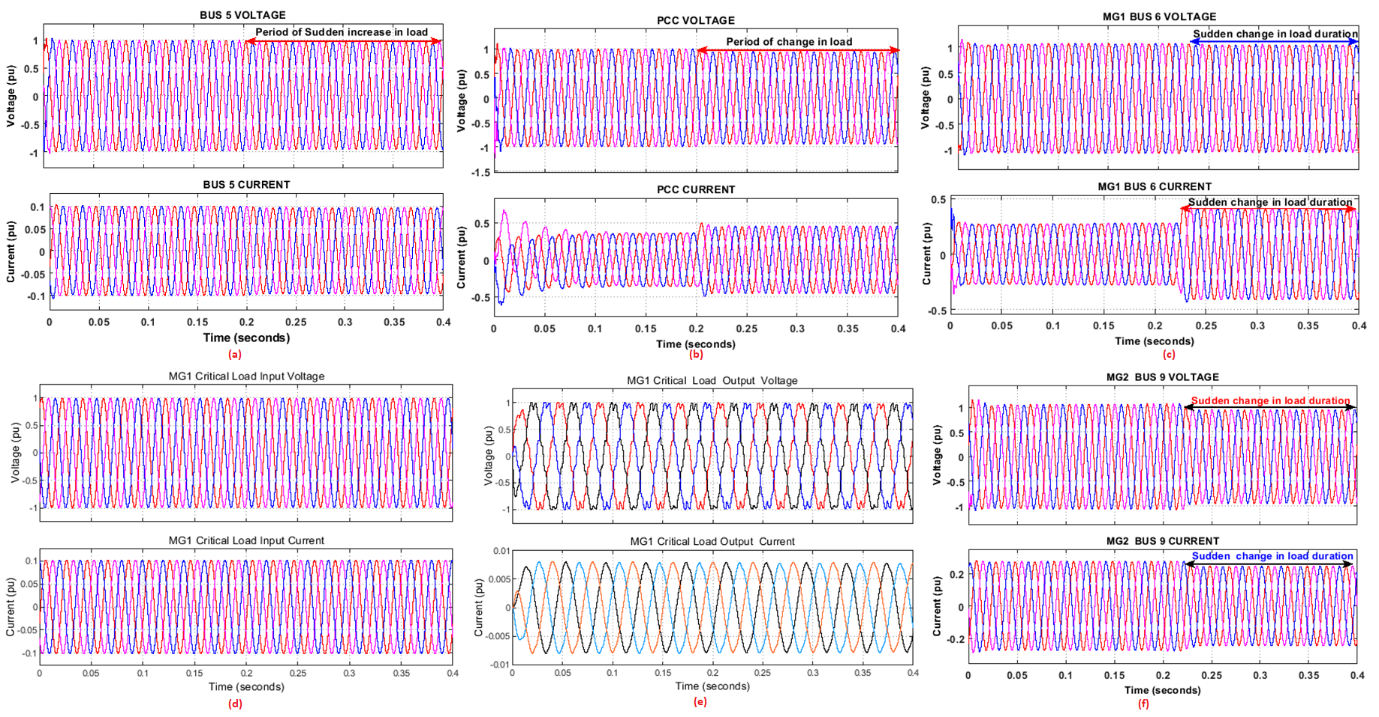
- Case 5: Microgrid Load Variation
In this scenario, the power grid network under investigation’s response to an abrupt increase in power demand from MG2, both with and without the MPPET interface, is examined. The simulation waveforms for the scenario with the MPPET interface are shown in , and the simulation waveforms without the MPPET interface are shown in .
Figure 27. Variation in load simulation waveforms WITH MPPET interface (<b>a</b>) Utility grid voltage and current waveforms (<b>b</b>) PCC voltage and current waveforms (<b>c</b>) MG1 voltage and current waveforms (<b>d</b>) MG1 Critical load input voltage and current waveforms (<b>e</b>) MG1 Critical load output voltage and current waveforms (<b>f</b>) MG2 voltage and current waveforms.
Figure 28. Variation in load simulation waveforms WITHOUT MPPET interface (<b>a</b>) Utility grid voltage and current waveforms (<b>b</b>) PCC voltage and current waveforms (<b>c</b>) MG1 voltage and current waveforms (<b>d</b>) MG1 Critical load input voltage and current waveforms (<b>e</b>) MG1 Critical load output voltage and current waveforms (<b>f</b>) MG2 voltage and current waveforms.
As seen in a–e, the utility, PCC, and MG1 were not affected by the increase in total load due to the isolation ability of the proposed MPPET; only MG2, the source of the increase in load demand, experienced a voltage dip for the period of the increase (f). The increase in load demand simulation waveforms without the MPPET interface is shown in . As can be seen, the impact of the situation propagates throughout the power system under investigation; voltage dips were observed at t = 0.2 s (a–d,f). However, the scenario did not affect the critical loads’ output voltage because of the HFT-based UPS (e).
5. Conclusions
This paper presents a thorough examination and analysis of how a bidirectional MPPET interface affects the stability and power quality of a nested microgrid. Each level of conversion in the proposed power electronic transformer is managed independently, and the system does not require any extra communication infrastructure monitoring. A renewable energy-powered community microgrid with linked loads and critical loads, such as a community health care facility, is built and tested for each operational mode. Simulations with and without the proposed power electronic transformer interface are run to provide an efficient comparative study. The findings in this study illustrate the power electronic transformer’s overall potential to improve power quality and grid stability. The research shows that disturbances on one side of the MPPET do not propagate to the other side due to the proposed MPPET’s isolation capacity. Furthermore, the findings from all tested situations demonstrated that the suggested multiport power electronic transformer improved the system’s smooth transition from one mode of operation to another, such as grid-connected mode to isolation mode. Similarly, the findings of the analysis revealed that the suggested solution reduced the escalation of disturbances throughout the grid, thereby increasing system stability and improving the network’s power quality. Additionally, the suggested bidirectional multiport power electronic transformer is scalable, allowing for the easy integration of new technologies and increasing the penetration of renewable energy-based microgrids. Also, the MPPET may be simply utilized to manage and utilize grid power flow; it can support the integration of various hybrid microgrids with energy storage devices and various types of electrical loads. The model’s bidirectional nature allows it to be utilized for a variety of electric vehicle integrations, including vehicle-to-grid (V2G) and grid-to-voltage (G2V), to improve grid stability. In general, the model contribution is based on the capacity to improve the dependability and stability of electrical distribution networks, regardless of the source of grid disruption. In addition, the model assesses the sustainability of microgrids and distributed generation sources such as solar and wind based on the point of common connection.
Author Contributions
Conceptualization, E.J.A.; Methodology, E.J.A.; Software, E.J.A.; Validation, K.A.O., Formal Analysis, E.J.A.; Investigation, E.J.A.; Resources, K.A.O.; Data Curation, K.A.O.; Writing—Original Draft Preparation, E.J.A.; Writing—Review & Editing, E.J.A.; K.A.O.; Visualization, K.A.O.; Supervision, K.A.O.
Ethics Statement
Not applicable.
Informed Consent Statement
Not applicable.
Funding
This research received no external funding.
Declaration of Competing Interest
The authors affirmed that they did not know any competing financial interests or personal ties that might have appeared to have an impact on the research presented in this study.
References
1.
Katiraei F, Iravani MR. Power Management Strategies for a Microgrid with Multiple Distributed Generation Units.
IEEE Trans. Power Syst. 2006,
21, 1821–1831.
[Google Scholar]
2.
Hatziargyriou ND, Meliopoulos APS. Distributed Energy Sources: Technical Challenges. In Proceeding of the 2002 IEEE Power Engineering Society Winter Meeting. Conference Proceedings (Cat. No.02CH37309), New York, NY, USA, 7–31 January 2002; volume 2, pp. 1017–1022.
3.
Agarwal T, Niknejad P, Rahimnejad A, Barzegaran MR, Vanfretti L. Cyber-physical microgrid components fault prognosis using electromagnetic sensors.
Inst. Eng. Technol. 2019,
4, 173–178.
[Google Scholar]
4.
Jain M, Gupta S, Masand D, Agnihotri G, Jain S. Real-Time Implementation of Islanded Microgrid for Remote Areas.
J. Control Sci. Eng. 2016,
10, 1–9.
[Google Scholar]
5.
Shahgholian G. A brief review on microgrids: Operation, applications, modelling, and control.
Int. Trans. Electr. Energy Syst. 2021,
31, 1–28.
[Google Scholar]
6.
Saeed MH, Fangzong W, Kalwar BA, Iqbal SA. A Review on Microgrids’ Challenges Perspectives.
EEE Access 2021,
9, 166502–166517.
[Google Scholar]
7.
Palizban O, Kauhaniemi K. Microgrid Control Principles in Island Mode Operation. In Proceeding of the 2013
IEEE Grenoble Conference, Grenoble, France, 16–20 June 2013, pp. 1–6.
8.
Shahzad S, Abbasi MA, Ali H, Iqbal M, Munir R, Kilic H. Possibilities, Challenges, and Future Opportunities of Microgrids: A Review.
Sustainability 2023,
15, 6366.
[Google Scholar]
9.
Vidyanandan KV. Grid Integration of Renewables: Challenges and Solutions. In Proceeding of the 2012 IEEE 5th India International Conference on Power Electronics (IICPE), Delhi, India, 6–8 December 2012, pp. 1–6.
10.
Vita V, Fotis G, Pavlatos C, Mladenov V. A New Restoration Strategy in Microgrids after a Blackout with Priority in Critical Loads.
Sustainability 2023,
15, 1974.
[Google Scholar]
11.
Xu Z, Yang P, Peng J, Zeng Z. Analysis on the organization and Development of multi-microgrids.
Renew. Sustain. Energy Rev. 2017,
81, 2204–2216.
[Google Scholar]
12.
Manninin R, Eynard J, Green S. A Survey of Recent Advances in Smart Management of Microgrids and Network Microgrids.
Energies 2022,
15, 7009.
[Google Scholar]
13.
Wenlong M. Power Electronic Converters for Microgrids. In Microgrid and Local Energy Systems; Intech Open: London, UK, 2021; pp. 1–27.
14.
Bian
JY, Qiu GY. The application of power electronic transformer in distribution power
system. In the Proceeding of the 4th International Conference on Information Technology
and Management Innovation (ICTMI 2015), New
Orleans, LA, USA, 15 October 2015, pp. 304–310.
15.
Sun Q, Li Y, Ma D, Zhang Y, Qin D. Model Predictive Direct Power Control of Three-Port Solid-State Transformer for Hybrid AC/DC Zonal Microgrid Applications.
IEEE Trans. Power Deliv. 2022,
7, 528–538.
[Google Scholar]
16.
Atkar DD, Chaturvedi P, Suryawanshi HM, Nachankar PP, Yadeo D. Optimal Design of Solid State Transformer-Based Interlink Converter for Hybrid AC/DC Micro-Grid Applications.
IEEE J. Emerg. Sel. Top. Power Electron. 2022,
10, 3685–3696.
[Google Scholar]
17.
Zeng J, Du X, Yang Z. A Multiport Bidirectional DC-DC Converter for Hybrid Renewable Energy System Integration.
IEEE Trans. Power Electron. 2021,
36, 12281–12291.
[Google Scholar]
18.
Saafan AA, Khadkikar V, El Moursi MS, Zeineldin HH. A New Multiport DC-DC Converter for DC Microgrid Applications.
IEEE Trans. Ind. Appl. 2023,
59, 601–611.
[Google Scholar]
19.
Ferandopulle J, Frang Y, Datta M, Meagahapoa GL. Planning and Operation of Community Microgrids: Technical,
Economic, Policy and Regulatory Aspects; RMIT University Melbourne: Melbourne, Australia, 2023; pp. 1–43.
20.
Aliprantis DC, Lafayette W. Fundamentals of Wind Energy Conversion for Electrical Engineers. School of Electrical and Computer Engineering; Purdue University: West Lafayette, IN, USA, 2024; pp. 1–50.
21.
Priyadarshi N, Padmanaban S, Ionel DM, Mihet-Popa, Azam F. Hybrid PV-Wind, micro-grid development using quasi-Z-source inverter modelling and control-experimental investigation.
Energies 2018,
11, 2277.
[Google Scholar]
22.
Wang C, Zhang Z, Abedinia O, Gholami FS. Modelling and analysis of a microgrid considering the uncertainty in renewable energy resources, energy storage systems, and demand management in the electrical retail market.
J. Energy Storage 2021,
33, 1–13.
[Google Scholar]
23.
Bhandari B, Poudel SR, Lee K, Ahn S. Mathematical Modelling of Hybrid Renewable Energy System: A Review on Small Hydro-Solar-Wind Power Generation.
Int. J. Precis. Eng. Manuf. Green Technol. 2014,
1, 157–173.
[Google Scholar]
24.
Gil-González W, Montoya OD, Garces A. Modelling and control of a small hydro-power plant for a DC microgrid.
Electr. Power Syst. Res. 2019,
180, 106104.
[Google Scholar]
25.
Roddis P, Roelich K, Tran K, Carver S, Dallimer M, Ziv G. What shapes community acceptance of large-scale solar farms? A case study of the UK’s first nationally significant solar farm.
Sol. Energy 2020,
209, 235–244.
[Google Scholar]
26.
Motahhir S, El Ghzizal A, Sebti S, Derouich A. Modelling of Photovoltaic System with Modified Incremental Conductance Algorithm for Fast Changes of Irradiance.
Hindawi Int. J. Photoenergy 2018,
2018, 1–13.
[Google Scholar]
27.
Carlisle JE, Kane S, Solan D, Joe JC. Support for solar energy: Examining sense of place and utility-scale development in California.
Energ. Res. Soc. Sci. 2014,
3, 124–130.
[Google Scholar]
28.
Bartha N, Jovanovica R, Ahzia S, Khaleela MA. PV panel single and double diode models: Optimization of the parameters and temperature dependence.
Solar Energy. Mater. Solar Cells 2016,
148, 87–89.
[Google Scholar]
29.
Yang HJ, Lim SY, Yoo SH. The Environmental Costs of Photovoltaic Power Plants in South Korea: A Choice Experiment Study.
Sustainability 2017,
9, 1773.
[Google Scholar]
30.
Harmon E, Cintuglu MH, De Azevedo R, Akkaya K. The Internet of Microgrids: A Cloud-Based Framework for Wide Area Networked Microgrids.
IEEE Trans. Ind. Inform. 2017,
14, 1262–1274.
[Google Scholar]
31.
Martinez-Velasco JA, Alepuz S, González-molina F. Dynamic average modelling of a bidirectional solid state transformer for feasibility studies and real-time implementation.
Electr. Power Syst. Res. 2014,
117, 143–153.
[Google Scholar]
32.
Alepuz S, González F, Martínez JA. Solid state transformer with low-voltage
ride-through and current unbalanced management capabilities. In Proceeding of
the ECON 2013 39th Anuanl conference of the IEEE Industrial Electronics
Society, Vienna, Australia, 10–13 November 2013; pp. 1278–1283.