Titanium alloys have been extensively used in high-performance and advanced engineering fields like aerospace, marine, military and biomedical due to their excellent and well-balanced properties [
1,
2,
3]. Additionally, the superior properties of the alloys in practical applications are often highly sensitive to their metallurgy quality.
Generally, Vacuum Arc Remelting (VAR), Plasma Arc Melting (PAM), Electron Beam Melting (EBM) and Induction Skull Melting (ISM) are commonly used to prepare the titanium alloys [
4,
5]. However, unavoidable heat loss and significant elemental segregation intensify the preparation cost due to forced water-cooling and repeated melting [
5]. In contrast, Vacuum Induction Melting (VIM) in a refractory crucible has been considered low-cost for the one-time preparation of alloys. It is not only forced water-cooling that can be avoided, but also electromagnetic stirring that can achieve the rapid homogenization of alloy melts [
6,
7]. However, the highly reactive alloy melts will easily react with the refractory to contaminate the alloy melts. Thus, to select a highly stable crucible refractory is the key for the successful use of the VIM method [
8].
Currently, the oxide refractories have been extensively investigated, including MgO, Al
2O
3, ZrO
2, CaO, and Y
2O
3. However, these oxide refractory crucibles are proved to be somewhat problematic in the process of melting titanium alloys [
9,
10]. Among these refractories, only Y
2O
3 refractory has been successfully applied in the investment casting of titanium alloys. However, its application for melting titanium alloys still faces some technical problems due to poor thermal shock resistance [
11,
12]. Recently, the perovskite-structured refractory has attracted widespread attention due to the high thermodynamic stability and high melting points, such as CaZrO
3, SrZrO
3, and BaZrO
3 [
13,
14,
15,
16]. Additionally, the BaZrO
3 refractory has garnered significant attention in numerous studies for melting various types of titanium alloys. For example, Gao et al. prepared TiNi alloys in a BaZrO
3 crucible, which achieved a higher shape memory rate and fatigue life than that prepared using a graphite crucible [
17]. In addition, laboratory-grade TiAl alloys were prepared using the BaZrO
3 crucible in comparison with the Al
2O
3 and MgO crucibles, respectively. It revealed that the BaZrO
3 refractory caused the least contamination to the alloy melt [
18]. Furthermore, a pilot-scale preparation of TiAl alloys was also achieved by using home-made 25 kg BaZrO
3 crucible [
19]. However, Chen et al. presented that the stability of the BaZrO
3 crucible was insufficient during the melting of Ti-rich alloys [
20]. Therefore, improving the stability of BaZrO
3 crucibles is necessary to expand their application in the preparation of titanium alloys.
Researchers have reported that the stability of BaZrO
3 refractory could be significantly improved by doping Y ions. Chen et al. compared the melting performance of BaZrO
3 and Y-doped BaZrO
3 crucibles in contact with the TixNi alloy melts, and confirmed that the Y-doped BaZrO
3 refractory exhibited superior erosion resistance to the alloy melts [
21]. Also, a similar experimental result was obtained by Kang’s study [
22]. In addition, considering the high-temperature stability of Y
2O
3 refractory, and the Y-doped BaZrO
3 solid solution phase, it could be generated by mixing and sintering the Y
2O
3 and BaZrO
3 composite refractory. Chen et al. presented that the BaZrO
3-Y
2O
3 two-phase refractory exhibited good stability. The performance for melting TiAl alloys had revealed that it had a better stability than that of the pure Y
2O
3 refractory [
23]. However, due to the inadequacy of Ti activity in TiAl alloys, the advantage of the BaZrO
3-Y
2O
3 two-phase crucible for melting Ti-rich alloys could not be fully reflected. Subsequently, Hou et al. [
24] used the same BaZrO
3-Y
2O
3 two-phase crucible for melting Ti
2Ni alloy with higher Ti activity. The results preliminarily demonstrated that the BaZrO
3-Y
2O
3 two-phase crucible exhibits better erosion resistance compared to the BaZrO
3 crucible. However, the effects of different content of Y
2O
3 additions on the phase composition and microstructure of BaZrO
3-Y
2O
3 two-phase crucible have not been investigated. The impact of Y
2O
3 addition on Ti
2Ni alloy is also unknown, such as the content of inclusions. Therefore, it is necessary to further investigate the performance of BaZrO
3-Y
2O
3 two-phase crucibles with different Y
2O
3 additions for melting Ti-rich alloys.
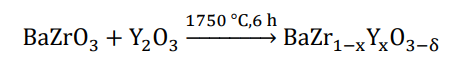
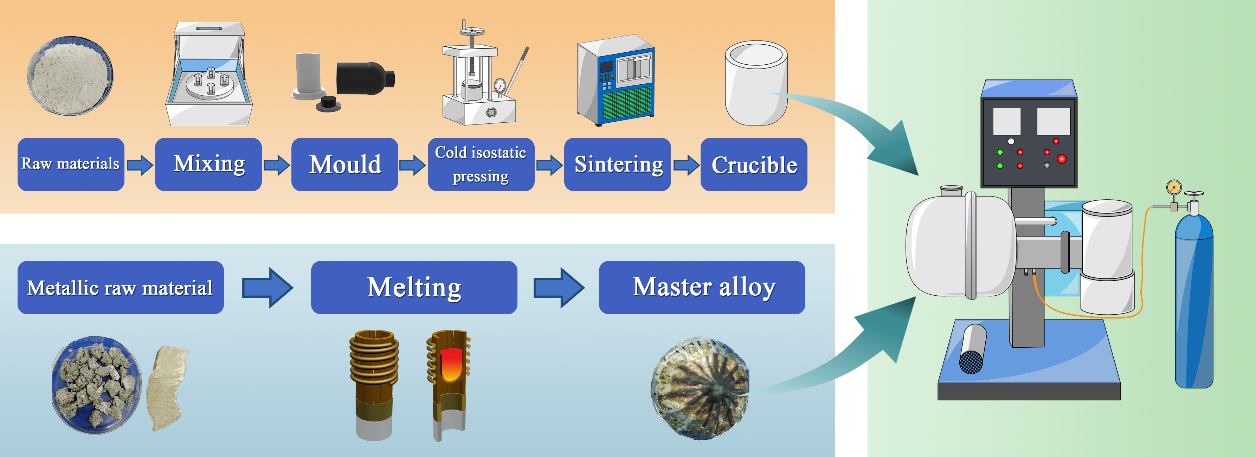
In this paper, the BaZrO
3-Y
2O
3 two-phase crucibles with different content of Y
2O
3 additions were prepared, and their phase composition and microstructure were further investigated. The interaction of BaZrO
3-Y
2O
3 two-phase crucibles with Ti-rich Ti
2Ni alloys was studied in comparison with the pure BaZrO
3 and Y
2O
3 crucibles. This study was devoted to obtaining high-quality Ti
2Ni alloy ingot to lay the foundation for the preparation of A
2B-type Ti
2Ni hydrogen storage materials.
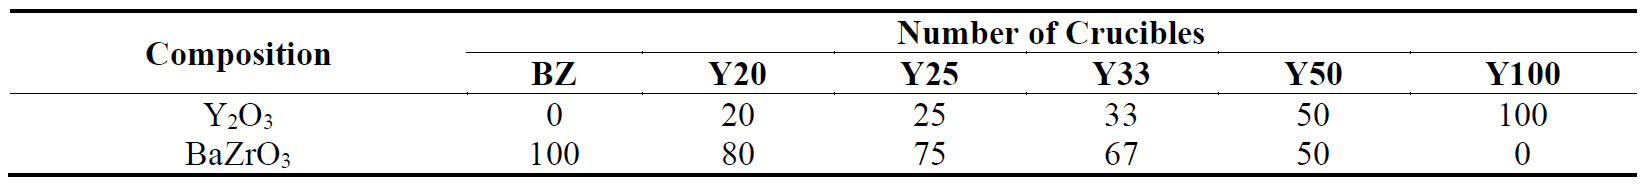
3.1. Phase and Microstructure Analysis of the Crucibles
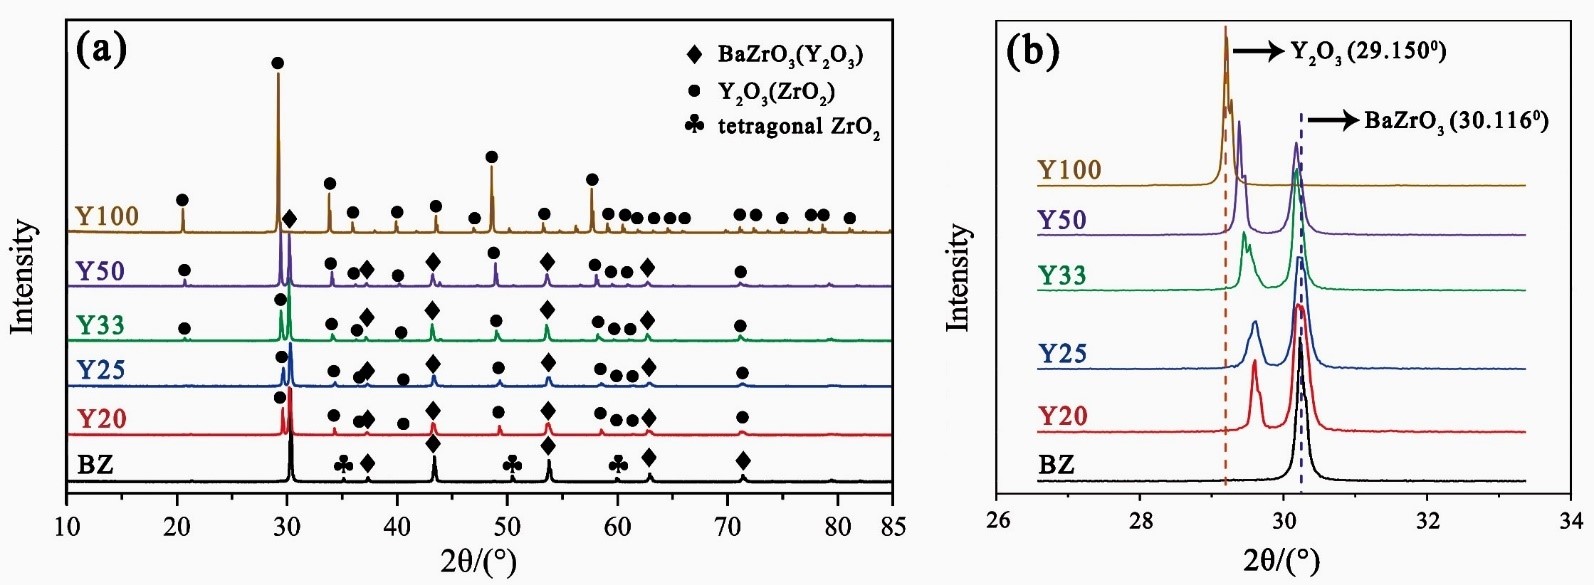
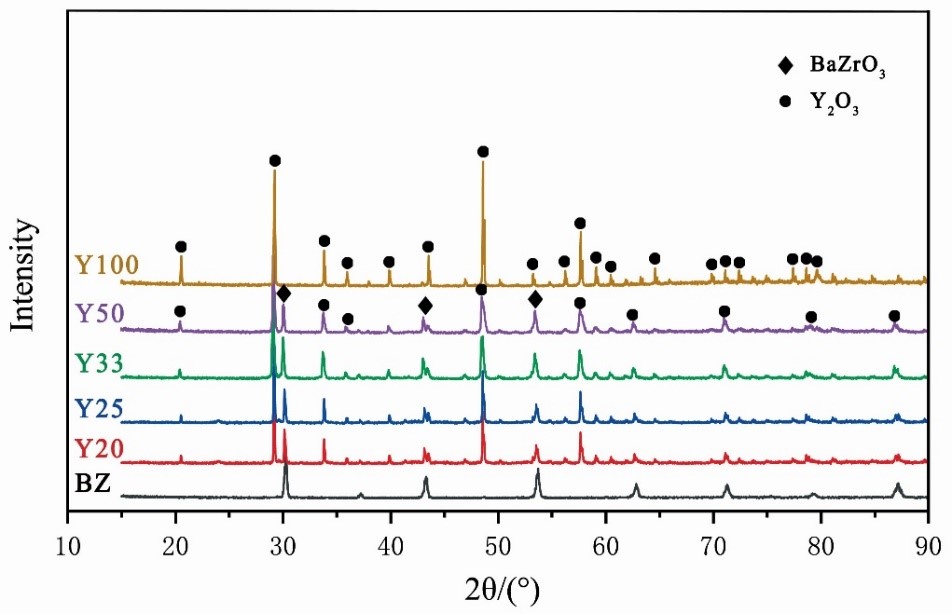
shows the XRD patterns of BZ~Y100 crucibles after sintering. As can be seen in a, the BZ crucible consisted of cubic BaZrO
3 (ICDD PDF# 00-006-0399) and tetragonal ZrO
2 (ICDD PDF# 00-080-2155) phases. Our previous study [
23] revealed that the volatilization of BaO during the preparation of BaZrO
3, resulted in the residual of the second phase ZrO
2. When the adding amount of Y
2O
3 addition ranged from 20~50 wt.% (Y20~Y50), the ZrO
2 phase disappeared. In addition, these crucibles consisted of BaZrO
3 and cubic Y
2O
3 (ICDD PDF# 00-043-1036), respectively. From b, it can be seen that the characteristic peaks of BaZrO
3 and Y
2O
3 were shifted to lower and higher angles in the Y20~Y50 crucibles, respectively. It is because Zr
4+ (0.72 Å) ions in BaZrO
3 crystal lattice were partially replaced by Y
3+ (0.90 Å) ions, and Y
3+ ions in Y
2O
3 crystal lattice were partially substituted by Zr
4+ ions, which could be further verified using the following formulae [
25]:
where
d is the interplanar spacing; λ is the X-ray wavelength;
a is the lattice constant of the cubic structure;
h,
k and
l are the Miller indices corresponding to the diffraction peak. Combining Equations (1) and (2) shows that the substitution of Y
3+ ions for Zr
4+ ions led to an increase in the lattice constant
a, and an accompanying increase in the interplanar spacing
d, which finally resulted in a decrease in
θ, i.e., a leftward shift of diffraction peak. The space group of cubic BaZrO
3 is Pm-3m, and Ba
2+ ions with coordination number 12 and Zr
4+ ions with coordination number 6 correspond to ionic radii of 1.61 Å and 0.72 Å, respectively [
26]. The space group of cubic Y
2O
3 is Ia-3, and the ionic radius corresponding to Y
3+ ions with coordination number 6 is 0.90 Å [
26]. The relative ionic radius difference between Zr
4+ and Y
3+ ions is about 13%, which is less than 15%, indicating that they can be substituted for each other [
27].
. (<b>a</b>) XRD patterns of all crucibles after sintering; (<b>b</b>) magnified pictures over the 2<i>θ</i> ranges of 28~32° showing Y<sub>2</sub>O<sub>3</sub> and BaZrO<sub>3</sub> peaks.
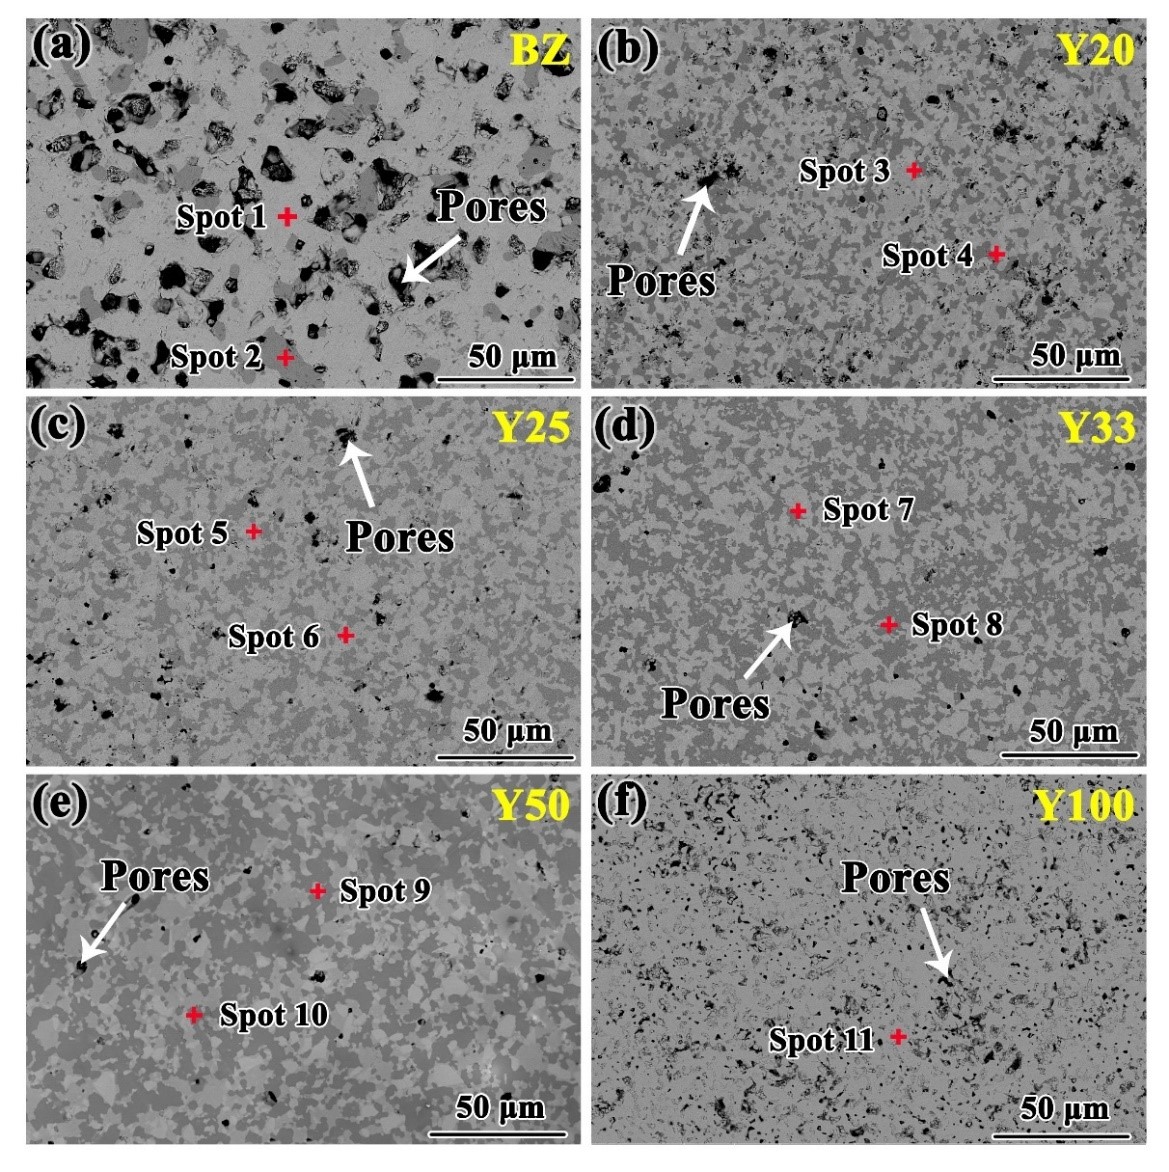
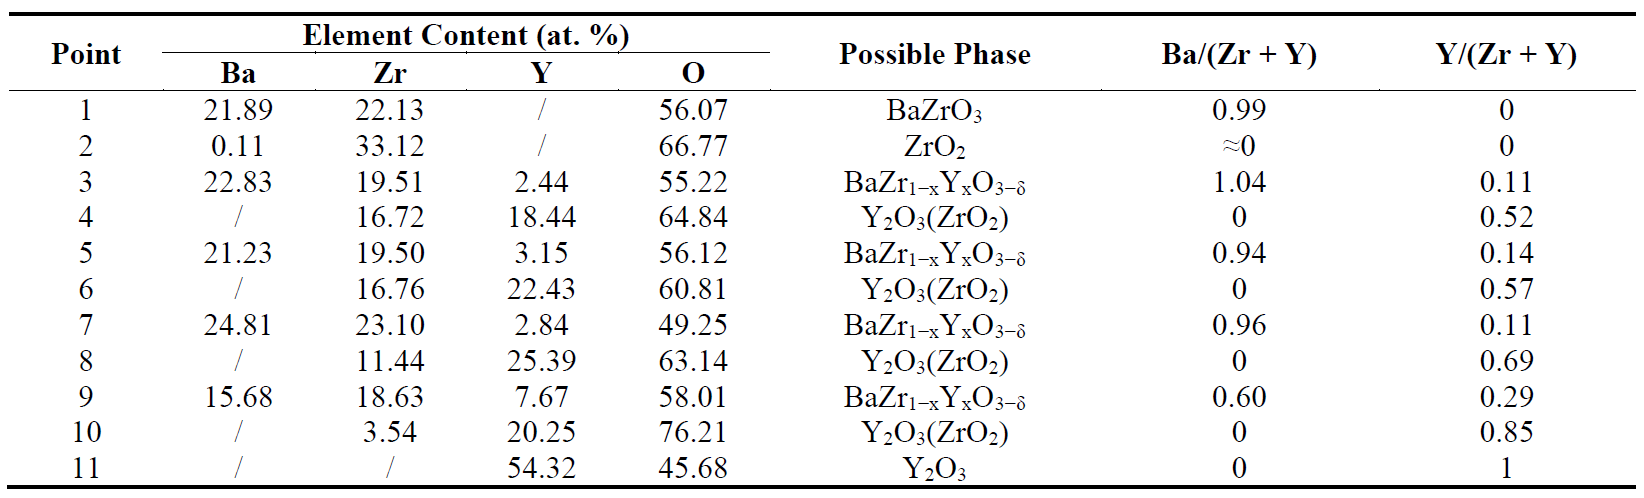
shows the inner microstructure of BZ~Y100 crucibles after grinding and polishing. From a, it can be seen that the BZ crucible consisted of light gray (spot 1) and gray (spot 2) substances with the appearance of some pores, respectively. EDS results in indicated that spots 1 and 2 were BaZrO
3 and ZrO
2 phases, respectively. After adding 20 wt.% Y
2O
3 into BaZrO
3 (Y20 crucible, b), the amount of gray substance (spot 4), which was dispersed throughout the crucible matrix, exhibited a significant increase trend and became Y
2O
3 with ZrO
2 in solid solution. EDS results indicated spots 3 and 4 were BaZr
1−xY
xO
3−δ and Y
2O
3(ZrO
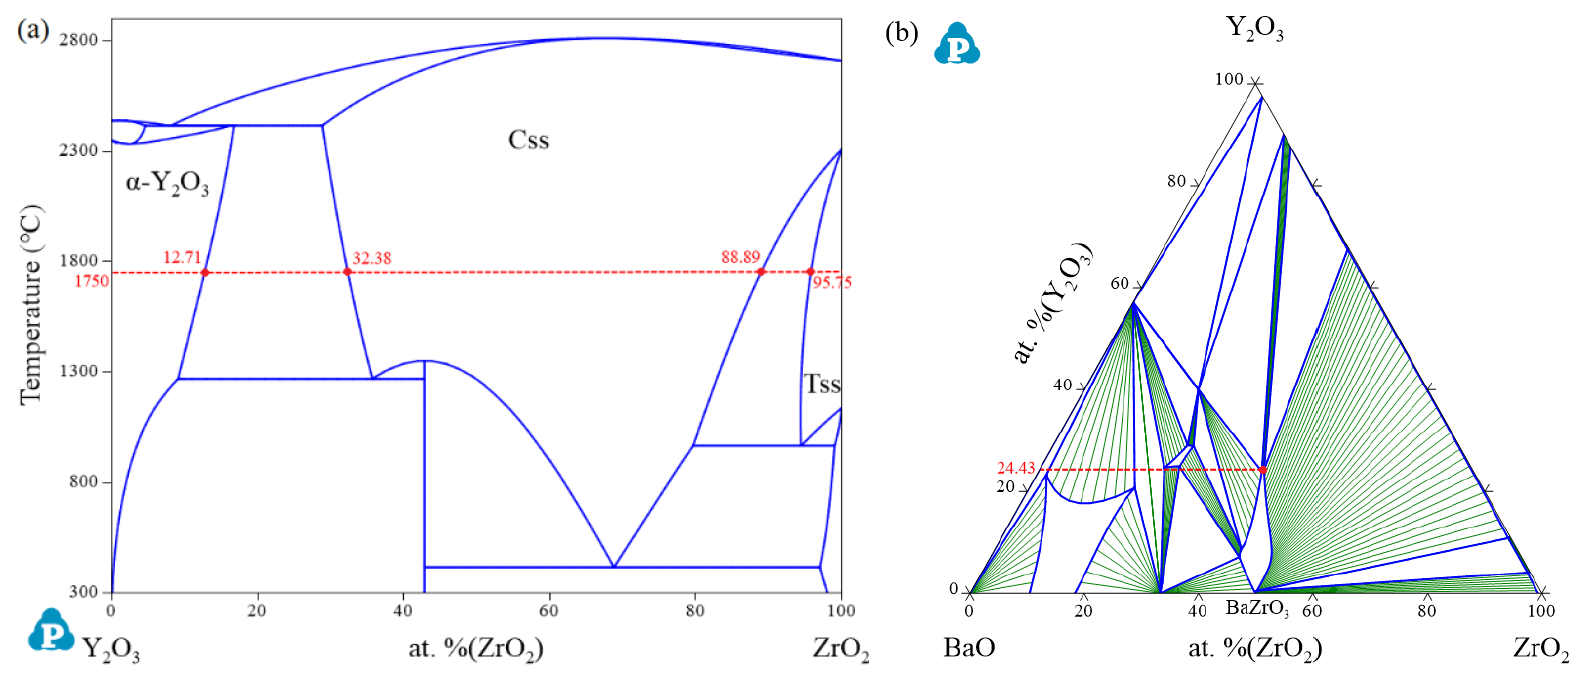
2), respectively. According to the phase diagram of ZrO
2-Y
2O
3 system [
28] shown in a, at 1750 °C, the solubility limit of ZrO
2 in cubic Y
2O
3 is 12.71 at. % (atomic percent) and the solubility limit of Y
2O
3 in tetragonal ZrO
2 is 4.25 at. %. At the same time, the cubic solid solution formed by cubic ZrO
2 and cubic Y
2O
3 ranges from 11.11 at. % to 67.62 at. %. The values of Y/(Zr + Y) (spots 4, 6, 8, and 10) in are basically consistent with calculated results in a. According to the isothermal section of the BaO-ZrO
2-Y
2O
3 system [
28] at 1750 °C (b), the solubility limit of Y
2O
3 in BaZrO
3 is 24.43 at. %. The values of Ba/(Zr + Y) and Y/(Zr + Y) (spots 3, 5, and 7) in are fully consistent with calculated results in b. For the EDS results of spot 9, the values of Ba/(Zr + Y) and Y/(Zr + Y) differ significantly from other results (spots 3, 5, and 7), which is considered to be due to measurement errors. It was caused by the solid solution of Y
2O
3 into BaZrO
3 and ZrO
2 into Y
2O
3, which was consistent with the shifts of observed characteristic peaks in b. In addition, through comparison, it can be found that the number of pores in b is significantly less than that in a. Apparently, the Y
2O
3 addition had two obvious effects. One was to consume the ZrO
2 phase in the crucible, leading to the formation of a more stable Y
2O
3(ZrO
2) phase according to the solid solution effect [
24]. The other was to increase the densification of the crucible due to the effect of solid solution sintering. As the amount of Y
2O
3 addition increased from 25~50 wt.% (Y25~Y50 crucibles), the different grains were evenly distributed, and the Y
2O
3(ZrO
2) phase obviously increased with the growth of Y
2O
3 additions, as shown in c–e. In addition, the number of pores in crucibles was further decreased, indicating that an increased amount of Y
2O
3 addition could continue to improve the densification of BaZrO
3-Y
2O
3 two-phase crucibles. From f, it can be seen that only Y
2O
3 phase (spot 11) could be observed, and a large number of pores were dispersed in the Y100 crucible. The solid solution between Y
2O
3, ZrO
2 and BaZrO
3 during sintering could be described as follows:
. SEM pictures (BSE mode) of bottom wall of all crucibles after grinding and polishing: (<b>a</b>) BZ crucible; (<b>b</b>) Y20 crucible; (<b>c</b>) Y25 crucible; (<b>d</b>) Y33 crucible; (<b>e</b>) Y50 crucible; (<b>f</b>) Y100 crucible.
. (<b>a</b>) Calculated phase diagram of ZrO<sub>2</sub>-Y<sub>2</sub>O<sub>3</sub> system (Css---Cubic structure solid solution; Tss---Tetragonal structure solid solution) [
28]; (<b>b</b>) Calculated isothermal section of BaO-ZrO<sub>2</sub>-Y<sub>2</sub>O<sub>3</sub> system at 1750 °C [
28].
. EDS results of points 1~11 shown in .
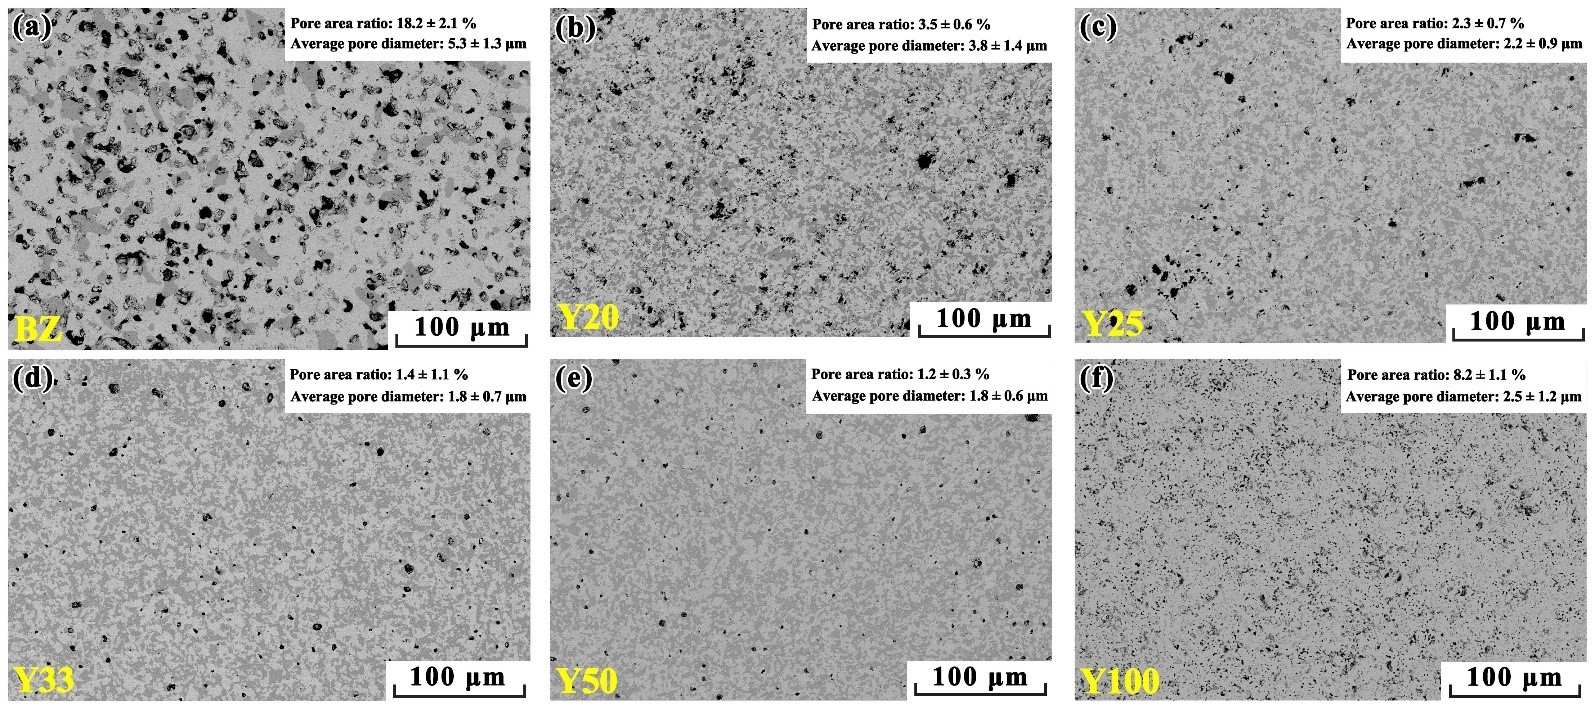
To further investigate the effect of Y
2O
3 additions on the sintering behavior of BaZrO
3-Y
2O
3 two-phase crucibles, ImageJ software was used to analyze the percentage of pore areas, as shown in . Three pictures of each crucible sample were measured and the average percentage of pore areas was calculated. From a, it can be seen that the percentage of pore areas in BZ crucible reached 18.2 ± 2.1%. It is because the BaZrO
3 refractory with a high melting point (nearly 2650 °C) was difficult to densify at 1750 °C [
23]. Additionally, the presence of ZrO
2 secondary phase partially inhibited the growth of BaZrO
3 grains, leading to the residual of pores. After adding Y
2O
3, from b–e, it can be seen that the percentage of pore area in Y20~Y50 crucibles exhibited a significant decrease trend from 3.5 ± 0.6% to 1.2 ± 0.3%, respectively. The lower porosity could have a good effect to resist the erosion of alloy melts. In the BaO-Y
2O
3 phase diagram [
28], all eutectic reaction temperatures including the liquid phase are greater than 1750 °C. When sintered at 1750 °C, Y
3+ replaces Zr
4+ in BaZrO
3, resulting in oxygen vacancies [
29]. These factors have led to the decrease in the percentage of pore area. For the Y100 crucible, its percentage of pore area also reached 8.2 ± 1.1%, as shown in f. Apparently, the melting point of Y
2O
3 (2410 °C) [
23] was lower than that of BaZrO
3 (2650 °C), indicating that the sintering performance of Y
2O
3 was better than that of BaZrO
3 under the same conditions.
. SEM pictures of the inner of all crucibles and the measured porosity ratio: (<b>a</b>) BZ crucible; (<b>b</b>) Y20 crucible; (<b>c</b>) Y25 crucible; (<b>d</b>) Y33 crucible; (<b>e</b>) Y50 crucible; (<b>f</b>) Y100 crucible.
The phases of the inner surfaces of BZ~Y100 crucibles after the melting of Ti
2Ni alloys were characterized by XRD, as shown in . For the BZ crucible, not only no new phase was observed, but also the disappearance of ZrO
2 characteristic peaks. The glassy phase is possible, but not easily detected by XRD, which is mainly sensitive to crystalline phases. Chen et al. [
30] proposed that the interaction of refractory crucible with Ti melt was caused by physical dissolution of the refractory, it could be confirmed that the Ti
2Ni alloy melt dissolved the ZrO
2 refractory on the surface of the BaZrO
3 crucible. The loose and non-uniform structure of the crucible surface is due to the partial dissolution of the BaZrO
3 refractory. For the Y100 crucible, no new phase was observed compared to the original crucible in a, indicating that the interaction of Ti
2Ni alloy melt with Y
2O
3 crucible did not generate any new crystalline product but a glassy phase may exist. For the Y20~Y50 crucibles after melting, there was no appearance of new interaction product on their surfaces in comparison with the original crucibles in a.
. XRD patterns of the inner surface of all crucibles after the melting of Ti<sub>2</sub>Ni alloys.
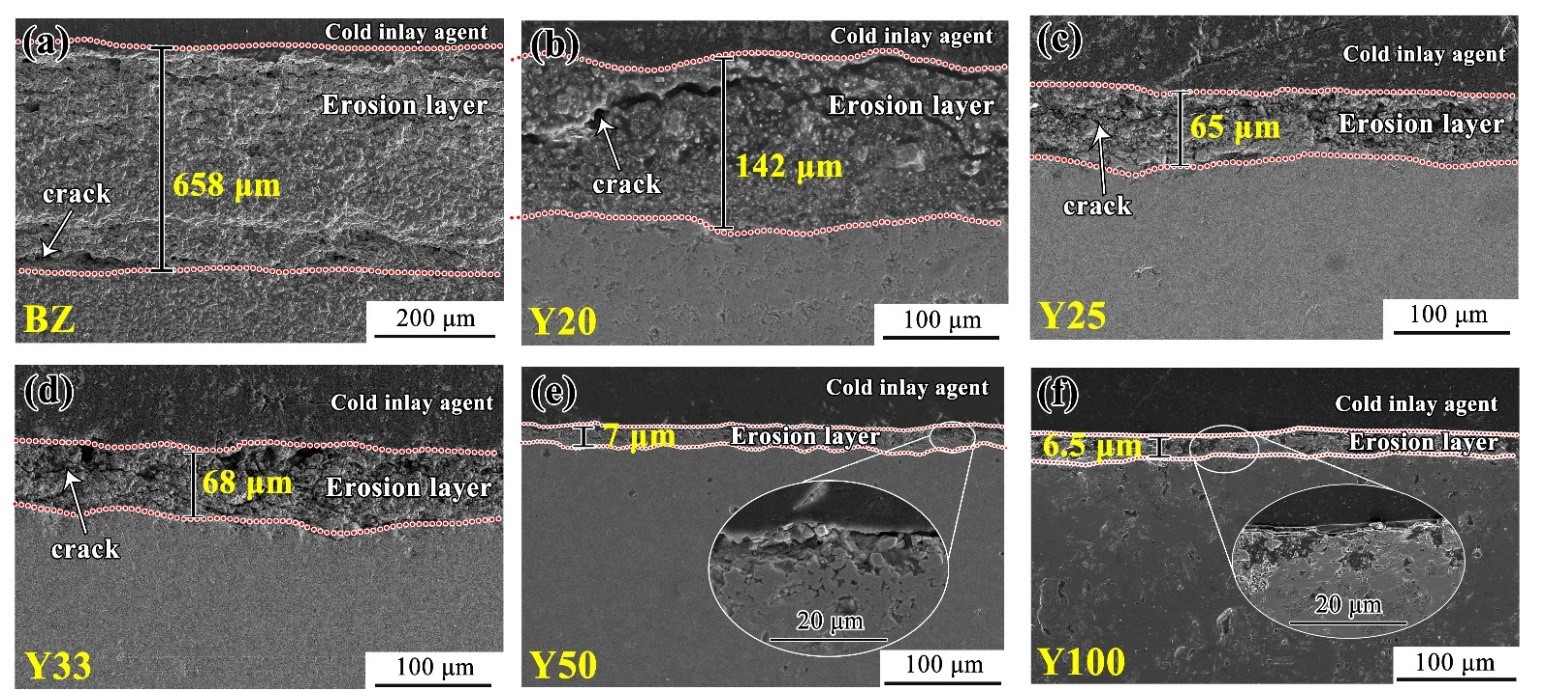
shows the cross-sections of the bottom wall of BZ~Y100 crucibles after melting Ti
2Ni alloys. As shown in a, the internal structure of the BZ crucible was damaged due to the infiltration of alloy melts. The generated thickness of the erosion layer was about 658 μm. For the Y20 crucible, the thickness of the erosion layer had a significant decrease to 142 μm, as shown in b. As the increase of Y
2O
3 content in the BaZrO
3 crucible, the thickness of the erosion layer was further decreased. For Y25~Y50 crucibles (c–e), it ranged from 65 to 7 μm. However, for the Y100 crucible (f), the thickness of the erosion layer was only 6.5 μm.
. SEM pictures of the cross-section of bottom wall of all crucibles after melting Ti<sub>2</sub>Ni alloys: (<b>a</b>) BZ crucible; (<b>b</b>) Y20 crucible; (<b>c</b>) Y25 crucible; (<b>d</b>) Y33 crucible; (<b>e</b>) Y50 crucible; (<b>f</b>) Y100 crucible.
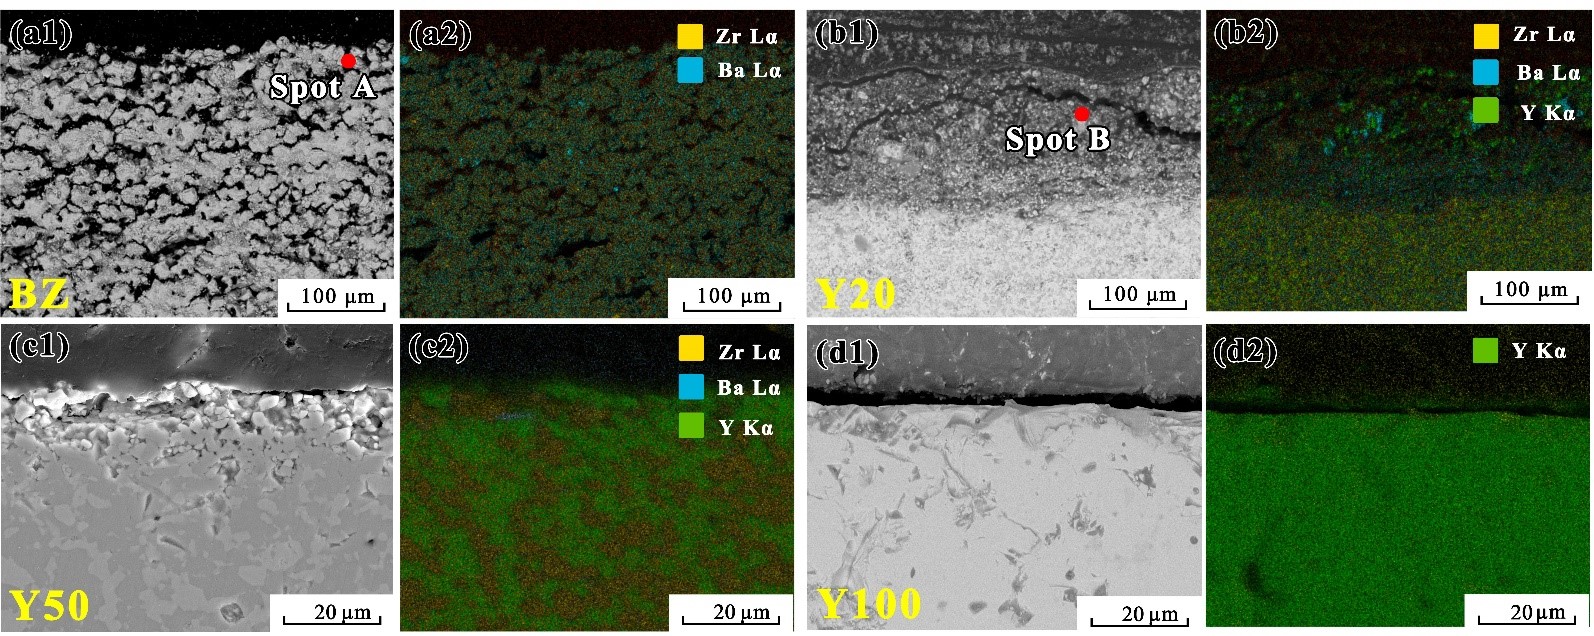
The magnified pictures of the erosion layers of BZ, Y20, Y50, and Y100 crucibles are shown in . From (a1), it can be seen that the erosion layer of BZ crucible exhibited a clear layered structure, which showed a loose and porous phenomenon. The corresponding mapping analysis indicated that only Ba and Zr elements exist in the erosion layer, and there is no residue of alloy melts, as shown in (a2). In addition, the EDS result of spot A () showed that BaO phase was observed. In our previous studies [
23], we had revealed that the decomposition of BaZrO
3 refractory in titanium alloy melts could cause the evaporation of BaO and the Zr and O elements into alloy melts. The same phenomenon was also observed in the melted Y20 crucible, as shown in (b1,b2). In the Y50 crucible ((c1,c2)), the enrichment of BaO disappeared as the decreasing of BaZrO
3 content. In addition, the Zr elements caused by the dissolution of BaZrO
3 would be partially dissolved into Y
2O
3, which will reduce the Zr pollution to the alloy. As can be seen from (d1,d2), the Y100 crucible also did not react with alloy melt and was able to resist the mechanical scouring of alloy melt, indicating that Y
2O
3 refractory has good thermodynamic stability. However, the Y100 crucible has an obvious disadvantage, the Y generated by the dissolution of Y
2O
3 reacts with the O in the alloy melt to generate a large number of oxide inclusions [
31].
. Localized enlargement of the erosion layers of crucibles: (<b>a1</b>) BZ crucible; (<b>a2</b>) the elemental mapping of (a1); (<b>b1</b>) Y20 crucible; (<b>b2</b>) the elemental mapping of (b1); (<b>c1</b>) Y50 crucible; (<b>c2</b>) the elemental mapping of (c1); (<b>d1</b>) Y100 crucible; (<b>d2</b>) the elemental mapping of (d1).
. EDS results of points A and B shown in .
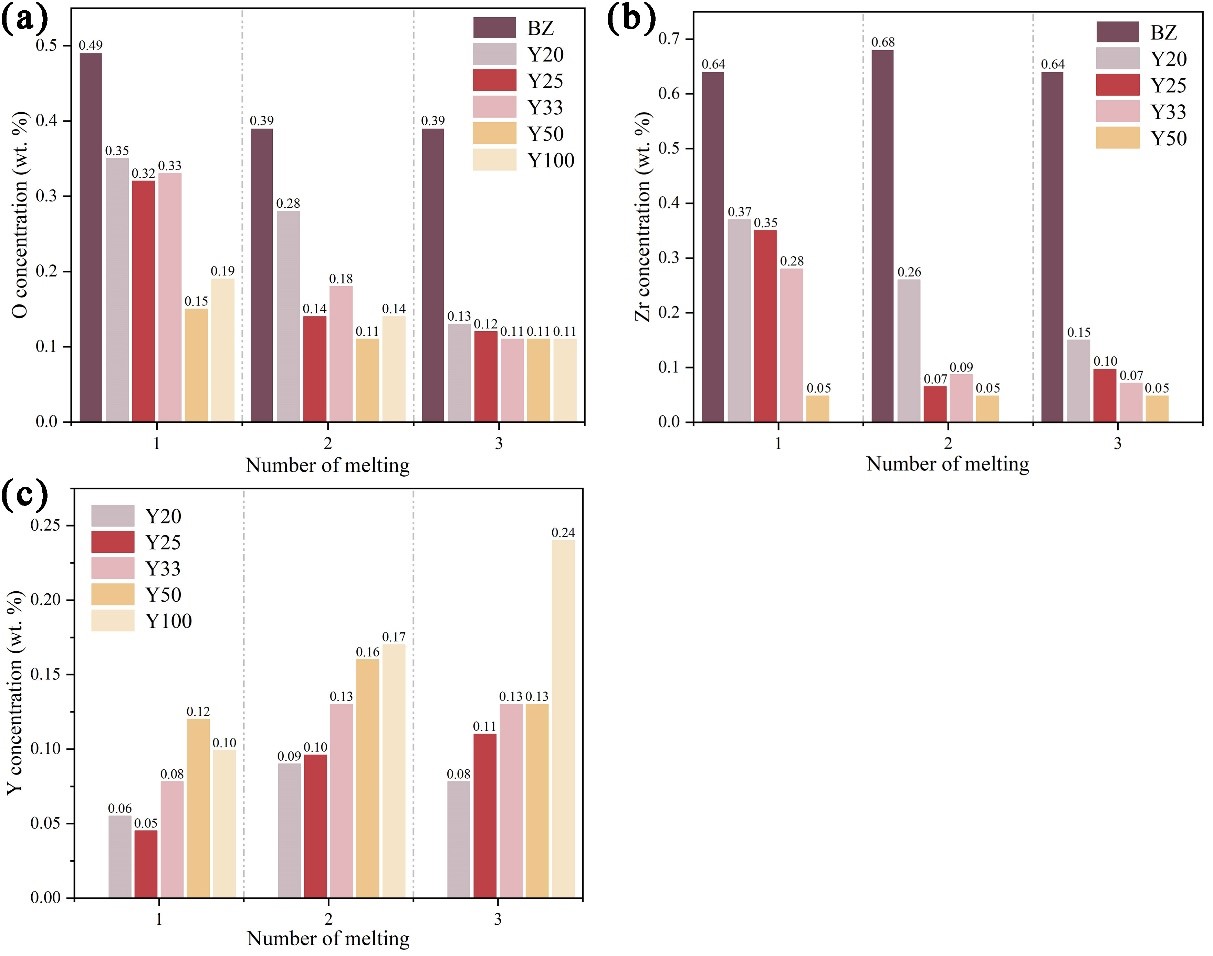
Actually, the purity degree of titanium alloys was an important evaluation criterion for the practical application. shows the number of melted Ti
2Ni alloys using BZ~Y100 crucibles as well as the O, Zr, and Y element concentrations in each alloy. a shows the change trend of O concentration. It can be seen that the O concentration exhibited a decreasing trend as the increase of melting number regardless of the type of crucibles. However, it was more obvious that the BaZrO
3 crucibles with Y
2O
3 addition exhibited a rapid decrease trend for the O concentration. It consisted of the analysis for the erosion layer in and . Especially, the alloy melted in the Y50 crucible, its O concentration was only 0.11 wt.% after third melting, which is basically the same as that of alloy melted in the Y100 crucible. The change trend of Zr concentration is shown in b, it can be seen that the Zr concentration also exhibited the same change trend as the O concentration. After third melting, the Zr concentration in alloy melted with the Y50 crucible was only 0.05 wt.%, which is much lower than 0.64 wt.% in the BZ crucible. This result was in consistent with the analysis of , where the Zr element generated by the dissolution of crucibles was partially solidified into Y
2O
3. From c, the Y concentration in alloy exhibited a clear increasing trend with the increase of Y
2O
3 addition. The Y concentration in alloy melted in the Y100 crucible increases from 0.10 to 0.24 wt.% with the increase in melting times, which is due to the large amount of Y
2O
3 dissolution [
11,
12]. After third melting, the Y concentration in alloy melted in Y20~Y50 crucibles ranged from 0.08 to 0.13 wt.%, and the Y50 crucible with the highest Y concentration was only half of the Y100 crucible. Considering the contamination degree from the three elements, the Y50 crucible clearly showed the best melting performance.
. The O, Zr, and Y element concentrations in Ti<sub>2</sub>Ni alloys after melting for different times using the BZ~Y100 crucibles: (<b>a</b>) O concentration; (<b>b</b>) Zr concentration; (<b>c</b>) Y concentration.
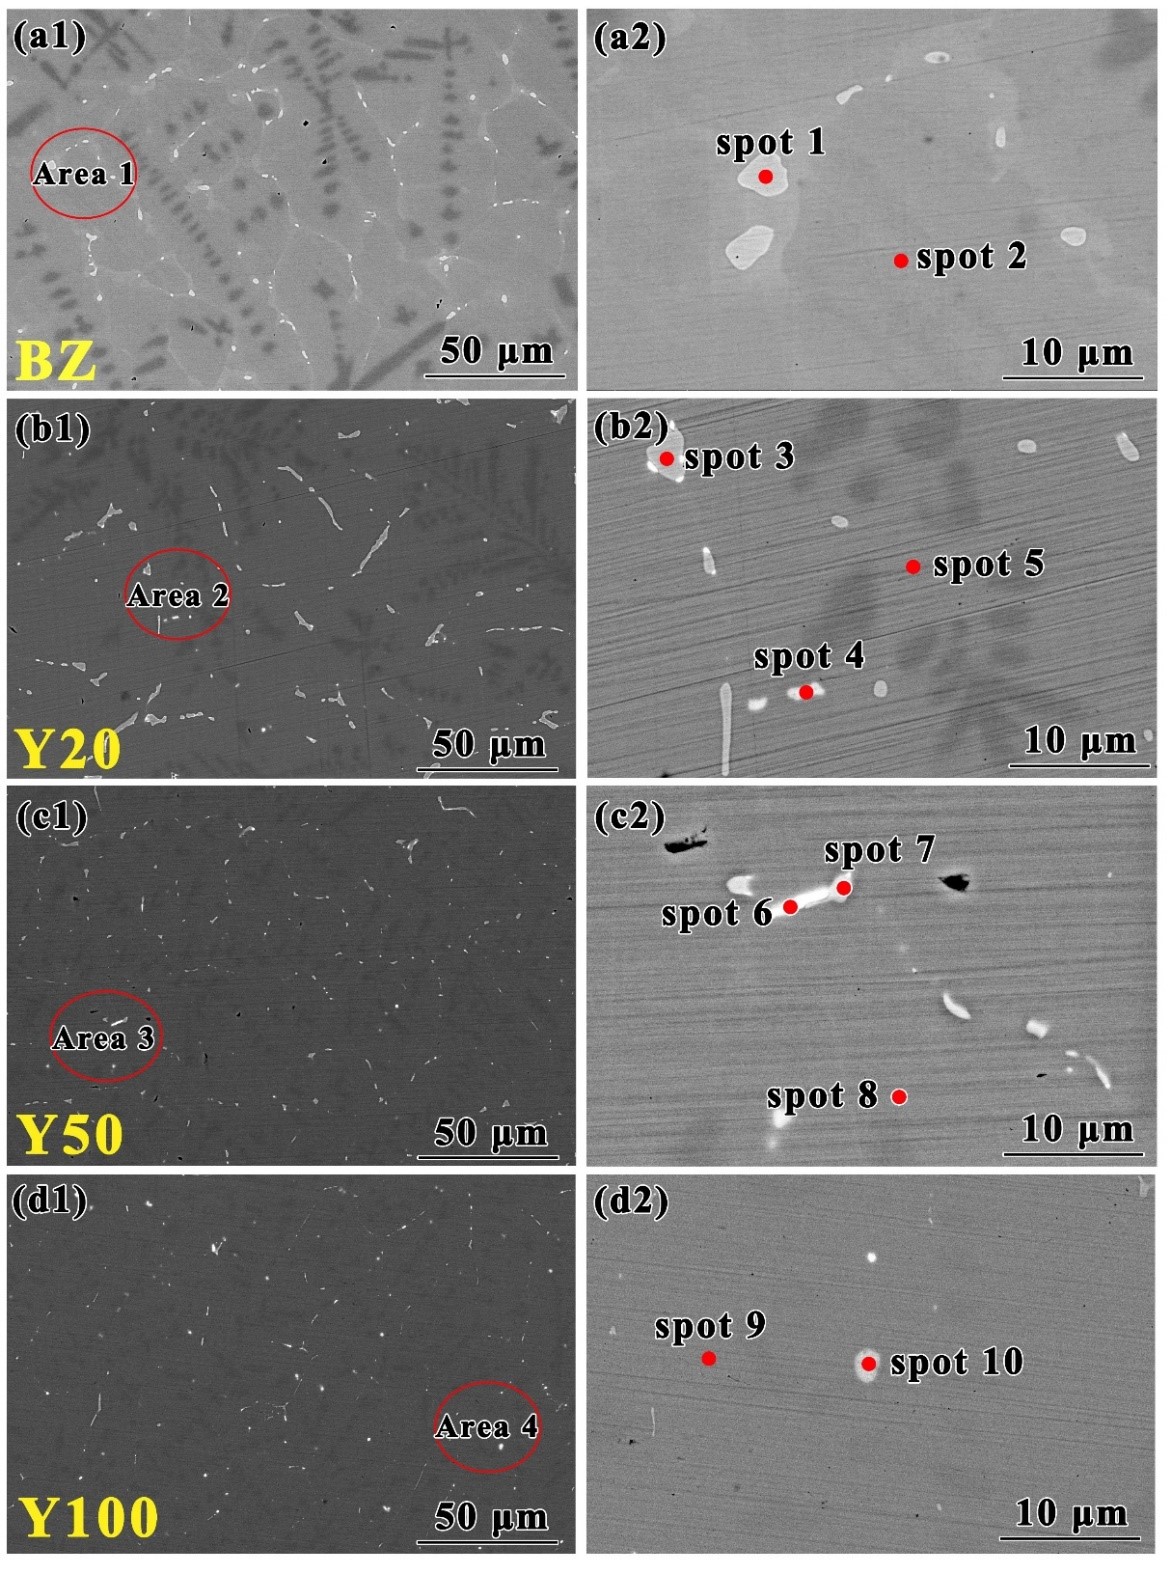
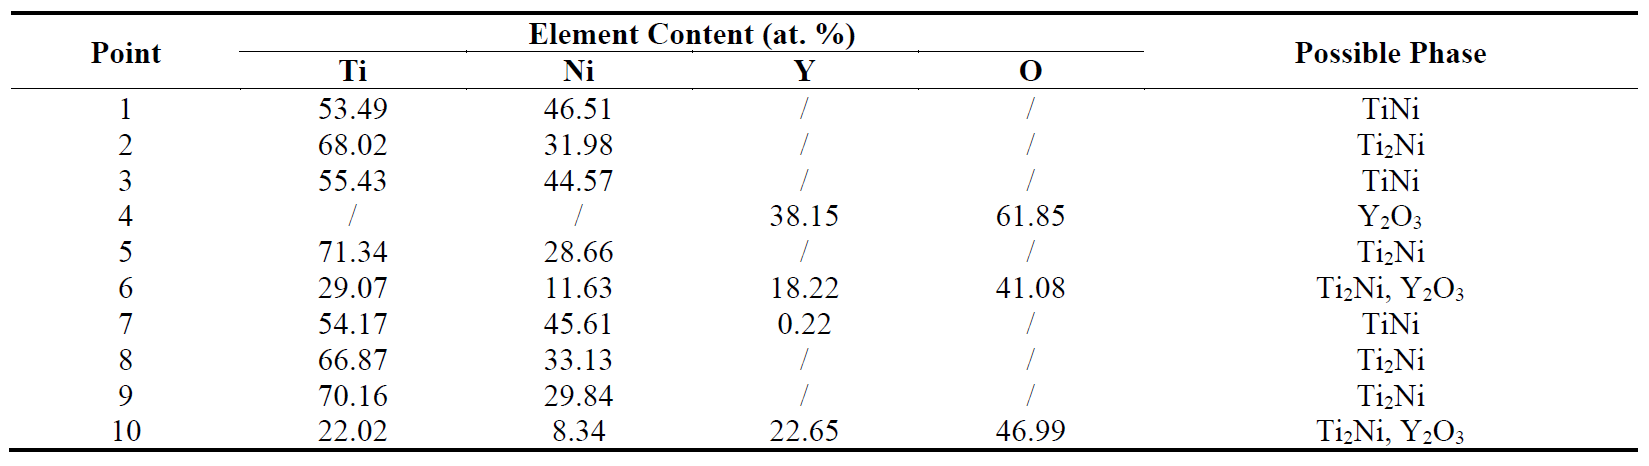
shows the microstructure of alloys for the third melting in BZ, Y20, Y50, and Y100 crucibles. From (a1,a2), the alloy cooled in the BZ crucible contains some gray particles. Combined with EDS results in (spots 1–2), the alloy matrix was Ti
2Ni and the gray particles were residual TiNi. As can be seen in (b1), some gray and white particles appeared in the alloy cooled in the Y20 crucible. The gray particles appeared as long strips with a tendency to break off, and most of white particles were attached around gray particles. Combined with the (b2) and EDS results (spots 3–5) in , the white particles were Y
2O
3, the alloy matrix was Ti
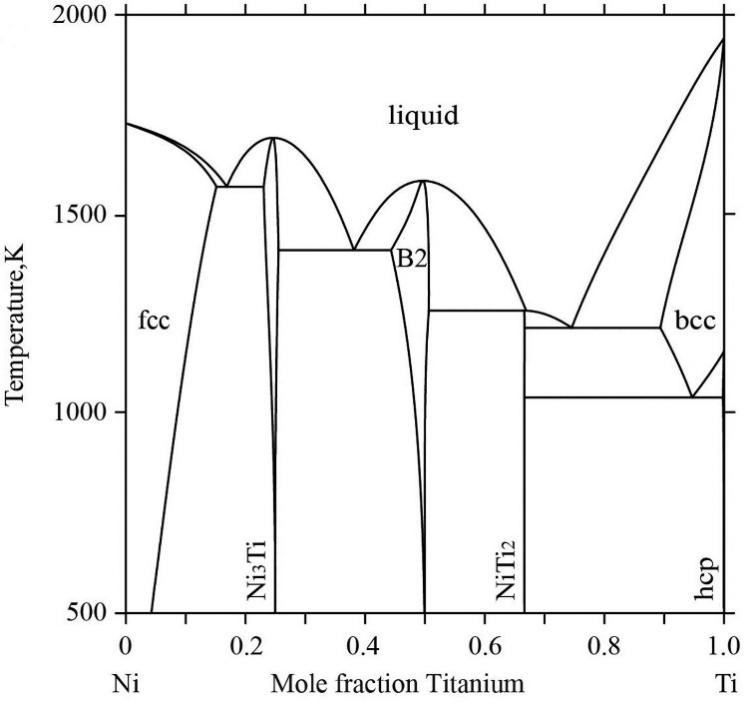
2Ni, which was consistent with the target composition, and the gray particles were residual TiNi. From the Ni-Ti phase diagram () [
32], it can be seen that the Ti
2Ni alloy firstly entered the two-phase region of liquid and TiNi from the liquid-phase region during solidification process, and then underwent the peritectic reaction Liquid + TiNi → Ti
2Ni at 1258 K, and the generated Ti
2Ni was retained until room temperature. It is hypothesized that the peritectic reaction did not occur completely resulting in a small amount of TiNi remaining in solidified Ti
2Ni matrix. From (c1,c2) and EDS results (spots 6–8) in , the same residual TiNi and inclusions Y
2O
3 were present in Ti
2Ni matrix cooled in the Y50 crucible. As the Y
2O
3 content was increased, the residual long strips of TiNi became fewer and finer, while fracture occurred, indicating that Y
2O
3 promoted this peritectic reaction. The amount and morphology of TiNi remaining in the cooled Ti
2Ni matrix in the Y100 crucible ((d1,d2)) was basically the same as that of the Y50 crucible. The presence of Y
2O
3 inclusions was caused by the dissolution of Y
2O
3 refractory in melting process, which was facilitated by the Y100 crucible [
33].
. SEM photographs of the alloys melted in crucibles for the third melting: (<b>a1</b>) in the BZ crucible; (<b>a2</b>) the magnified image of area 1; (<b>b1</b>) in the Y20 crucible; (<b>b2</b>) the magnified image of area 2; (<b>c1</b>) in the Y50 crucible; (<b>c2</b>) the magnified image of area 3; (<b>d1</b>) in the Y100 crucible; (<b>d2</b>) the magnified image of area 4.
. EDS results of points 1~10 shown in .
. The Ni-Ti phase diagram [
32].
From the above analysis, it can be seen that BaZrO
3-Y
2O
3 two-phase crucibles had a certain advantage in comparison with the pure BZ and Y100 crucibles. In particular, the Y50 crucible exhibited the best erosion resistance. In the following, the Y50 crucible was taken as an example to explore the mechanism by which it effectively prevents the erosion of alloy melts. With the addition of Y
2O
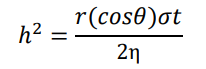
3, the average pore diameter of the crucible gradually decreases, and the Y50 crucible reaches the minimum value (1.8 ± 0.6 μm), as shown in e. On the whole, combined with and , the erosion layer thickness decreased with decreasing average pore diameter, which is consistent with the Washburn model for liquid penetration into a capillary [
34]:
where
h is the erosion layer thickness,
r is the pore radius,
θ is the contact angle,
σ is the surface tension,
t is the interaction time, and η is the alloy melt viscosity. Although the porosity also decreases with the addition of Y
2O
3, the Y50 crucible also reaches the minimum value (1.2 ± 0.3%), the erosion layer thickness of the Y100 crucible with a porosity of 8.2 ± 1.1% is basically the same as that of the Y50 crucible. This showed that the average pore size has more influence on the erosion layer than porosity.
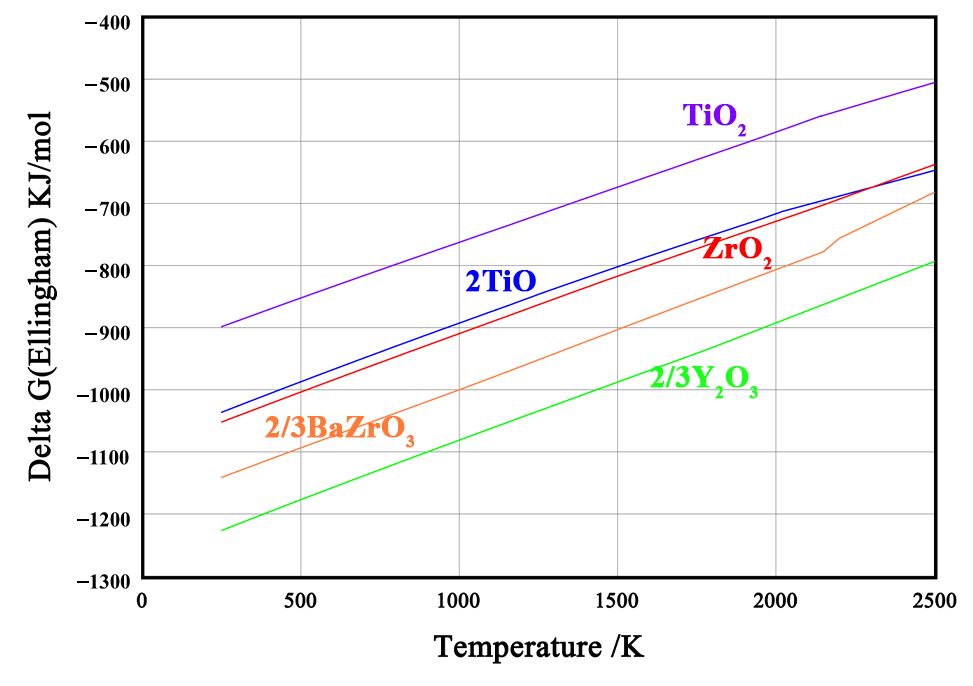
The erosion resistance of crucible was also affected by its thermodynamic stability and thermal shock resistance [
9,
35]. shows the Ellingham diagram of TiO
2, TiO, ZrO
2, BaZrO
3 and Y
2O
3. At the experimental temperature (1600 °C), the thermodynamic stability of ZrO
2, BaZrO
3 and Y
2O
3 was significantly higher than that of TiO
2 and TiO. Therefore, no chemical reaction occurred between BZ~Y100 crucibles and alloy melts, which was consistent with the experimental results. In BaZrO
3-Y
2O
3 two-phase crucibles, the presence of solid solution effects led to a further decrease in the Gibbs free energy of BaZr
1−xY
xO
3−δ and Y
2O
3(ZrO
2) [
23]. Hence, compared to BZ and Y100 crucibles, the Y50 crucible had a higher thermodynamic stability. It should be noted that physical dissolution of crucible refractory was unavoidable due to mechanical scouring of the inner wall of crucible by alloy melts [
36].
. Gibbs free energy of formation of TiO<sub>2</sub>, TiO, ZrO<sub>2</sub>, BaZrO<sub>3</sub> and Y<sub>2</sub>O<sub>3</sub>.
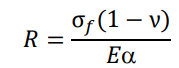
Generally, crucibles with low porosity and high thermal shock resistance would have a long service life. In addition, high thermal conductivity and a low linear expansion coefficient were necessary to obtain high thermal shock resistance [
37]. High thermal conductivity crucibles had smaller thermal gradients, while low linear expansion coefficient crucibles expanded less and deformed more uniformly, thus reducing thermal stresses and preventing the damage of the crucible. The thermal shock resistance of crucibles could be predicted by calculating the thermal stress resistance parameters
R, the following equations [
38,
39]:
where σ
f,
E, α, and ν represent the strength, Young’s modulus, coefficient of linear expansion and Poisson’s ratio, respectively.
R represents the maximum allowable temperature difference. These parameters could be used to evaluate the cracking sensitivity of crucibles after erosion of molten alloys. lists the calculated
R values of BaZrO
3 and Y
2O
3. All data in are derived from Ref. [
9]. The σ
f value is cold modulus of rupture value. The α value ranges from room temperature to 1200 °C. It can be seen that BaZrO
3 and Y
2O
3 possessed similar intrinsic physical properties such as strength, Young’s modulus, coefficient of linear expansion and Poisson’s ratio. Therefore, for the Y50 crucible, using the mixing rule, BaZrO
3 and Y
2O
3 were more easily combined with each other. The similar maximum allowable temperature difference (R) ensured that no cracks occurred between BaZrO
3 and Y
2O
3 in the melting process of the Y50 crucible, thus showing a good thermal shock resistance. In conclusion, the excellent thermodynamic stability and thermal shock resistance of the Y50 crucible made it a promising application in VIM of highly reactive titanium alloys.
. Calculated R values of BaZrO3 and Y2O3.
This work was supported by the National Key Research and Development Program (2022YFB3404500), National Natural Science Foundation of China (No. 52104305, 12305374, 52374360 and U2341267). Additionally, we thank the anonymous referee of this paper for their constructive suggestions.
Conceptualization, C.L. (Chonghe Li) and G.C.; Methodology, P.G.; Software, Q.F.; Validation, P.G.; Formal Analysis, E.W.; Investigation, Q.F. and S.D.; Resources, G.C. and H.L.; Data Curation, S.D. and C.L. (Chenxi Liu); Writing—Original Draft Preparation, Q.F.; Writing—Review & Editing, C.L. (Chonghe Li), X.H. and G.C.; Visualization, H.L.; Supervision, E.W.; Project Administration, C.L. (Chonghe Li) and G.C.; Funding Acquisition, C.L. (Chonghe Li) and X.H.
Not applicable.
Not applicable.
This research received no external funding.
The authors declare that they have no known competing financial interests or personal relationships that could have appeared to influence the work reported in this paper.