1. Introduction
Understanding how animals interact with their environment is necessary for wildlife conservation and landscape management [
1,
2]. Landscapes usually consist of a dynamic mosaic of heterogeneous elements, which can vary in terms of their use and selection by different species. It is, therefore, difficult to quantify all important biotic and abiotic factors that can influence habitat selection and to speculate how species perceive their surrounding environment [
3]. Ecological research has shown how key resources such as topography, vegetation, prey, water, and human impact drive the distribution of animals [
4,
5,
6,
7]. However, many endangered species are rare, cryptic, and elusive, making their direct detection and evaluation difficult [
8], particularly if the species of interest lives in a habitat with dense vegetation [
8,
9,
10].
Researchers generally use indirect methods to detect and evaluate species’ distribution characteristics [
11] that have proved to be cost effective, repeatable, and objective; these include counts of ungulate dung piles, carnivore scats, nests, and tracks [
12,
13]. Camera trapping is a common survey method capable of producing large amounts of data on the activity, distribution, density, and abundance of multiple mammal species [
14,
15,
16,
17,
18]. Aside from their use of documenting species presence, camera traps also allow researchers the ability to determine species occupancy and habitat use [
5,
19,
20]. Sign surveys based on occupancy sampling design can be implemented, covering areas from small habitat patches to entire countries [
21]. Sign surveys only require the collection of detection and non-detection data, which can often be achieved with low cost and effort compared to demographic data [
22]. Because a simple record of detection or non-detection of a species during an individual survey is the only data requirement in the occupancy sampling approach, occupancy estimation has been suggested as an efficient approach for assessing population status and habitat associations for cryptic, low-density species over large spatial scales [
23,
24,
25].
Coexistence between tigers (
Panthera tigris) and leopards (
Panthera pardus) likely depends on resource competition and spatial-temporal dynamics moderated by anthropogenic activities. For example, leopards may compete with tigers for prey resources in western Thailand [
26], potentially reducing tiger density in some locations due to high leopard density and sambar deer (
Cervus unicolor) consumption. Leopards and tigers are associated with habitats containing prey species like red muntjac (
Muntiacus vaginalis) and Eurasian wild pig (
Sus scrofa) but tigers prefer areas with gaur (
Bos gaurus), Eurasian wild pig, and sambar [
27]. However, in the Terai region of southwest Nepal, tigers and leopards coexist in a prey-rich area without relying on diet partitioning, suggesting a major role in spatial and temporal partitioning [
28]. Interestingly, interference competition, not competition for food, apparently limits the distribution of leopard populations in Bardia National Park, Nepal, where tigers prefer medium-sized ungulates. Still, leopards consume domestic animals, small mammals, and birds [
29]. Moreover, leopards prey on livestock more frequently in areas of coexistence with tigers, with higher rates when tigers are absent and lower rates when tigers are present [
30]. A study in the Terai Arc Landscape, Nepal, showed that species interaction decreased as the size of protected habitats increased. At the same time, leopard occupancy declined in sites with relatively more tigers [
31]. Also, the prey index was substantially lower outside of protected areas.. Leopards and tigers co-occurred more strongly in small patches and at low prey indices, indicating potential attraction to the same areas when prey is scarce. Similar to other areas, tiger and leopard co-occurrence in Chitawan National Park, Nepal, was facilitated by prey biomass [
32]. Also, spatial overlap between tigers and leopards can be mitigated by minimization of temporal overlap and confounded by sympatric dholes (
Cuon alpinus) competing with large felid prey [
33].
The variety of circumstances under which tiger and leopard coexistence has been studied has led to these general explanations, e.g., [
26,
27,
28,
33,
34], but the approaches to understanding factors influencing coexistence mechanisms [
35] sometimes limit traditional statistical approaches [
36,
37]. Moreover, confidently estimating coexistence parameters in other areas or projecting patterns related to land use and climate change [
37,
38,
39] relies on having more baseline studies to draw inferences. Therefore, additional research is needed that focuses on consideration of multiple metrics for detecting competition between carnivores [
35], investigation of fine-scale spatial interactions and activity patterns of co-predators [
40], and niche utilization patterns of tigers and leopards [
37]. Studies are also needed in areas where humans and wildlife coexist, such as protected buffer zones [
41], human-dominated habitats [
42], regions unexplored for leopards [
43], and potential habitat corridors [
44]. Here, we use data collected by different means (i.e., camera trap and sign surveys) in Thung Yai Naresuan (East) Wildlife Sanctuary in western Thailand to develop independent tiger and leopard occurrence and distribution models that help depict habitat use. We compare our findings using these different methods and then draw inferences about the species’ coexistence in relation to ecological and human covariates. We believe these environmental and anthropogenic insights are important in augmenting past studies and will help identify priorities for the long-term conservation of sympatric tigers and leopards and their prey.
2. Materials and Methods
2.1. Study Area
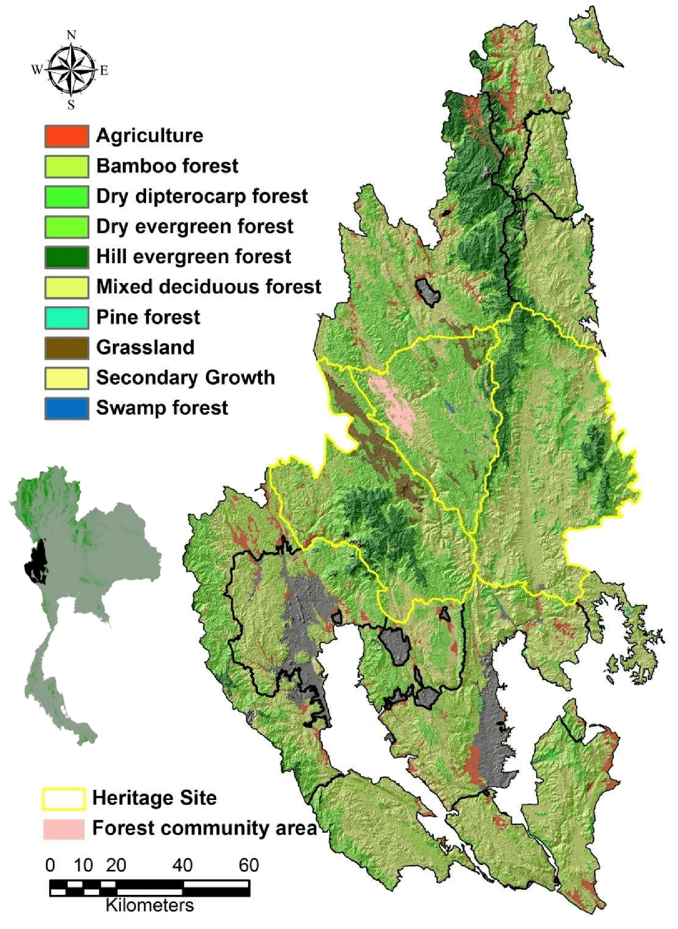
This study was conducted in Thung Yai Naresuan (East) Wildlife Sanctuary in western Thailand, the core area of the 18,700-km
2 Western Forest Complex (), which constitutes Thailand’s largest remaining forest area and is designated as a Natural World Heritage Site [
45,
46]. The area is also a great success in Thailand’s long-lasting efforts to protect the vast forest area against the detrimental effects of national modernization and development [
46,
47].
Figure 1. Location and cover type composition of the Western Forest Complex and, from left to right and outlined in yellow, Thung Yai Naresuan West, Thung Yai Naresuan East, and Huai Kha Kheang Wildlife Sanctuaries, Thailand.
The Sanctuary is characterized by rugged terrain with elevations up to 1811 m. The major habitats are hill evergreen forest, dry evergreen forest, and mixed deciduous forests. [
48,
49]. Annual rainfall varies from 2000 to 2400 mm [
49]. The Sanctuary contains high biological diversity [
50,
51] and is of considerable importance with respect to wildlife conservation, not only in Thailand but also in Southeast Asia [
45]. Ungulate prey species include gaur, sambar, northern red muntjac, Sumatran serow (
Capricornis sumatraensis), and wild boar.
The Sanctuary has been inhabited by the indigenous minority known as “Karen” [
46]. All Karen villages are located in the western part of the Thung Yai Naresuan (East) Wildlife Sanctuary. Households across all villages are subsistence farmers, practicing long-fallow rotational rice, grazing livestock, collecting firewood, and other forest products [
46,
47,
52].
2.2. Field Data Collection
2.2.1. Camera Trap Sampling
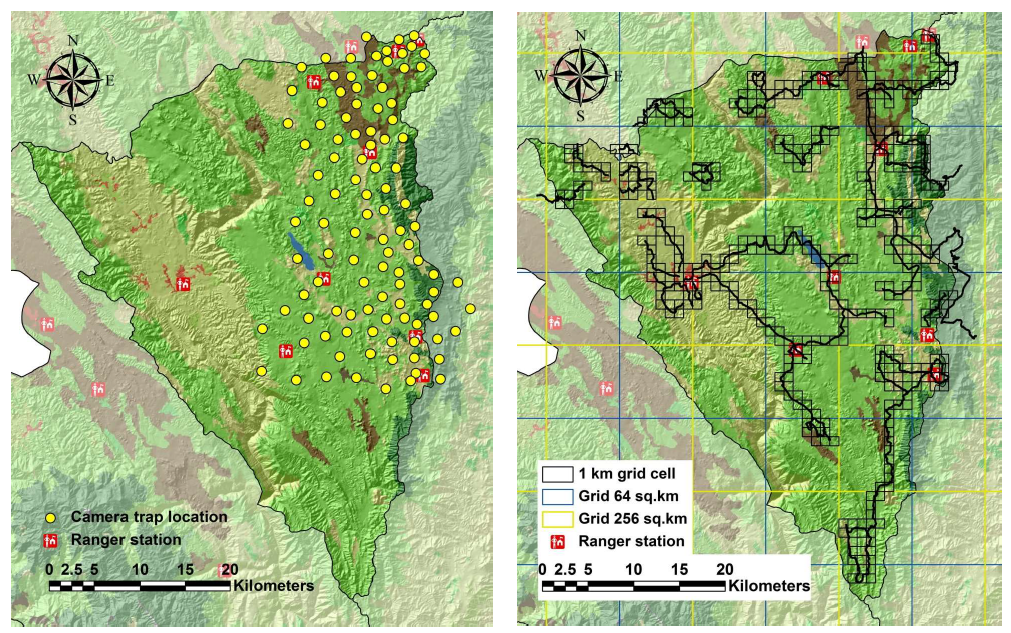
A detection/non-detection sampling technique was used from April 2010 to January 2012 from the central to the eastern part of Thung Yai Naresuan (East) Wildlife Sanctuary. In order to obtain adequate numbers of tiger and leopard captures and their main prey species, camera trap stations (1 camera per station) were set based on the smallest home range size of female tigers (12–16 km
2 [
53]). Therefore, the minimum trap spacing was 2 km and the maximum spacing between each trap location was 3.5 km to ensure that no individual’s home range occurred entirely between cameras (). We placed each camera trap (Stealth Cam I590 or Bushnell Trophy Cam) on an animal trail where tiger and leopard signs (scats, scrapes, scent deposits, tracks) or prey signs occurred [
14]. In total, we established 104 successful camera trap stations.
Cameras were set to operate 24 h/day with 3 images per trigger with a 1-min delay for Stealth Cam cameras and a 30-s delay for Bushnell cameras. Each camera was placed 0.4–0.5 m off the ground on a tree, and all vegetation and debris were cleared from the field of view. All trap locations were identified via GPS, marked on maps, and stored in a database. Date, time, and characteristics of topography were noted. Cameras were left in the field for 15–20 days each, but each trap location was checked on a weekly basis to replace batteries and the memory card, as well as to check their condition.
. Camera trap locations (yellow dots), and sign survey grid cells (outlined squares) and survey routes (black lines) in Thung Yai Naresaun (East) Wildlife Sanctuary, Thailand.
2.2.2. Sign Sampling
Sign surveys were conducted from November 2010 to February 2012. All surveys were conducted by Khao Nang Rum Wildlife Research Station (KNR) and Wildlife Conservation Society (WCS—Thailand program) teams. The study area was divided into 10 large (16 × 16 km) cells based on prior knowledge of the maximum home range size of male tigers (256 km
2; [
54]) (). Each of these large cells was divided into 4 medium grid cells (64 km
2; 8 × 8 km), and each of these was sub-sampled in small (1-km
2) survey cells. The maximum survey line distance walked was fixed as 60 km per large cell (256 km
2) if the cell was entirely comprised of forest [
55]. This distance was proportionately reduced depending on the extent of forest in each large grid cell. Survey effort ranged from 30 km of walking in large cells with 50% forest cover to 60 km in cells with 100% forest cover. Within each medium cell, survey routes through contiguous small grid cells were planned in advance to ensure adequate spatial coverage.The number of small grids sampled in some medium cells was also reduced because of the limited extent of the Sanctuary area in the cell. As a result, the number of small cells surveyed per medium cell ranged from 2–25 (mean = 14).
Each survey route was through a grid cell, and thus, each 100-m segment was searched once, and the number of segments searched in a single day varied with topography and hiking conditions. Within grid cells, survey routes were continued on the following day until completed. Within each small cell surveyed, sign data were recorded along 100-m segments as either detection (1) or not-detection (0) of the species of interest [
56]. Each new instance of tiger tracks (e.g., as track size, number of tigers in the group, etc.) and each instance of tiger scratch marks, scat, and spray were recorded within every 100-m segment. For ungulate prey species (gaur, sambar, tapir, wild boar, barking deer, etc.), tracks, pellet/dung piles, calls, direct sight, etc., were recorded only the first encounter of each type of sign/evidence within each 100-m segment to avoid psuedo-replication. The presence of human disturbance (e.g., poaching evidence, camping, logging, livestock presence, etc.) was also recorded in the same manner as for prey during the survey.
2.3. Quantification of Environmental Covariates
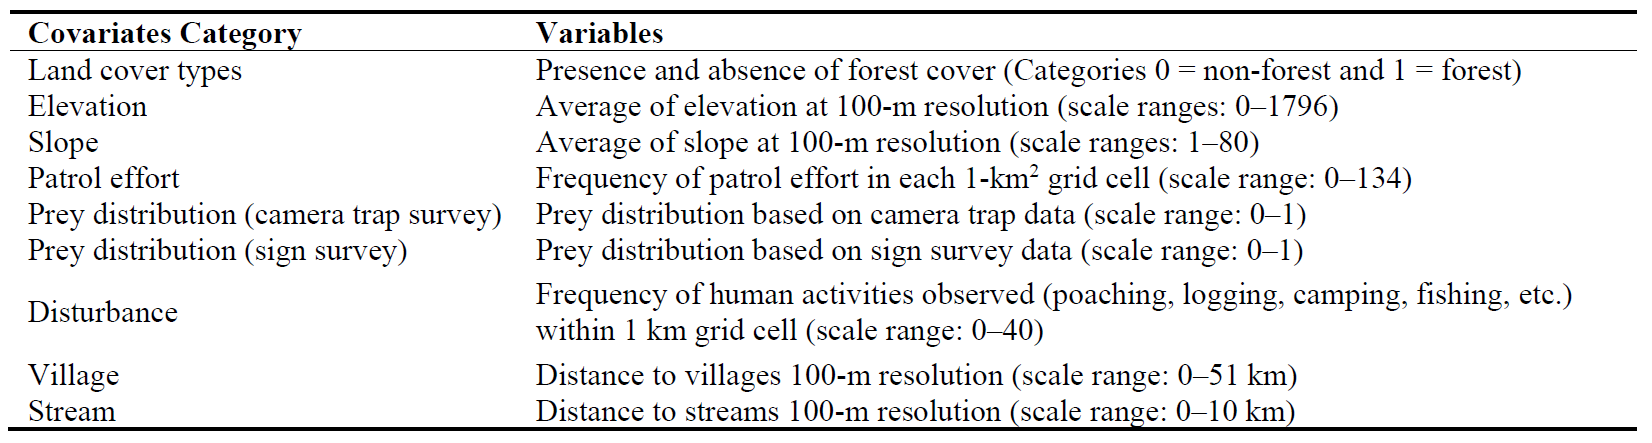
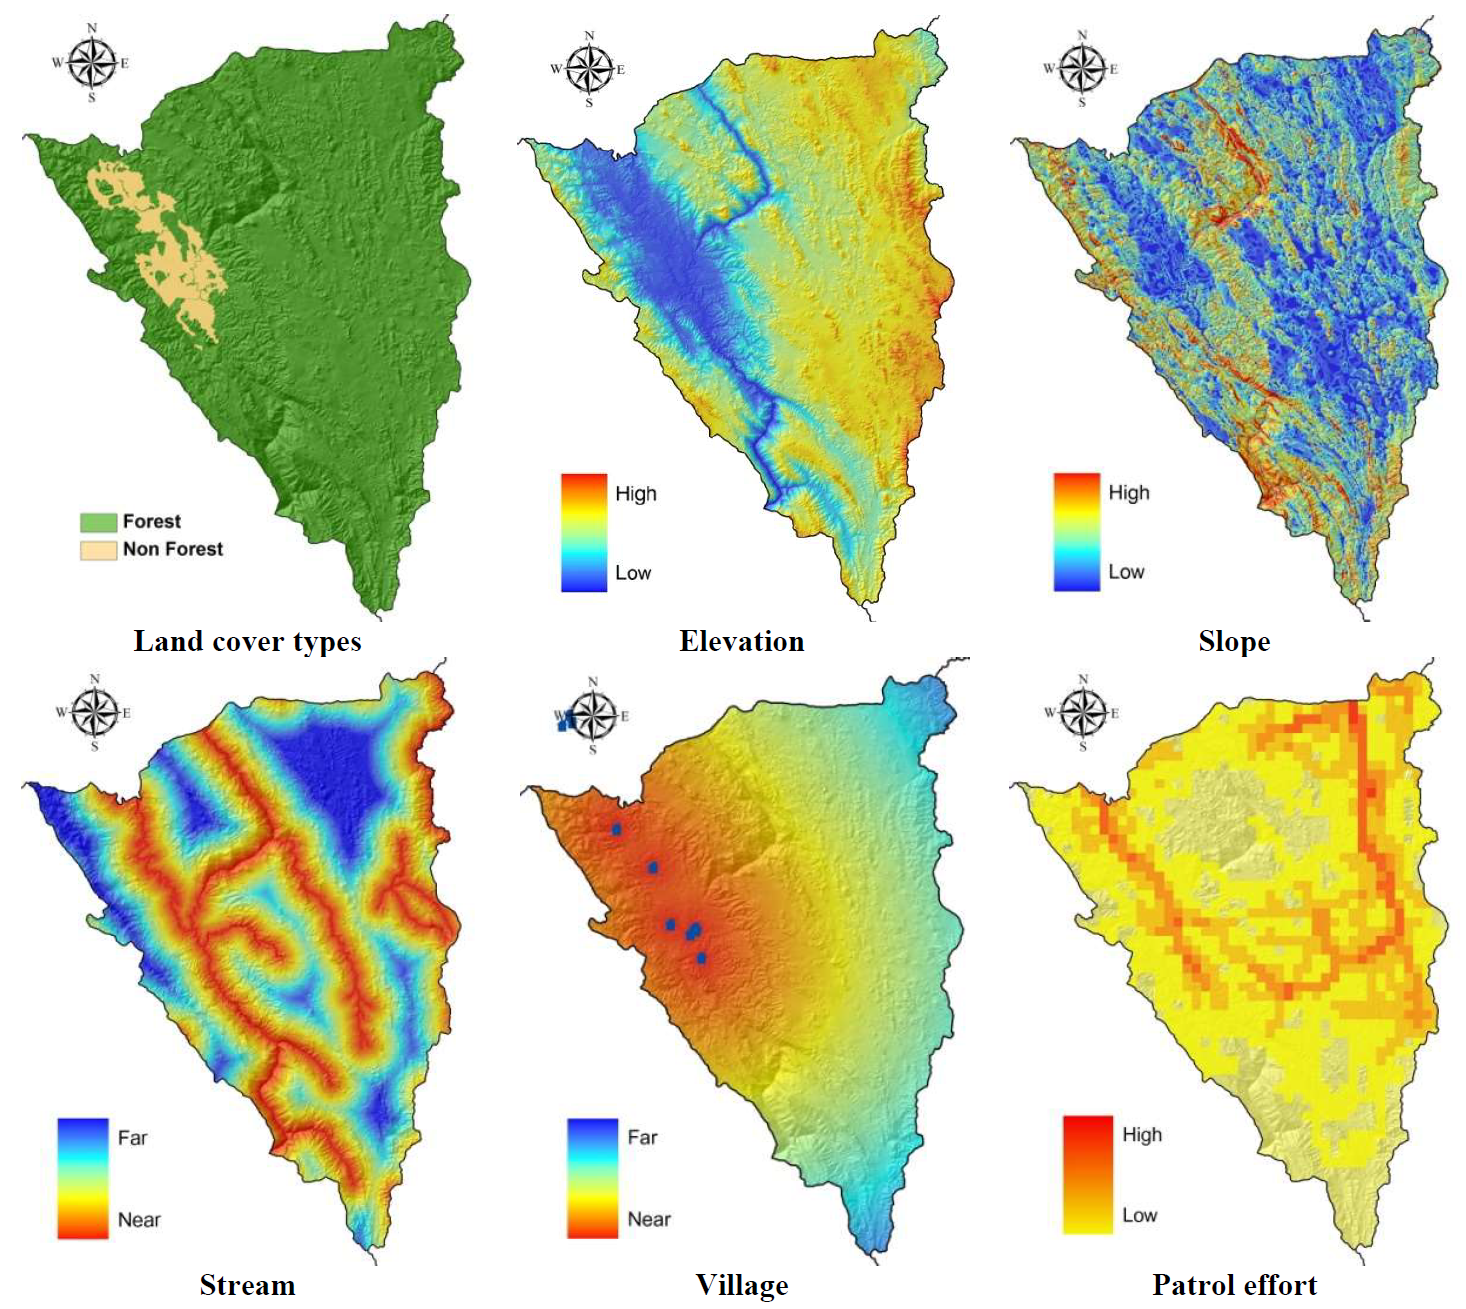
A dataset of 11 potential environmental covariates (land cover types, elevation, slope, village, stream, human disturbance, patrol effort, and prey distribution [gaur, sambar, barking deer, wild boar]) were included for estimating tiger and leopard distributional factors (). All potential variables were constructed within ArcGIS 9.3 software (ESRI, Redlands, CA, USA). The data (land cover types, elevation, village, and patrol effort) were obtained from several sources (Department of National Park, Wildlife, and Plant Conservation [DNP], Wildlife Conservation Society [WCS]). We explored the importance of the potential covariates by modeling parameters as a function of habitat characteristics. As the primary objective of this study was to investigate fine-scale factors affecting the distribution of tigers and leopards, all environmental covariates were converted to raster dataset formats at 100- × 100-m resolution through the Spatial Analyst function of ArcGIS 9.3 (ESRI, Redlands, CA, USA) and the single value per site was obtained by averaging all the pixels within the cell site. Elevation, slope, land cover types (forest and non-forest) parameters were converted into the raster data based on the value in each pixel. Stream and village distances were calculated in 100-meter increments from the center of these features across the study area. Patrol data was recorded as the frequency of patrol effort within 1-km grid cells and converted to raster file format (see the range of each parameter in and ).
. Environmental and anthropogenic covariates used to evaluate factors affecting the distribution of tigers and leopards in Thung Yai Naresuan (East) Wildlife Sanctuary, Thailand.
For prey distribution parameters, we developed prey distribution models to be used for estimating tiger and leopard habitat use based on camera trap data and sign surveys separately. The location of each potential prey was calculated to define the relationship between point locations and all possible factors including forest types, distance to human disturbance, elevation, slope, distance to stream, and patrol efforts. Predicting prey distributions were estimated using the logistic regression function:
where
βo is the constant coefficient (intercept) and
β1,
β2,…,
βi represent the regression coefficients of the associated independent variables
X1,
X2, …,
Xi, to generate the best model fit in explaining the probability of the distribution of each prey species. All statistical analyses were conducted using SPSS (ver. 16) (SPSS Inc., Chicago, IL, USA). Then, we applied the spatial analysis procedure in ArcGIS 9.3
® (ESRI Inc.) by combining the coefficient of all predictive parameters of the best model with GIS data layers to develop the prey distribution map.
A human disturbance intensity model was developed based on the TYE rangers' data from patrol efforts during 2010–2011. All locations of human disturbance evidence were coded with respect to prey distributions, forest types, elevation, slope, distance to stream, distance to village, and patrol intensity. We analyzed to estimate the best model of human disturbance intensity based on logistic regression function (Equation (1)) through SPSS (ver. 16) (SPSS Inc., Chicago, IL, USA). Then, the coefficients of all predictive parameters from the best model were combined with all predictive GIS data layers to generate a human disturbance intensity map using the Spatial Analysis extension in ArcGIS 9.3 software (ESRI, Redlands, CA, USA).
. Environmental and social covariate layers for habitat use estimation in Thung Yai Naresaun (East) Wildlife Sanctuary, Thailand (see for range of actual values).
2.4.1. Camera Trap Data
We constructed detection histories of tigers and leopards separately in a table matrix format with rows representing encounter histories at each camera-trap location and columns representing captures on each sampling replication. We considered each camera trap location as a ‘site’ and sampling replications were 5-night periods starting from the date camera traps were set to when the camera trap was retrieved to form “temporal replicates.” We combined sampling occasions (day) to avoid too many non-detections during the sampling sessions and to give sufficient detection probabilities per session for robust modeling [
57,
58,
59]. For example, a camera operating for 17 nights would result in 3 sampling occasions (5 nights/occasion) with encounters from the final two nights ignored. Each camera trap location was linked to 10 environmental covariates related to habitat use to calculate the site value based on geometric intersection. Then, the correlations of elevation, slope, distance to stream, distance to village, patrol effort, prey distributions, and human disturbance intensity were standardized to reduce the influence of variables that had larger ranges and to allow the model coefficient to be interpreted as the change in the log-odds ratio [
60]. All covariates were treated as continuous variables except for land cover type (forest or non-forest).
2.4.2. Sign Survey Data
We constructed detection histories for each 1 km surveyed in a 1-km
2 grid cell by dividing the records into 100-m segments to form “spatial replicates”. We considered each 1-km transect as the site, and sampling replications were represented by ten 100-m segments [
61]. Each site (1-km scale) location was processed by linking with 11 environmental covariates to calculate the site value associated with each site location based on the geometric intersection. The correlations of elevation, slope, distance to stream, distance to village, patrol effort, prey distributions, human disturbance intensity, and land cover types were standardized to reduce the influence of variables that had larger ranges and allow the model coefficient to be interpreted as the change in the log-odds ratio [
60]. Land cover types were treated as categorical covariates, while the other covariates were treated as continuous variables.
3. Theory/Calculation
Camera trap data and sign survey data were analyzed separately based on the occupancy sampling approach. The table matrix of detection and non-detection, along with site-specific covariates (land cover types, elevation, slope, distance to streams, distance to villages, prey distributions, patrol effort, and human disturbance intensity), was imported into PRESENCE 5.3[
61]. Since the probability of detection for each species and land cover type is not always 1.0 [
23], land cover types (forest = 1 and non-forest = 0) were incorporated into the predictive habitat use model as a function of detection probability (p) for the sign survey sampled across the study area.This provides a more accurate depiction of habitat use without assuming that all animals in the surveyed area are detected [
62]. However, the camera trap survey was conducted only in forest, so the land cover types were not used as the detection probability function in the camera trap data analysis. We applied the standard occupancy model, which is based on two key parameters: ѱ, the probability that a grid is occupied by the species, and p, the probability of detecting the species' presence in a replicate [
63]. Then, the maximum likelihood estimates of the model parameters were derived [
23,
61], and candidate models were ranked by their Akaike Information Criterion (AIC) values and the Akaike weights [
64]. The top-ranking candidate model was used to predict the tiger and leopard habitat use in different sampling scales (within the camera trap sampling area and across Thung Yai Naresaun (East) Wildlife Sanctuary). The corresponding beta (
β) coefficients from the covariates in the top model were used to construct a predictive habitat use model for tigers and leopards. However, if no single model was clearly superior to the others in the model sets (Akaike weights (ⱳ
i > 0.9), as was the case here, the other models were considered and were incorporated in the model averaging technique by summing Akaike weight (ⱳ
i) until reaching 90% model confidence to draw inferences [
65,
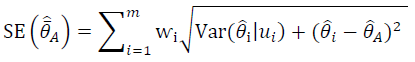
66]. To account for uncertainty in the model selection procedure, parameter estimates and standard errors were calculated based on Akaike weight (ⱳ
i) across the suit of models to obtain a new coefficient of each parameter based on Burnham and Anderson [
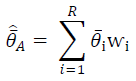
65], as:
where $$\hat{\bar{\theta}}$$ represents a form of model averaging, $$\bar{\theta}_\mathrm{i}$$ is the estimated parameter based on model
i, ⱳ
i is the AIC weight for each model, and
R is the number of models considered. For model averaging, AIC weight values were calculated in each of the suite of best models instead of across the entire model set as:
Then, parameters in averaged models were calculated as odds ratios and 95% odds ratio confidence intervals to determine the effect of each predictive covariate in the 90% confidence model set on habitat use. We also assessed the importance of individual parameters by summing Akaike's weight (ⱳ
i) of each parameter across the suit of best model sets to determine the importance of the independent variables in the model [
65].
To assess the factors affecting distribution, the coefficients of all predictive parameters from the model averaging approach were combined with GIS data layers.We estimated tiger and leopard habitat use models through Spatial Analysis extension in ArcGIS 9.3 software (ESRI, Redlands, CA, USA) based on logistic regression (Equation (1)). The resulting habitat use model depicted the probability of habitat use of the species within every given pixel across the study area. The predictive power of the habitat use model was validated using a Spearman’s rank correlation coefficient through “Band Collection Statistics” in ArcGIS 9.3 software (ESRI, Redlands, CA, USA) to test for a correlation of habitat use model between species and sampling method.
4. Results
4.1. Summary of Sampling Effort
In total, we sampled 104 camera trap locations in an area of ~925 km
2 for a total of 141 days and 1817 trap nights. Tiger photos were obtained at 21 locations, with 57 independent photographs recorded, while leopard photos were captured at 21 locations, with 72 independent photographs (Table S1). For the sign survey, we systematically surveyed 493 km of transects in 10 large grid cells (256 km
2 each) and 28 sub-grid cells (64 km
2 each) covering an area of 1421 km
2. Each grid cell was surveyed with 30 to 60-km transects except in four sub-grid cells at the edge of the study area where logistical problems and steep slopes reduced transect length. Signs of tigers were detected 55 times (41 individual tracks and 14 scats), while signs of leopards were detected 41 times (39 individual tracks and 2 scats).The naïve estimates of detection probability of tigers were not much different between sampling methods (camera trap = 0.70, sign survey at the same sampling scale = 0.76, sign survey across study area = 0.68). Still, there were differences in leopard detection probability between camera traps and sign surveys (camera trap = 0.64, sign survey at the same sampling scale = 0.37, sign survey across study area = 0.31). Detection probability of tigers was slightly higher than leopards based on the camera trap survey (tiger = 0.70, leopard = 0.64) but was different in the sign survey method (tiger = 0.76 vs. leopard = 0.37 camera trap sampling scale; tiger = 0.68 vs leopard = 0.31 sampling across study area; Table S1).
4.2. Tiger and Leopard Habitat Use Models
4.2.1. Camera Trap Survey
The best model for predicting tiger habitat use contained only two covariates, Gaur and Sambar (ⱳ
i = 0.24), with the next closet model being Gaur, Sambar, and Patrol (ⱳ
i = 0.17) (Table S2). The best model for predicting the habitat use of leopards contained three covariates: Barking deer, Wild boar, and Disturbance (ⱳ
i = 0.21); the next ranking model included Barking deer, Wild boar, Disturbance, and Slope (ⱳ
i = 0.21) (Table S3). The best habitat use model of both tigers and leopards indicated model selection uncertainty (no single model received ⱳ
i >0.90), and therefore model averaging was used. Based on the model averaging approach, the habitat use model for tigers included seven variables (Gaur, Sambar, Patrol, Disturbance, Elevation, Stream, and Slope), while the model for leopards included six (Barking deer, Wild boar, Disturbance, Slope, Patrol, and Elevation). The summation of weighted evidence (Akaike weights; ⱳ
i) for individual variables used in model averaging tiger habitat use indicated that the three most important parameters for tiger habitat use were Gaur, Sambar, and Patrol. Gaur and Sambar were the most important variables across all models (importance value = 1.00), followed by Patrol (importance value = 0.26). For leopard habitat use, Barking deer, Wild boar, and Disturbance were the three most important variables. Barking deer and Wild boar were the most important variables across all models (importance value = 1.00), followed by Disturbance (importance value = 0.60) (Table S4). Model averaged estimates of tiger habitat use from camera trap data had a strong positive association with the large ungulates (Gaur; OR = 2.73, Sambar OR = 2.38) and a positive association with Patrol (OR = 1.20), Elevation (OR = 1.06), and Stream (OR = 1.06), but negative correlation with Disturbance (OR = 0.83) and Slope (OR = 0.96). This result indicated that tigers use increased in areas where large prey are more common and patrolling is higher, and in low slope areas at relatively high elevations; tigers avoided using areas with high disturbance activities (Table S4). The leopard habitat use model showed a significantly positive correlation with smaller prey (in contrast to tigers); e.g., Barking deer (OR = 2.47) and Wild boar (OR = 1.56). The leopard model had a positive correlation with Slope (OR = 1.36), and Patrol (OR = 1.05), but a negative correlation with Disturbance (OR = 0.47) and Elevation (OR = 0.98). The correlation between the parameters and leopard habitat use implied that leopard habitat use was strongly associated with the distribution of barking deer and wild boar and that they had increased use of areas with high patrol effort and were not limited by slope. Human disturbance appeared to negatively influence their space use (Table S4). The spatial explicit prediction of habitat use for tigers and leopards from camera trap surveys revealed intensive use of most of the sampling area. Both tiger and leopard habitat use models were most influenced by prey distribution, low disturbance, and high patrol effort.
4.2.2. Sign Survey in the Camera Trap Sampling Area
The result of the model selection based on the sign survey within the camera trap sampling area showed the best model of tiger habitat use contained five site covariates, including Gaur, Sambar, Stream, Patrol, and Elevation (ⱳ
i = 0.48), with the next closet model including Gaur, Sambar, and Stream (ⱳ
i = 0.24) (Table S5).
The best model of leopard habitat use included Sambar, Wild boar, Stream, and Elevation (ⱳ
i = 0.42), with the next closet model containing Sambar, Wild boar, Stream, Patrol, Elevation (ⱳ
i = 0.20) (Table S6). All habitat use models for both tigers and leopards indicated model selection uncertainty; therefore, the model averaging approach was used.
Model-averaged estimates for tigers and leopards included 3- and 4-model subsets based on the 90% confidence model set, respectively. The number of predictive variables presented in the 90% confidence model of tiger habitat use was six (Gaur, Sambar, Stream, Elevation, Patrol, and Slope) and leopard habitat use was seven (Sambar, Wild boar, Stream, Elevation, Patrol, Slope, and Disturbance) (Table S5). The summation of weighted evidence (Akaike weights; ⱳ
i) for individual variables used in the model averaging approach of tiger habitat use indicated that the three important parameters for tiger habitat use were Gaur, Sambar, and Stream. These three parameters have an equal importance value of 0.90. For the leopard habitat use model, Sambar, Wild boar, Stream, and Elevation were the most important variables across all models (importance value = 0.95) (Table S4).
The positive association of gaur and sambar (OR = 2.66 and 1.15, respectively), streams (OR = 1.54), and patrol effort (OR = 1.85) in the model-averaged estimate of tiger habitat use indicate that tigers increase their space use in areas with higher distributions of gaur and sambar, as well as in areas with high patrol effort, but they are not limited by the presence of streams. The negative correlation of Elevation (OR = 0.55) and Slope (OR = 0.99) demonstrated that habitat use by tigers covers most of the lowlands with low slopes (Table S5). The model-averaged estimate for leopard habitat use indicated a strong positive correlation with sambar and wild boar habitat use (OR = 5.14 and 3.41, respectively). They are also positively correlated with Stream (OR = 2.36), Patrol (OR = 1.13), Slope (OR = 1.06), and negatively correlated with Elevation (OR = 0.32) and Disturbance (OR = 0.87). This result implies that leopard habitat use is highly correlated with the distribution of sambar and wild boar, and is also associated with low altitudes and areas of relatively low disturbance (Table S4).The predictive habitat use maps for tigers and leopards, based on the sign survey conducted in the same camera trap sampling area, revealed similar model estimates to those from the camera trap survey. Both tigers and leopards can use the area almost the entire sampling area in the eastern part of Thung Yai Naresaun (East) Wildlife Sanctuary. Both tiger and leopard habitat use models were characterized by prey and low land; however, tigers tend to use areas where the large prey, such as guar and sambar are distributed, while leopards are more associated with the habitat use area of smaller ungulates.
4.2.3. Sign Survey across Thung Yai Naresuan (East) Wildlife Sanctuary
When using sign survey data from across the Sanctuary (i.e., not restricted to the camera survey area), the best model of tiger habitat use contained three covariates (Gaur, Sambar, Patrol; ⱳ
i = 0.25) and the next closest model included four covariates (Gaur, Sambar, Patrol, and Stream; ⱳ
i = 0.24) (Table S7). The best model of leopard habitat use included Barking deer, Wild boar, and Village (ⱳ
i = 0.27) and the next closet model contained Barking deer, Wild boar, Village, and Disturbance (ⱳ
i = 0.14) (Table S8). No single model was superior to the other models (ⱳ
i > 0.90), so the model-averaged approach was taken as the final estimate. Based on model averaging, the habitat use model for tiger and leopards from sign survey data across TYE included six predictive variables present in the 90% confidence model of tiger habitat use model (Gaur, Sambar, Patrol, Stream, Disturbance, and Slope) vs. seven predictive variables for leopard habitat use model (Barking deer, Wild boar, Village, Disturbance, Patrol, Slope, and Elevation) (Table S4). The summation of weighted evidence (Akaike weights; ⱳ
i) for individual variables in model averaging tiger habitat use showed that the first three important parameters were Gaur, Sambar, and Patrol. Gaur and Sambar were the most important variables across all models (importance value = 0.91), followed by Patrol (importance value = 0.79). Barking deer, Wild boar, and Village were the first three important variables for leopard habitat use. Barking deer and Wild boar were the most important variables across all models (importance value = 0.96), followed by Village (importance value = 0.85) (Table S4).
The model averaged estimate for tiger habitat use indicated the positive association with Gaur (OR = 2.14), Sambar (OR = 2.46), Patrol (OR = 1.93), Stream (OR = 1.23), Slope (OR = 1.00), and negative correlation with Disturbance (OR = 0.93). These correlations imply that the habitat use pattern of tigers corresponds with the distribution of gaur and sambar, in areas with high patrol effort and low human disturbance.For leopard habitat use model, a positive correlation with Barking deer (OR = 3.27), Wild boar (OR = 2.22), Village (OR = 4.12), Disturbance (OR = 1.19), Patrol (OR = 1.28), and weak correlation with Slope (OR = 0.92) and Elevation (OR = 1.05) supported that the probability of habitat use increased with distribution of small ungulates like barking deer and wild boar. Their habitat use is associated with areas where patrol effort is high and farther from villages (Table S4). The tiger habitat use map from the sign survey across the sanctuary was associated with large ungulates and areas with high patrol effort, while the leopard habitat use map was linked to smaller prey, such as barking deer and wild boar, and areas farther from human settlements. Both tiger and leopard maps indicated avoidance of the western part of the area where the local people occur and disturbance activities are high.
4.3. Spatial Correlation of Model Results
The result of applying the Pearson’s correlation coefficients through “Band Collection Statistics” tools for estimating the correlation of tiger habitat use model between camera trap and sign survey at the same sampling area did not indicate a strong association (r = 0.60; ). However, the correlation of leopard habitat use models from two sampling methods indicated a high association (r = 0.89; ). The tiger and leopard habitat use models from sign survey data provide a higher correlation (r = 0.80) than those from camera trap data (r = 0.54). The correlation of tiger and leopard habitat model based on a sign survey sampled across Thung Yai Naresuan (East) Wildlife Sanctuary revealed that the association of habitat use of both predators was relatively high (r = 0.77).
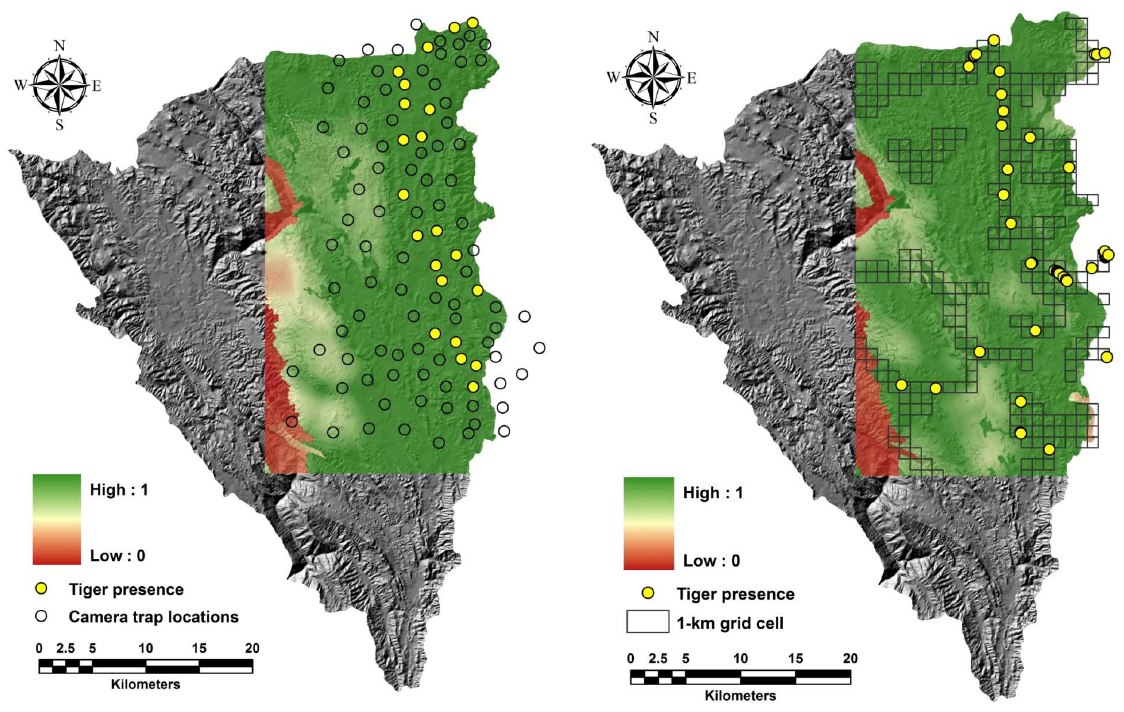
. Comparison of the predicted habitat use based on model-averaging between camera trap and sign survey in the same sampling scale for tigers in Thung Yai Naresuan (East) Wildlife Sanctuary, Thailand.
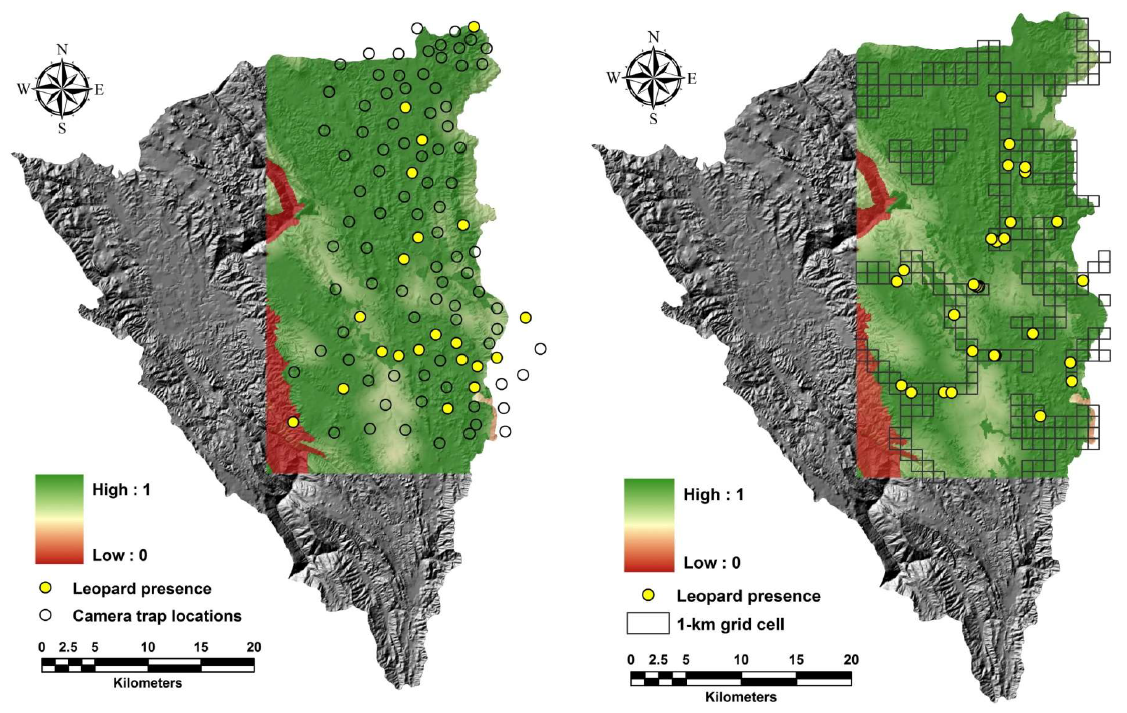
. Comparison of the predicted habitat use based on model-averaging between camera trap and sign survey in the same sampling scale for leopards in Thung Yai Naresuan (East) Wildlife Sanctuary, Thailand.
A comparison of tiger habitat use models derived from camera trap and sign surveys (both within the camera trap sampling area and across the study site) indicated similarities in predictor variables, including the distribution of large ungulates such as gaur and sambar, as well as high patrol effort. However, other parameters, such as patrol effort and disturbance, had a greater influence on the model derived from the camera trap survey vs the sign survey. We also found that the tiger model based on camera trap data was positively correlated with elevation, while the tiger habitat use model derived from sign survey data was negatively correlated. Basically, the conflict of the predictor resulted from non-detection data of tigers in the lower altitude area from the camera trap survey, while the observation based on the sign survey indicated that tigers also used the area at low altitude. However, the degree of correlation between the elevation parameter and tiger habitat use model derived from camera trap data was very weak and uncertain (OR = 1.06; important value = 0.12), while the tiger habitat use model developed sign survey data indicated a stronger negative association with elevation parameter (OR = 0.55; important value = 0.66). Therefore, within the same sampling area, the predictive tiger habitat use map based on the sign survey indicated a slightly wider range of habitat use than the map developed from camera trap data.Overall, we found that leopard habitat use models estimated from camera trap data and sign survey data at the same sampling scale were well-matched and consistent.
5. Discussion
Distributional models derived using detection/non detection data from camera trap and sign surveys revealed that both tigers and leopards used wide Thung Yai Naresuan (East) Wildlife Sanctuary area. Both predators tended to occupy the central to eastern parts of the sanctuary, where prey availability was high, while the western part was used less due to the impact of human settlements and the intensity of human activities.
5.1. Tiger Habitat Use
Distribution of tigers in our area was positively influenced by preferred (large) prey, low disturbance, areas with high patrol effort, and relatively low slope. Tiger occupancy was higher in the central to the eastern part of the area, with more preferred prey and less human disturbance. Prey abundance is an important determinant of tiger presence [
66,
67,
68,
69]; low ungulate density in Similipal Tiger Reserve, India, limited the tiger population [
70], and lead to lower tiger abundance [
71]. Similarly, Naing et al. [
72] suggested that low ungulate density in the Hukaung Valley Wildlife Sanctuary, Myanmar did not likely support many tigers. The impacts of anthropogenic characteristics and low prey availability were similar to many other studies [
64,
66,
67,
73,
74,
75,
76,
77] where tiger occurrence probability generally increases further from human settlements and activity [
78,
79,
80,
81,
82]. However, Warrier et al. [
83] reported that agricultural lands in India provide seasonal habitats for tigers, with high use in winter and lower use in summer and monsoon seasons. Also, human-tiger conflicts in the Leuser Ecosystem in Sumatra, Indonesia, are most prevalent in areas near villages and with lower wild prey occurrence, indicating tigers did not avoid human presence when prey availability is low [
84]. Though tiger occupancy was not related to streams in our study, tigers in Bhutan strongly selected sites that were farther from water sources; however, tiger prey species such as guar, sambar, muntjac, and wild pigs, more likely occupy areas near water [
72,
85,
86]. The result of tiger habitat use studies in Sumatra reported that within the forest, tigers strongly preferred sites that are farther from water bodies, but this was likely because people tend to concentrate around the water bodies [
64]. However, in our case, the lack of correlation with tiger habitat use may be due to high annual rainfall in this area. The impact of altitude on tiger habitat use seems depended on the context of landscape attributes associated with the other limiting factors. Linkie et al. [
87] and Sunarto et al. [
64] found that the probability of tiger occupancy increased with altitude, while Wibisono et al. [
88] reported tiger occupancy within the forest was higher at lower altitudes. In our study area, low altitude per se did not represent poor quality but rather factors related to the activities of local people.
5.2. Leopard Habitat Use
The distribution of leopards in our area was characterized by sites with higher occupancy of smaller prey, such as barking deer and wild boar, areas farther from human settlements, and low disturbance activities. Leopard distribution was limited mostly to the central and eastern parts of the sanctuary, which are farther from human community areas. Many previous studies have reported the negative impact of human settlement areas and habitat alterations on leopards, indicating that leopard habitat use increases with distance from human habitation [
89,
90,
91,
92,
93].
This is similar to MacManus et al. [
94], who reported that leopards avoided human-altered landscapes more strongly at large spatial scales and selected core areas near formally protected areas. Others have reported that leopards are more adaptable and less sensitive to disturbance, than tigers [
89,
95,
96,
97,
98,
99,
100]. A study in Mozambique National Park reported that leopard habitat use in human-disturbed areas was positively correlated with bushmeat poachers and lions, both of which serve as accurate indicators of prey availability [
101]. We did not find that water resources affected leopard distribution, unlike some studies which found that leopard habitat use was greater closer to streams [
6,
92,
102], again perhaps due to high annual rainfall in the area.
6. Conclusions
Distribution data for tigers and leopards, collected through various methods (i.e., camera traps and sign surveys) in Thung Yai Naresuan (East) Wildlife Sanctuary in western Thailand, were used to develop independent occurrence and distribution models for tigers and leopards to depict habitat use.Our findings using these different methods were very similar and indicated that the distribution of species-specific prey species and human activities were the most influential factors affecting tiger and leopard occurrence. Our results align with most other similar studies and further confirm that prey distribution and abundance, as well as human-related land use disturbances, are primary factors in estimating tiger and leopard occurrence. We believe that these environmental and anthropogenic insights are important in augmenting past studies and will help focus the identification of priorities for additional research leading to long-term conservation of sympatric tigers and leopards and their prey.
Modeling, such as what we have presented here, is essentially the development of reasonable hypotheses that need to be tested with different approaches and data. Syntheses of tiger and leopard demographic data in relation to the variety and abundance of prey species, for instance, will provide additional perspectives on species co-occurrence and abundance, as well as population growth and mortality factors most affecting populations. Doing this with an eye towards continued anthropogenic influences, including climate change, will be worthwhile research and conservation efforts.
Supplementary Materials
The following supporting information can be found at: https://www.sciepublish.com/article/pii/286: Table S1: Summary of survey effort and detection of tigers and leopards in Thung Yai Naresuan (East) Wildlife Sanctuary, Thailand. Table S2: Model selection results (90% model confidence) for estimating tiger habitat use based on a camera trap survey. Table S3: Model selection results (90% model confidence) for estimating leopard habitat use based on a camera trap survey. Table S4: Model averaged parameter estimates, SE, odds-ratio (OR), lower and upper odds-ratio interval, and summed weights of evidence for tiger and leopard based on camera trap and sign surveys. Table S5: Model selection results (90% model confidence) for estimating tiger habitat use based on a sign survey in the same sampling scale with a camera trap survey. Table S6: Model selection results (90% model confidence) for estimating leopard habitat use based on a sign survey in the same sampling scale with a camera trap survey. Table S7: Model selection results (90% model confidence) for estimating tiger habitat use based on a sign survey across Thung Yai Naresaun (East) Wildlife Sanctuary, Thailand. Table S8: Model selection results (90% model confidence) for estimating leopard habitat use based on a sign survey across Thung Yai Naresaun (East) Wildlife Sanctuary, Thailand.
Acknowledgments
We thank the Wildlife Conservation Society; the U.S. Fish and Wildlife Service: Rhino-Tiger Conservation Fund; and the Thailand Wildlife Research Division, Department of National Parks, Wildlife, and Plant Conservation for supporting this work. Thanks to S. Thongseekhem, head of Thung Yai Naresuan (East) Wildlife Sanctuary, as well as P. Pinyo, P. Kanidthachad, and the TYNE staff, field assistants J. Suwandee and P. Mueangnam, and the graduate student volunteers from the Faculty of Forestry, Kasetsart University. We also thank two anonymous reviewers for their helpful comments and suggestions.
Author Contributions
Conceptualization, S.V. and T.K.F.; Methodology, S.V.; Formal Analysis, S.V.; Investigation, S.V., S.D.; Resources, S.V., S.D.; Data Curation, S.V.; Writing—Original Draft Preparation, S.V.; Writing—Review & Editing, T.K.F., T.O.R., M.H.H.; Visualization, S.V.; Supervision, T.K.F.; Project Administration, S.V.; Funding Acquisition, S.V.
Ethics Statement
The study was conducted according to the guidelines of the Declaration of Helsinki, and we followed the ethics and guidelines of the American Society of Mammologists [103] with the approval of the Thailand Wildlife Research Division, Department of National Parks, Wildlife, and Plant Conservation.
Informed Consent Statement
Not applicable.
Funding
This work was funded, in part, by the Wildlife Conservation Society, the U.S. Fish and Wildlife Service: Rhino-Tiger Conservation Fund, and the Thailand Wildlife Research Division, Department of National Parks, Wildlife, and Plant Conservation.
Declaration of Competing Interest
The authors declare that they have no known competing financial interests or personal relationships that could have appeared to influence the work reported in this paper.
References
1.
Clark JD, Dunn JE, Smith KG. A multivariate model of female black bear habitat use for a geographic information system.
J. Wildl. Manag. 1993,
57, 519–526. doi:10.2307/3809276.
[Google Scholar]
2.
Mladenoff DJ, Sickley TA, Wydeven AP. Predicting gray wolf landscape recolonization: Logistic regression models vs. new field data.
Ecol. Appl. 1999,
9, 37–44. doi:10.1890/1051-0761(1999)009[0037:PGWLRL]2.0.CO;2.
[Google Scholar]
3.
Croak BM, Pike DA, Webb JK, Shine R. Habitat selection in a rocky landscape: Experimentally decoupling the influence of retreat site attributes from that of landscape features.
PLoS ONE 2012,
7, e37982. doi:10.1371/journal.pone.0037982.
[Google Scholar]
4.
Rajaratnam R, Sunquist M, Rajaratnam L, Ambu L. Diet and habitat selection of the leopard cat (
Prionailurus bengalensis borneoensis) in an agricultural landscape in Sabah, Malaysian Borneo.
J. Trop. Ecol. 2007,
23, 209–217. doi:10.1017/S0266467406003841.
[Google Scholar]
5.
Kelly JM, Holub EL. Camera trapping of carnivores: Trap success among camera types and across species, and habitat selection by species on Salt Pond Mountain, Giles Country, Virginia.
Northeast. Nat. 2008,
15, 249–262. doi:10.1656/1092-6194(2008)15[249:CTOCTS]2.0.CO;2.
[Google Scholar]
6.
Simcharoen S, Barlow AC, Simcharoen A, Smith JL. Home range size and daytime habitat selection of leopards in Huai Kha Khaeng Wildlife Sanctuary, Thailand.
Biol. Conserv. 2008,
141, 2242–2250. doi:10.1016/J.BIOCON.2008.06.015.
[Google Scholar]
7.
Kanagaraj R, Wiegand T, Kramer-Schadt S, Anwar M, Goyal SP. Assessing habitat suitability for tiger in the fragmented Terai Arc Landscape of India and Nepal.
Ecography 2011,
34, 970–981. doi:10.1111/j.1600-0587.2010.06482.x.
[Google Scholar]
8.
Guschanski K, Vigilant L, McNeilage A, Gray M, Kagoda E, Robbins MM. Counting elusive animals: Comparing field and genetic census of the entire mountain gorilla population of Bwindi Impenetrable National Park, Uganda.
Biol. Conserv. 2009,
142, 290–300. doi:10.1016/j.biocon.2008.10.024.
[Google Scholar]
9.
Buckland ST, Magurran AE, Green RE, Fewster RM. Monitoring change in biodiversity through composite indices.
Philos. Trans. R. Soc. Lond. Ser. B Biol. Sci. 2005,
360, 243–254. doi:10.1098/rstb.2004.1589.
[Google Scholar]
10.
Vine S, Crowther M, Lapidge S, Dickman C, Mooney N, Piggott M, et al. Comparison of methods to detect rare and cryptic species: A case study using the red fox (
Vulpes vulpes).
Wildl. Res. 2009,
36, 436–446. doi:10.1071/WR08069.
[Google Scholar]
11.
Barea-Azeón JM, Virgós E, Ballesteros-Duperón E, Moleón M, Chirosa M. Surveying carnivores at large spatial scales: A comparison of four broad-applied methods.
Biodivers. Conserv. 2007,
16, 1213–1230. doi:10.1007/s10531-006-9114-x.
[Google Scholar]
12.
Lewison R, Fitzhugh EL, Galentine SP. Validation of a rigorous track classification technique: Identifying individual mountain lions.
Biol. Conserv. 2001,
99, 313–321. doi:10.1016/S0006-3207(00)00197-X.
[Google Scholar]
13.
Linkie M, Chapron G, Martyr DJ, Holden J, Leader-Williams N. Assessing the viability of tiger subpopulations in a fragmented landscape.
J. Appl. Ecol. 2006,
43, 576–586. doi:10.1111/j.1365-2664.2006.01153.x.
[Google Scholar]
14.
Karanth KU, Nichols JD. Estimation of tiger densities in India using photographic captures and recaptures.
Ecology 1998,
79, 2852–2862. doi:10.1890/0012-9658(1998)079[2852:EOTDII]2.0.CO;2.
[Google Scholar]
15.
O’Brien TG, Kinnaird MF, Wibisono HT. Crouching tigers, hidden prey: Sumatran tiger and prey populations in a tropical forest landscape.
Anim. Conserv. 2003,
6, 131–139. doi:10.1017/S1367943003003172.
[Google Scholar]
16.
Azlan JM, Sharma DSK. The diversity and activity patterns of wild felids in a secondary forest in Peninsular Malaysia.
Oryx 2006,
40, 36–41. doi:10.1017/S0030605306000147.
[Google Scholar]
17.
Tobler MW, Carrillo-Percastegui SE, Leite Pitman R, Mares R, Powell G. An evaluation of camera traps for inventorying large- and medium-sized terrestrial rainforest mammals.
Anim. Conserv. 2008,
11, 169–178. doi:10.1111/j.1469-1795.2008.00169.x.
[Google Scholar]
18.
Ridout MS, Linkie M. Estimating overlap of daily activity patterns from camera trap data.
J. Agric. Biol. Environ. Stat. 2009,
14, 322–337. doi:10.1198/jabes.2009.08038.
[Google Scholar]
19.
Khorozyan IG, Malkhasyan AG, Abramov AV. Presence–absence surveys of prey and their use in predicting leopard (
Panthera pardus) densities: A case study from Armenia.
Integr. Zool. 2008,
3, 322–332. doi:10.1111/j.1749-4877.2008.00111.x.
[Google Scholar]
20.
Gray TNE, Phan C. Habitat preferences and activity patterns of the larger mammal community in Phnom Prich Wildlife Sanctuary, Cambodia.
Raffles Bull. Zool. 2011,
59, 311–318.
[Google Scholar]
21.
Karanth KK, Nichols JD, Hines JE, Karanth UK, Christensen NL. Patterns and determinants of mammal species occurrence in India.
J. Appl. Ecol. 2009,
46, 1189–1200. doi:10.1111/j.1365-2664.2009.01710.x.
[Google Scholar]
22.
Thorn M, Scott DM, Green M, Bateman PW, Cameron EZ. Estimating brown hyaena occupancy using baited camera traps.
S. Afr. J. Wildl. Res. 2009,
39, 1–10.
[Google Scholar]
23.
MacKenzie DI, Kendall WL. How should detection probability be incorporated into estimates of relative abundance?
Ecology 2002,
83, 2387–2393. doi:10.1890/0012-9658(2002)083[2387:HSDPBI]2.0.CO;2.
[Google Scholar]
24.
Manley PN, Zielinski WJ, Schlesinger MD, Mori SR. Evaluation of a multiple-species approach to monitoring species at the ecoregional scale.
Ecol. Appl. 2004,
14, 296–310. doi:10.1890/02-5249.
[Google Scholar]
25.
O’Connell AF Jr., Talancy NW, Bailey LL, Sauer JR, Cook R, Gilbert AT. Estimating site occupancy and detection probability parameters for meso- and large mammals in a coastal ecosystem.
J. Wildl. Manag. 2006,
70, 1625–1633. doi:10.2193/0022-541X(2006)70[1625:ESOADP]2.0.CO;2.
[Google Scholar]
26.
Simcharoen A, Simcharoen S, Duangchantrasiri S, Bump J, Smith JLD. Tiger and leopard diets in western Thailand: Evidence for overlap and potential consequences.
Food Webs 2018,
15, e00085. doi:10.1016/J.FOOWEB.2018.E00085.
[Google Scholar]
27.
Ngoprasert D, Lynam A, Sukmasuang R, Tantipisanuh N, Chutipong W, Steinmetz R, et al. Occurrence of three felids across a network of protected areas in Thailand: Prey, intraguild, and habitat associations.
Biotropica 2012,
44, 343–351. doi:10.1111/j.1744-7429.2012.00878.x.
[Google Scholar]
28.
Yadav S, Mohan M, Sharma A, Sonker S, Krishnamurthy R. Leopards at large: Population density, habitat utilisation and spatio-temporal overlap of leopards (Panthera pardus) with competitors and prey in the Rajaji Tiger Reserve, northern India.
Wildl. Res. 2024,
51, WR23082. doi:10.1071/WR23082.
[Google Scholar]
29.
Odden M, Wegge P, Fredriksen T. Do tigers displace leopards? If so, why?
Ecol. Res. 2010,
25, 875–881. doi:10.1007/s11284-010-0723-1.
[Google Scholar]
30.
Franchini M, Guerisoli M. Interference competition driven by co-occurrence with tigers Panthera tigris may increase livestock predation by leopards Panthera pardus: A first step meta-analysis.
Mammal Rev. 2023,
53, 271–286. doi:10.1111/mam.12323.
[Google Scholar]
31.
Thapa K, Malla S, Subba S, Thapa G, Lamichhane B, Subedi N, et al. On the tiger trails: Leopard occupancy decline and leopard interaction with tigers in the forested habitat across the Terai Arc Landscape of Nepal.
Glob. Ecol. Conserv. 2021,
25, e01412. doi:10.1016/j.gecco.2020.e01412.
[Google Scholar]
32.
Seidensticker J. On the ecological separation between tigers and leopards.
Biotropica 1976,
8, 225. doi:10.2307/2989714.
[Google Scholar]
33.
Charaspet K, Sukmasuang R, Khoewsree N, Pla-ard M, Paansri P, Keawdee B, et al. Spatial and temporal overlaps of top predators: Dhole, tiger and leopard, and their potential preys in Huai Kha Khaeng Wildlife Sanctuary, Thailand.
Biodiversitas 2021,
22, 580–592. doi:10.13057/BIODIV/D220209.
[Google Scholar]
34.
Schoen JM, Neelakantan N, Cushman SA, Dutta T, Habib B, Jhala YV, et al. Synthesizing habitat connectivity analyses of a globally important human-dominated tiger-conservation landscape.
Conserv. Biol. 2022,
36, e13909. doi:10.1111/cobi.13909.
[Google Scholar]
35.
Li Z, Lu J, Shi X, Duo L, Smith JLD, Wang T. Competitive interactions and coexistence of sympatric flagship carnivores in Asia.
Integr. Zool. 2023,
19, 183–199. doi:10.1111/1749-4877.12724.
[Google Scholar]
36.
Gubbi S, Sanjay, Sharma K, Kumara V. Every hill has its leopard: Patterns of space use by leopards (
Panthera pardus) in a mixed use landscape in India.
PeerJ 2020,
8, e10072. doi:10.7717/PEERJ.10072.
[Google Scholar]
37.
Rather TA, Kumar S, Khan JA. Multi-scale habitat modelling and predicting change in the distribution of tiger and leopard using random forest algorithm.
Sci. Rep. 2020,
10, 11473. doi:10.1038/S41598-020-68167-Z.
[Google Scholar]
38.
Pal R, Panwar A, Goyal SP, Sathyakumar S. Changes in ecological conditions may influence intraguild competition: Inferring interaction patterns of snow leopard with co-predators.
PeerJ 2022,
10, e14277. doi:10.7717/peerj.14277.
[Google Scholar]
39.
Wang HQ, Cheng S. Spatiotemporal variation in land use of Northeast China Tiger and Leopard National Park.
Int. J. Des. Nat. Ecodyn. 2020,
15, 835–842. doi:10.18280/ijdne.150609.
[Google Scholar]
40.
Chatterjee AB, Sankar K, Yadvendradev, Jhala YV, Qureshi Q. Spatio-temporal patterns of co-occurrence of tigers and leopards within a protected area in central India.
Web Ecol. 2023,
23, 17–34. doi:10.5194/we-23-17-2023.
[Google Scholar]
41.
Schooler SL, Finnegan SP, Fowler NL, Kellner KF, Lutto AL, Parchizadeh J, et al. Factors influencing lion movements and habitat use in the western Serengeti ecosystem, Tanzania.
Sci. Rep. 2022,
12, 18890. doi:10.1038/s41598-022-22053-y.
[Google Scholar]
42.
Rather TA, Kumar S, Khan JA. Density estimation of tiger and leopard using spatially explicit capture-recapture framework.
PeerJ 2021,
9, e10634. doi:10.7717/PEERJ.10634.
[Google Scholar]
43.
Alptuğ S. Maximum entropy niche-based predicting of potential habitat for the Anatolian Leopard (Panthera pardus tulliana Valenciennes, 1856) in Türkiye.
Šumarski List 2022,
146, 345–355. doi:10.31298/sl.146.7-8.6.
[Google Scholar]
44.
Greenspan E, Montgomery C, Stokes D, Wantai S, Moo SSB. Large felid habitat connectivity in the transboundary Dawna-Tanintharyi landscape of Myanmar and Thailand.
Landsc. Ecol. 2021,
36, 3187–3205. doi:10.1007/S10980-021-01316-5.
[Google Scholar]
45.
Buergin R. Shifting frames for local people and forests in a global heritage: The Thung Yai Naresuan Wildlife Sanctuary in the context of Thailand’s globalization and modernization.
Geoforum 2003,
24, 375–393. doi:10.1016/S0016-7185(02)00083-0.
[Google Scholar]
46.
Emphandhu D. Human Dimensions in Thailand Western Forest Complex: Challenges and Opportunities. Paper Presented at the 5th SAMPAA Conference, University of Victoria, British Columbia, Canada. 17p. 2003. Available online: https://www.researchgate.net/profile/Dachanee–Emphandu/publication/238676410_HUMAN_DIMENSIONS_IN_THAILAND_WESTERN_FOREST_COMPLEX_CHALLENGES_AND_OPPORTUNITIES/links/564ae1b708ae295f64502648/HUMAN-DIMENSIONS-IN-THAILAND-WESTERN-FOREST-COMPLEX-CHALLENGES-AND-OPPORTUNITIES.pdf (accessed on 24 September 2024).
47.
Buergin R. Contested Heritages: Disputes on People, Forests, and a World Heritage Site in Globalizing Thailand; SEFUT Working Paper No. 9; Albert-Ludwigs-University: Freiburg im Breisgau, Germany, 2001.
48.
Nakhasathien S, Stewart-Cox B. Nomination of the Thung Yai-Huai Kha Khaeng Wildlife Sanctuary to be a UNESCO World Heritage Site; Royal Forest Department: Bangkok, Thailand, 1990.
49.
Steinmetz R, Chutipong W, Seuaturien N, Chirngsaard E, Khaengkhetkarn, M. Population recovery patterns of Southeast Asian ungulates after poaching.
Biol. Conserv. 2010,
143, 42–51. doi:10.1016/j.biocon.2009.08.023.
[Google Scholar]
50.
Tantipisanuh N, Gale GA. Identification of biodiversity hotspot in national level–Importance of unpublished data.
Glob. Ecol. Conserv. 2018,
13, e00377. doi:10.1016/j.gecco.2018.e00377.
[Google Scholar]
51.
Vinitpornsawan S, Fuller TK. A camera-trap survey of mammals in Thung Yai Naresuan (East) Wildlife Sanctuary in western Thailand.
Animals 2023,
13, 1286. doi:10.3390/ani13081286.
[Google Scholar]
52.
Steinmetz R, Chutipong W, Seuaturien N. Collaborating to conserve large mammals in Southeast Asia.
Conserv. Biol. 2006,
20, 1391–1401. doi:10.1111/j.1523-1739.2006.00505.x.
[Google Scholar]
53.
Barlow ACD. Sundarbans Tigers: Adaptation, Population Status and Conflict Management. Ph.D. Dissertation, University of Minnesota, Minneapolis, MN, USA, 2009.
54.
Department of National Parks, Wildlife and Plant Conservation (DNP). Thailand Tiger Action Plan 2010–2022; Ministry of Natural Resources and Environment: Bangkok, Thailand, 2010.
55.
Hines JE, Nichols JD, Royle JA, MacKenzie DI, Gopalaswamy AM, Kumar NS, et al. Tigers on trails: Occupancy modeling for cluster sampling.
Ecol. Appl. 2010,
20, 1456–1466. doi:10.1890/09-0321.1.
[Google Scholar]
56.
MacKenzie DI, Nichols JD, Royle JA, Pollock KH, Bailey LL, Hines JE. Occupancy Estimation and Modeling; Academic Press: Burlington, MA, USA, 2006.
57.
Mackenzie DI, Royle JA. Designing occupancy studies: General advice and allocating survey effort.
J. Appl. Ecol. 2005,
42, 1105–1114. doi:10.1111/j.1365-2664.2005.01098.x.
[Google Scholar]
58.
Gray TNE. Studying large mammals with imperfect detection: Status and habitat preferences of wild cattle and large carnivores in eastern Cambodia.
Biotropica 2012,
44, 531–536. doi:10.1111/j.1744-7429.2011.00846.x.
[Google Scholar]
59.
Wong W-M, Linkie M. Managing sun bears in a changing tropical landscape.
Divers. Distrib. 2013,
19, 700–709. doi:10.1111/ddi.12020.
[Google Scholar]
60.
Donovan TM. Exercises in Occupancy Modeling and Estimation. 2007. Available online: https://cir.nii.ac.jp/all?q=http://www.uvm.edu/envnr/vtcfwru/spreadsheets/occupancy.htm (accessed on 15 April 2013).
61.
Hines JE. PRESENCE 5.3. Software to Estimate Patch and Occupancy Rates and Related Parameters; USGS-Patuxent Wildlife Research Center: Laurel, MD, USA, 2006. Available online: http://www.mbr-pwrc.usgs.gov/software/presence.html (accessed on 24 September 2024).
62.
Karanth KU, Nichols JD. Monitoring Tigers and Their Prey: A Manual for Researchers, Managers and Conservationists in Tropical Asia; Centre for Wildlife Studies: Bangalore, India, 2002.
63.
MacKenzie DI, Nichols JD, Lachman GB, Droege S, Royle JA, Langtimm CA. Estimating site occupancy rates when detection probabilities are less than one.
Ecology 2002,
83, 2248–2255. doi:10.1890/0012-9658(2002)083[2248:ESORWD]2.0.CO;2.
[Google Scholar]
64.
Sunarto S, Kelly MJ, Parakkasi K, Klenzendorf S, Septayuda E, Kurniawan H. Tigers need cover: Multi-scale occupancy study of the big cat in Sumatran forest and plantation landscapes.
PLoS ONE 2012,
7, e30859. doi:10.1371/journal.pone.0030859.
[Google Scholar]
65.
Burnham KP, Anderson DR. Model Selection and Multimodal Inference: A Practical Information-Theoretic Approach; Springer: New York, NY, USA, 2002.
66.
Karanth KU, Gopalaswamy AM, Kumar NS, Vaidyanathan S, Nichols JD, MacKenzie DI. Monitoring carnivore populations at the landscape scale: Occupancy modelling of tigers from sign surveys.
J. Appl. Ecol. 2011,
48, 1048–1056. doi:10.1111/j.1365-2664.2011.02002.x.
[Google Scholar]
67.
Harihar A, Pandav B. Influence of connectivity, wild prey and disturbance on occupancy of tigers in the human-dominated Western Terai Arc Landscape.
PLoS ONE 2012,
7, e40105. doi:10.1371/journal.pone.0040105.
[Google Scholar]
68.
Karanth KK, Nichols JD, Karanth KU, Hines JE, Christensen NL. The shrinking Ark: Patterns of mammal extinctions in India.
Proc. R. Soc. -B 2010,
227, 1971–1979. doi:10.1098/rspb.2010.0171.
[Google Scholar]
69.
Dahal B, Amin R, Lamichhane B, Giri S, Acharya H, Acharya H, et al. Setting recovery targets for a charismatic species in an iconic protected area complex: The case of tigers (Panthera tigris) in Chitwan–Parsa National Parks, Nepal.
Conserv. Sci. Pract. 2023,
5, e12930. doi:10.1111/csp2.12930.
[Google Scholar]
70.
Upadhyay H, Behera S, Dutta S, Sahu H, Sethy J. A viable tiger population in Similipal Tiger Reserve, India? Calculating if the ungulate prey base is limiting.
Wildl. Biol. 2019,
1, 1–7. doi:10.2981/wlb.00474.
[Google Scholar]
71.
Johnson A, Vongkhamheng C, Hedemark M, Saithongdam T. Effects of human–carnivore conflict on tiger (Panthera tigris) and prey populations in Lao PDR.
Anim. Conserv. 2006,
9, 421–430. doi:10.1111/j.1469-1795.2006.00049.x.
[Google Scholar]
72.
Naing H, Fuller TK, Sievert PR, Randhir TO, Po SHT, Htun S, et al. Dry-season habitat occupancy by ungulate tiger prey in the Hukaung Valley of northern Myanmar.
Trop. Zool. 2023,
36, 21–35. doi:10.4081/tz.2023.124.
[Google Scholar]
73.
Linkie M, Dinata A, Nugroho A, Haidir IA. Estimating occupancy of a data deficient mammalian species living in tropical rainforests: Sun bears in the Kerinci Seblat region, Sumatra.
Biol. Conserv. 2007,
137, 20–27. doi:10.1016/j.biocon.2007.01.016.
[Google Scholar]
74.
Cardillo M, Purvis A, Sechrest W, Gittleman JL, Beilby J, Mace GM. Human population density and extinction risk in the world’s carnivores.
Public Libr. Sci. Biol. 2004,
2, 909–914. doi:10.1371/journal.pbio.0020197.
[Google Scholar]
75.
Carroll C, Miquelle DG. Spatial viability analysis of Amur tiger Panthera tigris altaica in the Russian Far East: The role of protected areas and landscape matrix in population persistence.
J. Appl. Ecol. 2006,
43, 1056–1068. doi:10.1111/j.1365-2664.2006.01237.x.
[Google Scholar]
76.
Barber-Meyer SM, Jnawali SR, Karki JB, Khanal P, Lohani S, Long B, et al. Influence of prey depletion and human disturbance on tiger occupancy in Nepal.
J. Zool. 2013,
289, 10–18. doi:10.1111/j.1469-7998.2012.00956.x.
[Google Scholar]
77.
Puri M, Srivathsa A, Karanth KK, Patel I, Kumar NS. Links in a sink: Interplay between habitat structure, ecological constraints and interactions with humans can influence connectivity conservation for tigers in forest corridors.
Sci. Total Environ. 2022,
809, 15110. doi:10.1016/j.scitotenv.2021.151106.
[Google Scholar]
78.
Kafley H, Gompper M, Sharma M, Lamichane B, Maharjan R. Tigers (Panthera tigris) respond to fine spatial-scale habitat factors: Occupancy-based habitat association of tigers in Chitwan National Park, Nepal.
Wildl. Res. 2016,
43, 398–410. doi:10.1071/WR16012.
[Google Scholar]
79.
Penjor U, Tan C, Wangdi S, Macdonald DW. Understanding the environmental and anthropogenic correlates of tiger presence in a montane conservation landscape.
Biol. Conserv. 2019,
238, 108196. doi:10.1016/J.BIOCON.2019.108196.
[Google Scholar]
80.
Ash E, Kaszta Ż, Noochdumrong A, Redford T, Macdonald DW. Environmental factors, human presence and prey interact to explain patterns of tiger presence in Eastern Thailand.
Anim. Conserv. 2020,
24, 268–279. doi:10.1111/acv.12631.
[Google Scholar]
81.
Thapa K, Kelly M. Prey and tigers on the forgotten trail: High prey occupancy and tiger habitat use reveal the importance of the understudied Churia habitat of Nepal.
Biodivers. Conserv. 2017,
26, 593–616. doi:10.1007/s10531-016-1260-1.
[Google Scholar]
82.
Bhattarai BP, Kindlmann P. Human disturbance is the major determinant of the habitat and prey preference of the Bengal tiger (
Panthera tigris tigris) in the Chitwan National Park, Nepal.
Eur. J. Ecol. 2018,
4, 13–21. doi:10.2478/eje-2018-0002.
[Google Scholar]
83.
Warrier R, Noon B, Bailey L. Agricultural lands offer seasonal habitats to tigers in a human-dominated and fragmented landscape in India.
Ecosphere 2020,
11, e03080. doi:10.1002/ecs2.3080.
[Google Scholar]
84.
Lubis MI, Pusparini W, Prabowo SA, Marthy W, Tarmizi, Andayani N, et al. Unraveling the complexity of human–tiger conflicts in the Leuser Ecosystem, Sumatra.
Anim. Conserv. 2020,
23, 741–749. doi:10.1111/acv.12591.
[Google Scholar]
85.
Lamichhane S, Khanal G, Karki J, Aryal C, Aryal C, Acharya S. Natural and anthropogenic correlates of habitat use by wild ungulates in Shuklaphanta National Park, Nepal.
Glob. Ecol. Conserv. 2020,
24, e01338. doi:10.1016/j.gecco.2020.e01338.
[Google Scholar]
86.
Letro L, Fischer K, Duba D, Tandin T. Occupancy patterns of prey species in a biological corridor and inferences for tiger population connectivity between national parks in Bhutan.
Oryx 2021,
56, 421–428. doi:10.1017/S0030605320000976.
[Google Scholar]
87.
Linkie M, Haidir IA, Nugruho A, Dinata Y. Conserving tigers Panthera tigris in selectively logged Sumatran Forests.
Biol. Conserv. 2008,
141, 2410–2415. doi:10.1016/j.biocon.2008.07.002.
[Google Scholar]
88.
Wibisono HT, Linkie M, Guillera-Arroita G, Smith JA, Sunarto, Pusparini W, et al. Population status of a cryptic top predator: An island-wide assessment of tigers in Sumatran rainforests.
PLoS ONE 2011,
6, e25931. doi:10.1371/journal.pone.0025931.
[Google Scholar]
89.
Hebblewhite M, Miquelle DG, Murzin AA, Aramilev VV, Pikuno DG. Predicting potential habitat and population size for reintroduction of the Far Eastern leopards in the Russian Far East.
Biol. Conserv. 2011,
144, 2403–2413. doi:10.1016/j.biocon.2011.03.020.
[Google Scholar]
90.
Balme G, Hunter L, Slotow ROB. Feeding habitat selection by hunting leopards Panthera pardus in a woodland savanna: Prey catchability versus abundance.
Anim. Behav. 2007,
74, 589–598. doi:10.1016/j.anbehav.2006.12.014.
[Google Scholar]
91.
Ngoprasert D, Lynam AJ, Gale GA. Human disturbance affects habitat use and behaviour of Asiatic leopard Panthera pardus in Kaeng Krachan National Park Thailand.
Oryx 2007,
41, 343–351. doi:10.1017/S0030605307001102100.
[Google Scholar]
92.
Edgaonkar A. Ecology of the Leopard (Panthera pardus) in Bori Wildlife Sanctuary and Satpura National Park, India. PhD Thesis, University of Florida, Gainesville, FL, USA, 2008.
93.
Henschel P, Hunter LTB, Coad L, Abernethy KA, Mühlenberg M. Leopard prey choice in the Congo Basin rainforest suggests exploitative competition with human bushmeat hunters.
J. Zool. 2011,
285, 11–20. doi:10.1111/j.1469-7998.2011.00826.x.
[Google Scholar]
94.
McManus J, Marshal JP, Keith M, Tshabalala T, Smuts B, Treves A. Factors predicting habitat use by leopards in human-altered landscapes.
J. Mammal. 2021,
102, 1473–1483. doi:10.1093/jmammal/gyab110.
[Google Scholar]
95.
Nowell K, Jackson P. Wild Cats: Status Survey and Conservation Action Plan; IUCN/SSC Cat Specialist Group. IUCN: Gland, Switzerland, 1996.
96.
Sunquist ME, Sunquist F. Wild Cats of the World; University of Chicago Press: Chicago, IL, USA, 2002.
97.
Bertram BCB. Leopard. In The Encyclopedia of Mammals: 44–48; Macdonald DW, Ed.; Andromeda Oxford Limited: Oxford, UK, 1999.
98.
Marker LL, Dickman AJ. Factors affecting leopard (
Panthera pardus) spatial ecology, with particular reference to Namibian farmlands.
S. Afr. J. Wildl. Res. 2005,
35, 105–115.
[Google Scholar]
99.
Edgaonkar A, Chellam R. Food habit of the leopard,
Panthera pardus, in the Sanjay Gandhi National Park, Maharashtra, India.
Mammalia 2002,
66, 353–360. doi:10.1515/mamm.2002.66.3.353.
[Google Scholar]
100.
Odden M, Wegge P. Spacing and activity patterns of leopards
Panthera pardus in the Royal Bardia National Park, Nepal.
Wildl. Biol. 2005,
11, 145–152. doi:10.2981/0909-6396(2005)11[145:SAAPOL]2.0.CO;2.
[Google Scholar]
101.
Strampelli P, Andresen L, Everatt K, Somers M, Rowcliffe J. Habitat use responses of the African leopard in a human-disturbed region of rural Mozambique.
Mamm. Biol. 2018,
89, 14–20. doi:10.1016/J.MAMBIO.2017.12.003.
[Google Scholar]
102.
Mondal K, Sankar K, Qureshi Q. Factors influencing the distribution of leopard in a semiarid landscape of Western India.
Acta Theriol. 2012,
58, 179–187. doi:10.1007/s13364-012-0109-6.
[Google Scholar]
103.
Sikes RS, Gannon W, Animal Care and Use Committee of The American Society of Mammologists. Guidelines of the American Society of Mammalogists for the use of wild mammals in research.
J. Mammal. 2011,
92, 235–253. doi:10.1644/10-MAMM-F-355.1.
[Google Scholar]