
Stable Boundaries of Phragmites australis Marsh Development after Peat Mining in a Northern Japan Bog

Author Information
Other Information
Graduate School of Environmental Earth Science, Hokkaido University, Sapporo 060-0810, Japan
*
Authors to whom correspondence should be addressed.
Received: 15 July 2024 Accepted: 08 October 2024 Published: 15 October 2024

© 2024 The authors. This is an open access article under the Creative Commons Attribution 4.0 International License (https://creativecommons.org/licenses/by/4.0/).
Views:2251
Downloads:252
Ecol. Divers.
2024,
1(1), 10005;
DOI: 10.70322/ecoldivers.2024.10005
ABSTRACT:
Since Phragmites australis often develop marshes soon after human
disturbances, such as peat mining in bogs, the establishment patterns should be
clarified for restoration
purposes. The inside and outside boundaries of P.
australis marshes were investigated following peat mining in Sarobetsu mire, northern Japan,
in 2016 and 2017. The boundaries of marshes did not move during the two years,
due mostly to the slow expansion of shoots. Various vegetation types developed outside of the marsh. P. australis coexisted with neither ericaceous nor carnivorous plants, which favor Sphagnum bogs. The succession in the marsh did not progress the
original bogs. P. australis dispersed
seeds mostly within the
marshes, suggesting limited dispersal, and developed
transient seed
bank. Therefore, seed dispersal (sexual reproduction) and
rhizomes (vegetative reproduction) contributed to population maintenance rather
than population enlargement during
the studied period. Peat moisture was higher in the marsh, whereas photosynthetic active
radiation was lower. Water
levels did not differ between inside and outside the marshes. Chemical properties in peat water were not different
between inside and outside the
marshes. Therefore,
water chemistry and levels did not adequately explain the marsh development. These results suggest that, for wetland restoration,
environmental manipulation is ineffective in reducing P. australis and unpredictable
or stochastic events alter the dynamics of P.
australis marshes.
Keywords:
Mesic
grassland; Phragmites australis (common reed);
Post-mined peatland; Seed dispersal; Seed bank;
Vegetative reproduction
1. Introduction
Phragmites australis (Cav.) Trin. ex Steud. (Poaceae), commonly known as common reed, is one of the most widespread species in mesic grasslands, including fens, marshes and swamps and often forms monotonic marsh [1]. The terminology of wetlands has been controversial [2]. This study uses the terms mire, marsh, bog, fen and peatland as follows. Mire and peatland refer to areas where thick peat develops. Since the study region, Sarobetsu, is referred to as Sarobetsu mire, we used the term ‘mire’ specifically when referring to Sarobetsu. In the other cases, ‘peatland’ is used. Bog and fen represent contrasting types of vegetation: i.e., bogs develop above the groundwater surface, while fens develop below it. Therefore, bogs are nutrient-poor and are often dominated by Sphagnum mosses, which do not require rich nutrients, rather than by P. australis. In contrast, fens are dominated by sedges and grasses that thrive in minerotrophic groundwater conditions. Marsh is dominated by herbaceous plants rooted in hydric soils. To distinguish P. australis-dominated vegetation from other types of vegetation, we use the term ‘P. australis marsh.’
P. australis excludes cohabitants through interspecific competition in a tidal wetland where it is dominant, thereby reducing species diversity [3]. In North America, P. australis is considered one of the most intractable invaders of wetlands due to its high productivity via clonal propagation and seed dispersal [4]. Intensive invasion by P. australis leads to decreased community diversity in the coastal wetlands of Australia [5].
P. australis, native to Japan, is one of the predominant species in post-mined peatlands in Sarobetsu mire, northern Japan [6]. Conversely, P. australis exhibits minimal establishment in the original, unmined bog [7]. Therefore, excluding P. australis is key to restoring the original bogs in post-mined peatlands. Understanding the dynamics of P. australis in post-mined peatlands is crucial for the conservation and restoration efforts, which should aim to exclude this species.
P. australis employs two reproductive strategies, namely seed and vegetative reproduction, to sustain its populations [8]. The burial of P. australis rhizomes in peat facilitates shoot emergence in well-drained soils [9], indicating a relationship between vegetative reproduction water levels. Conversely, low water levels create favorable conditions for seed germination and seedling establishment of P. australis [10]. High nitrogen availability enhances the colonization of P. australis in post-mined peatlands [11]. Additionally, scale dependency has been observed in semiarid grasslands in northern China, particularly concerning soil chemistry [12]. Therefore, groundwater's physical and chemical properties were measured to understand vegetation dynamics.
In the field experiments conducted in Sarobetsu mire, nearly all seedlings of P. australis that emerged in autumn died soon after overwintering into the following year [13]. We hypothesize that vegetative reproduction facilitates the maintenance of P. australis marshes more. Seed dispersal and seedling emergence are inconsequential for expanding P. australis marshes. However, due to the characteristics of post-mined peatlands, where peat residues are agitated and homogenized, the effects of physical and chemical properties on marsh development remain unclear. Therefore, the boundaries of P. australis marshes are stable and stagnant.
2. Methods
2.1. Study Area and Methods
The study area, Sarobetsu mire, is part of the Rishiri-Rebun-Sarobetsu National Park, as designated by the Ministry of Environment of Japan. This research was conducted in a post-mined area of Sarobetsu mire, located in northernmost Hokkaido, Japan (45°06ʹ N, 141°42ʹ E, 8 m a.s.l.) during 2016 and 2017. The mean annual temperature was 5.9 °C in both 2016 and 2017 in Toyotomi Town, situated 6 km from the study area [14]. Annual precipitation was recorded at 1004 mm in 2016 and 873 mm in 2017. Snow accumulation occurred from late October 2016 to late April 2017, peaking at 118 cm in January 2017. The ground surface becomes inundated shortly after the snow melts in early spring.
Peat dominated by Sphagnum mosses was mined in this mire for agricultural and industrial purposes between 1970 and 2003. Peat mining removed the peat and the former vegetation, litter and seed bank [15]. The typical successional sere following peat mining is bare ground—Rhynchospora alba (L.) Vahl. sedgeland—Moliniopsis japonica (Hack.) Hayata grassland [16]. Depending on the water level, R. alba sedgeland was replaced by P. australis or M. japonica grasslands [6]. P. australis is the least prevalent and does not form grasslands on natural bogs adjacent to the post-mined peatland of Sarobetsu mire [7]. Even after a tephra-sowing experiment in Sarobetsu mire, P. australis did not invade the areas disturbed by tephra for more than eight years [17]. P. australis recovers vegetatively via rhizomes soon after a prescribed fire on a reed swamp in northern Japan and exhibits low seed dispersal and a poor seed bank [18].
Six transect lines (Lines 1 to 6) were established in 2016 in an area mined in 1972 (Figure 1), marked by plastic stakes installed at 2-m intervals. The lines were separated more than 20 m apart. The lengths of lines were 20 m for Lines 1–3 and 30 m for Lines 4–6. The lines traversed the boundaries of P. australis marshes, which were visually estimated. Subsequently, the boundaries were realigned and refined using splicing analysis. The density and height of P. australis shoots were measured in each plot during the summers of 2016 and 2017. Vegetation surveys were conducted in 150 continuous 1 m × 1 m plots along the transect lines in the summer of 2017. Each plot was divided into 25 cells of 20 cm × 20 cm, and the percent cover of each species was recorded.
2.2. Seed Bank Estimation
To quantify seedling emergence and seed bank development, peat samples were collected at 2-m intervals along each line in mid-October 2016 (fall) and late May 2017 (spring) by a 100-cm3 steel soil tin (20 cm2 in surface area × 5 cm in depth). Peat includes a surface layer, i.e., litter, because litter contains more seeds than peat [13]. The total number of samples was 91 in each season, equivalent to a surface area of 1820 cm2.
Field observations confirmed that most species completed their seed dispersal before seed bank sampling in the fall of 2016. Thus, the seed bank samples in the fall contained seeds dispersed in 2016. Sampling in the spring of 2017 was conducted before shoot emergence for most species, ensuring that the samples did not contain seeds produced in 2017.
Seed germination experiments were conducted in a glasshouse. Peat samples collected in the fall were subjected to cold stratification at 2 °C in a dark refrigerator for 45 days. P. australis seeds require cold stratification to promote germination [15] and do not require light [19]. In the glasshouse, the samples were sprayed into trays (23 cm ×16 cm in surface area × 7 cm in depth) filled with vermiculite, ensuring the layer was less than 5 mm thick. Samples collected in the spring of 2017 had already been exposed to cold stratification in the field and were not subjected to additional cold stratification in the lab. Seedlings were marked by a numbered flag upon emergence and recorded every two days until no further germination occurred for two weeks. Water was sprinkled 5–8 times per day, depending on peat wetness.
2.3. Environmental Factors
Temperature and light intensity at ground level were monitored at hourly intervals from July to October 2016 and from June to October 2017 by pendant data loggers (HOBO, UA-002-XX, Onset Computer Corporation, Bourne, MA, USA), except for periods with faulty records. The loggers were set up along Lines 1, 2, 4 and 5, with placements at the three locations on each line: midpoint, inside and outside.
Photosynthetic active radiation (PAR) was measured at 1-m intervals along each line by two quantum meters (OSK 12TU181, Ogawa Seiki Co., Ltd., Tokyo, Japan) from June to October 2016 and 2017. PAR was measured simultaneously at 0.0 m and 1.5 m above the ground surface. Relative PAR (%) was calculated by (PAR at 0.0 m)/(PAR at 1.5 m) × 100.
Water content in peat was measured every 1 m on each line at two different points using a domain reflectometry (HydroSense, Campbell Scientific Inc., Logan, UT, USA) with a 12 cm probe, a total of eight times between May and October in 2016 and 2017. Peat-pore water was sampled monthly during the snow-free period from May to October over the two years from the inside, midpoint and outside of each line by porous cups (DIK-8392(21A), Daiki Rika, Shiga, Japan). The samples were transported to the laboratory within a day and frozen until analysis. The sampled water's pH and electric conductivity (EC) were measured by portable pH and EC meters (MP120 and MP125, Metter Toledo, Tokyo, respectively). Concentrations of NH4+, NO2−, NO3− and PO43− in the water samples were measured by an automatic water analyzer (QuAAtro, Bran+Luebbe, Norderstedt, Germany).
Water levels were measured from June to October 2016 and from May to October 2017 by twelve PVC pipes (1 m in length × 4 cm in diameter) with holes (4 mm in diameter) drilled at 10 cm intervals and sealed at one end. The pipes were inserted 80 cm below the ground surface at the two edges on each line.
2.4. Statistical Analysis
The boundaries of P. australis marshes along the transect lines were determined by changes in the shoot heights using a generalized additive model (GAM) with the assumption of gaussian distribution. The response and explanatory variables were shoot height and distance from the original point of each line, which is the edge of each line located outside of P. australis marsh. The boundary was identified as the distance at which the shoot height was estimated as 50% of the maximum on the splicing curves. The boundary was adjusted to a distance of 0 m, and the other distances beyond that were expressed by negative and positive values, representing plots located outside and inside of P. australis marshes, respectively (Figure 1).
Two-way indicator analysis (TWINSPAN) and non-metric multidimensional scaling (NMDS) were used to investigate the distribution patterns of vegetation and species by the twinspan and vegan libraries in R, respectively, based on a plot-species matrix [20,21]. Two dimensions were considered in the NMDS. When the stress in the NMDS is below 0.1, the configuration accurately represents the distances of the original data. When the stress is moderate, between 0.1 and 0.2, the NMDS shows a reasonable fit, but some information may be lost [22]. Generalized linear mixed-effects models (GLMMs) were employed to compare the distance from the boundaries, species richness, Shannon-Weaver species diversity (H’) and evenness (J’) between vegetation types classified by TWINSPAN, with the assumptions of gaussian distribution for the distance and H’, Poisson distribution for species richness and binomial distribution for J’. The line code was used as a random effect. Due to excess zero in the seed bank data, differences in seed bank densities were examined by a hurdle model with the pscl library [23].
Daily cumulative light intensity and mean temperature were calculated based on data collected during 2016 and 2017. Differences in light intensities and temperatures among the locations and dates were compared by GLMMs, assuming gaussian distribution, with line code as a random factor. Peat moisture at different distances from the boundary was compared by GLMMs with the assumption of gaussian distribution. Differences in water level, light intensity, temperature and water chemistry (pH, EC, NH4+, NO3− and PO43−) were examined among the outside, midpoint and inside locations and among dates by GLMMs with the assumption of gaussian distribution and the interaction between distance and date. The significance levels were set to p < 0.01 for all the analyses. All the statistical analyses were conducted by the statistical software R (ver. 4.3.1) [24].
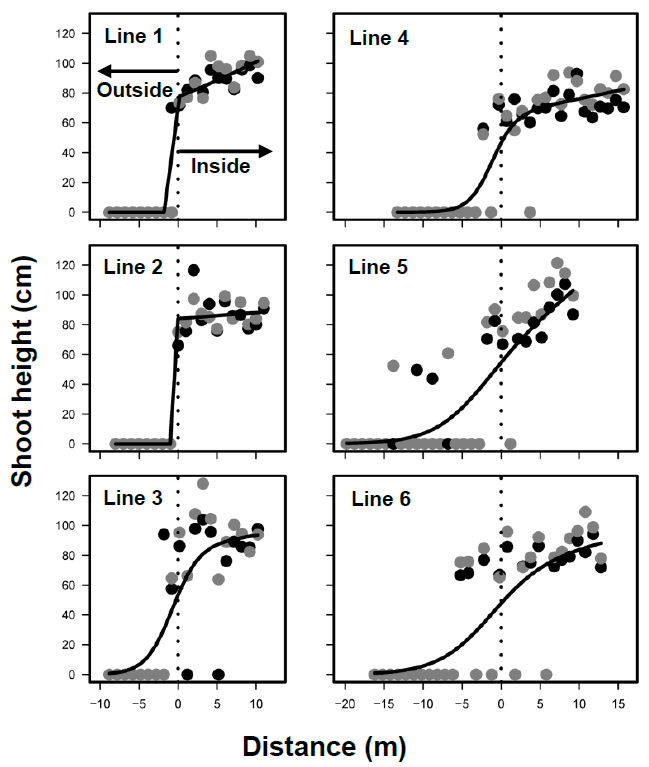
Figure 1. The average shoot height (cm) of Phragmites australis along six transect lines (1–6) in 2016 (black circles) and 2017 (gray circles). The splicing curves are obtained by negative binomial regressions with the assumption of gaussian distribution (<i>p</i> < 0.01).
3. Results
3.1. Boundaries of Phragmites australis Marsh
The shoots of Phragmites australis totaled 324 in 2016 and 335 in 2017, with new shoots established in a plot in 2017. Shoot heights ranged from 39 cm to 166 cm (Figure 1), with an average of 87 cm. Shoot density varied from 0 to 8 in both years. The mean height was positively correlated with the cover and density of P. australis (r = +0.851 and +0.814, respectively, significant at p < 0.01).
The boundaries of P. australis marshes were detected along all six lines using the shoot heights (GAMs, p < 0.01 for all lines) (Figure 1). Since the height, density and cover were highly correlated, the boundaries determined by density and cover were not significantly different from those by height. The locations of boundaries did not differ between 2016 and 2017 (GLMM, p = 0.20), indicating that the boundaries remained stable.
3.2. Vegetation Structure
The total plant cover exceeded 50% in all plots and surpassed 100% in a few plots. In 2017, 17 vascular plant species and Sphagnum mosses, predominantly by S. papillosum Lindb., were recorded from the 150 1 m × 1 m plots (Table 1). The most frequent vascular plant species was M. japonica, followed by Lobelia sessilifolia Lamb., Carex middendorffii Fr. Schmidt and P. australis. P. australis developed the tallest shoots of the vascular plants and began producing terminal inflorescences by late August.
TWINSPAN classified the 150 plots into five vegetation Groups (Figure 2). Initially, the plots were divided into two Groups, Groups A and B and Groups C, D and E. Groups A and B were characterized by high frequencies of P. australis, M. japonica, L. sessilifolia and R. alba, while Groups C, D and E were characterized by Vaccinium oxycoccos L., C. middendorffii and Polytrichum spp. Groups A and B were further separated by the presence of R. alba and P. australis, respectively. Group A consisted of 21 plots, and Group B included 71 plots. Group C was separated from Groups D and E by the dominance of Polytrichum spp., P. australis, R. alba and Hosta rectifolia Nakai and consisted of 31 plots. The main difference in species composition between Groups D and E was L. sessilifolia in Group D and V. oxycoccos in Group E. Groups D and E contained fewer than 20 plots each.
Groups A and B were categorized as R. alba sedgeland and P. australis marsh, respectively (Table 1). C. middendorffii was also established well in Group B. Groups C, D and E were dominated by C. middendorffii. The differences among these three Groups were as follows: Polytrichum spp. showed high cover in Group C, which had the highest species richness. P. australis and R. alba were not established in Groups D and E. L. sessilifolia, and Empetrum nigrum L. were established well in group D. Group E was distinct from Group D by the presence of V. oxycoccos.
The species richness averaged 5.1 in Group A and 4.5 in Group B (P. australis marsh) (Table 1). Species richness was lower in Group B than in Group C (GLMM, p < 0.01). Apart from this, species richness did not differ between Group B and the other Groups. Group B had a lower H’ than Groups A and C but higher than group D (p < 0.01). H’ did not differ between Groups B and E. J’ did not differ among the Groups.
Because most plots in Group B were established in the boundaries (Figure 3), only Group B presented a positive distance from the boundaries (Table 1). The other groups were developed outside of P. australis marsh. Group C was established close to the boundaries, whereas Group E was farther away (Figure 3). Group D was found at an intermediate distance from the boundaries, between Groups C and E. P. australis marsh established a few on the outside of boundaries, while Groups A and C sometimes developed inside. Groups D and E were established only outside.
The stress of NMDS was 0.140. P. australis showed a tendency to thrive in association with Myrica gale L., Sanguisorba tenuifolia Fisch. ex Link, Rubus chamaemorus L., M. japonica, Eriophorum vaginatum L. and Chamaedaphne calyculata (L.) Moench. Ericaceous species and carnivorous species, which preferred bogs, were found exclusively in P. australis marshes (Figure 4).
3.3. Seed Bank
Eight species, including one identified species, were recorded in the seed bank (Table 2). All these species were also present in the standing vegetation. The number of seedlings that emerged from peat samples was 337 in the fall and 415 in the spring. These were equivalent to 1852/m2 and 2280/m2 in 2016 and 2017, respectively. M. japonica was the dominant species in the seed bank for both fall and spring, followed by L. sessilifolia. Except for M. japonica, the seed banks exhibited germination patterns biased toward either spring or fall. P. australis seeds germinated only in the fall, indicating that this species developed a transient seed bank. Based on the seasonality of seed germination, the other species developed persistent seed banks. P. australis seeds germinated more inside the P. australis marsh (hurdle model, p < 0.01 at binomial term).
3.4. Environments in the Inside and Outside of Marsh
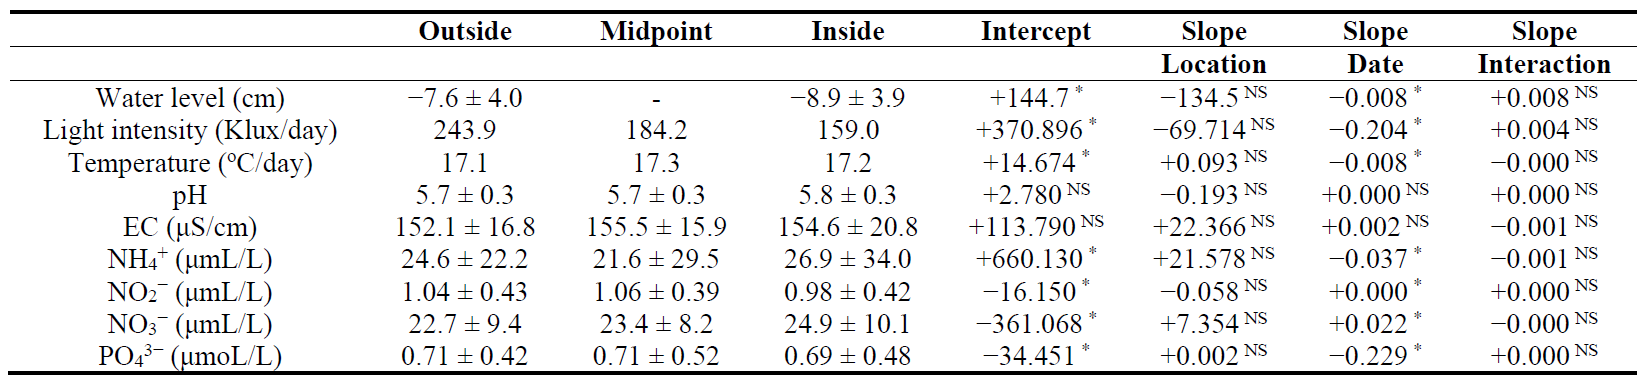
Cumulative light intensity decreased from June to October over the two-year period, likely due to the expansion of leaf foliage. Light intensity did not vary among the three locations, inside, midpoint and outside, and dates (Table 3), possibly because the shade by P. australis on inside the boundaries was similar to that of other species outside the boundaries.
The mean daily temperatures ranged from a minimum of 3.0 °C to a maximum of 27.7 °C during the surveyed periods over the two years. Temperatures increased from May to August at all the locations and then decreased until October. There were no significant temperature differences among the locations, regardless of the dates (Table 3), indicating that P. australis shoots influenced ground surface temperatures similarly to the other species outside the boundaries.
Peat moisture increased from the outside to the inside of the boundaries (GAM, p < 0.01) (Figure 5), although it showed highly variable. The average water level was −8.2 ± 4.0 cm (range: −17.1 cm to −0.5 cm) over the two years, with no significant differences between the inside and outside of P. australis marshes (Table 3).
The pH ranged between 4.9 and 6.5 during the surveyed period (Table 3). EC ranged from 102.5 μS/cm to 221.0 μS/cm and did not differ significantly among locations and dates (p > 0.01). All measured chemical properties, including nitrogen and phosphorous components, in the peat-pore water showed no significant differences among locations (p > 0.05) (Table 3), although they exhibited seasonal fluctuations (p < 0.01 for all chemicals). These results indicated that the chemical properties, including pH and EC, were not significantly influenced by the establishment of P. australis.
Table 1. Vegetation characteristics on the six cluster groups (A to E) classified by TWINSPAN in 150 1 × 1 m plots established on a peatland mined in 1972, Sarobetsu mire, measured in the summer of 2017. The number of plots in each cluster group is shown in parenthesis to the right of each cluster code. Means are presented with standard deviations for environmental factors or with frequencies for species. +: less than 0.1% cover. -: not recorded. Differences in diversity and distance between the cluster groups are compared from group B (P. australis marsh) to each of the others by GLMMs. ∗∗: significantly different at p < 0.01. ∗: p < 0.05. NS: not significant. For group B, the letters indicate the significance of intercepts.
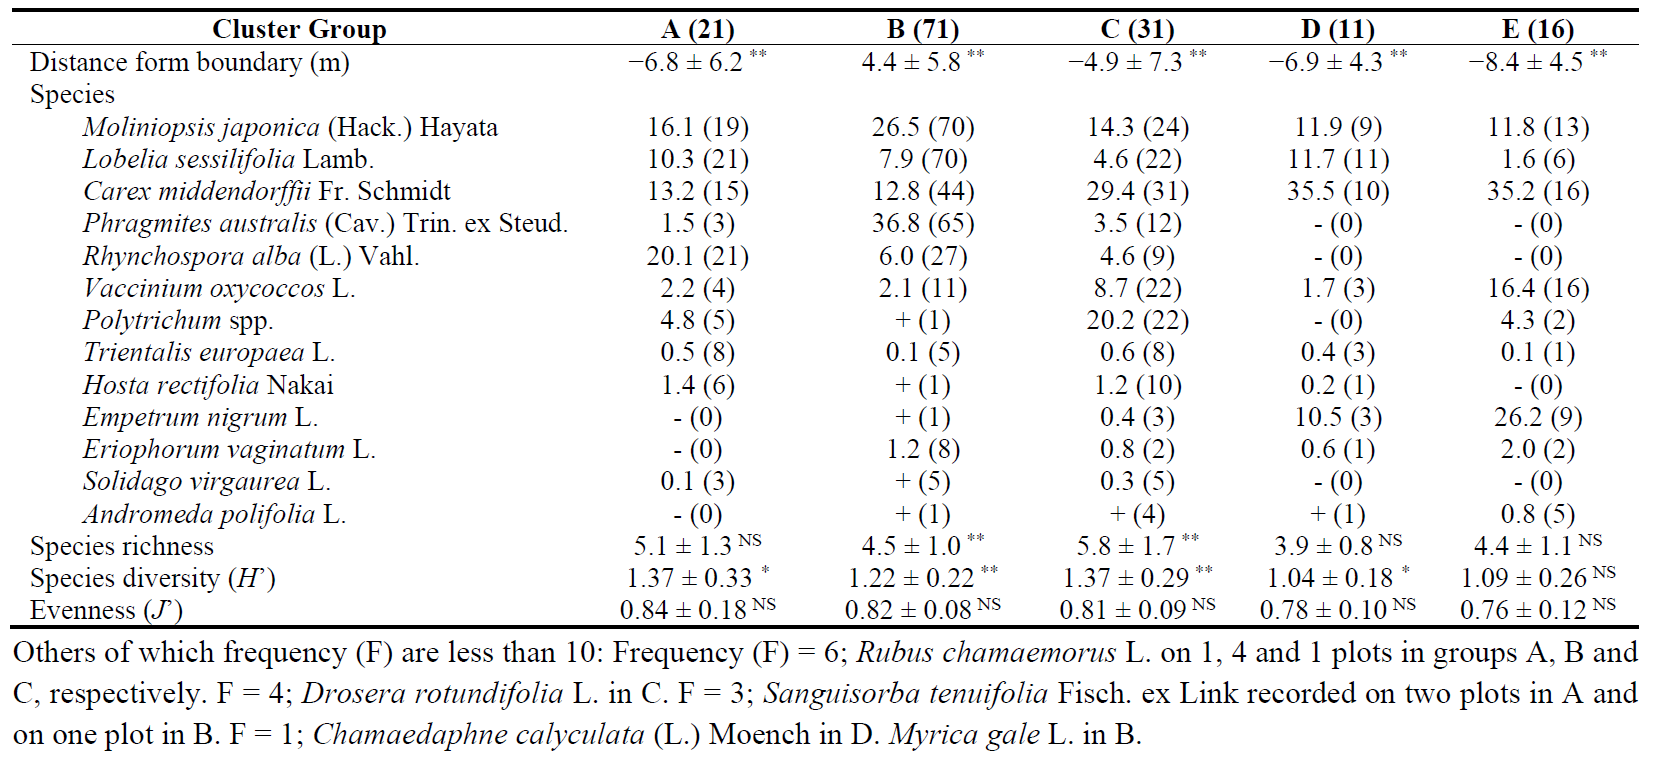
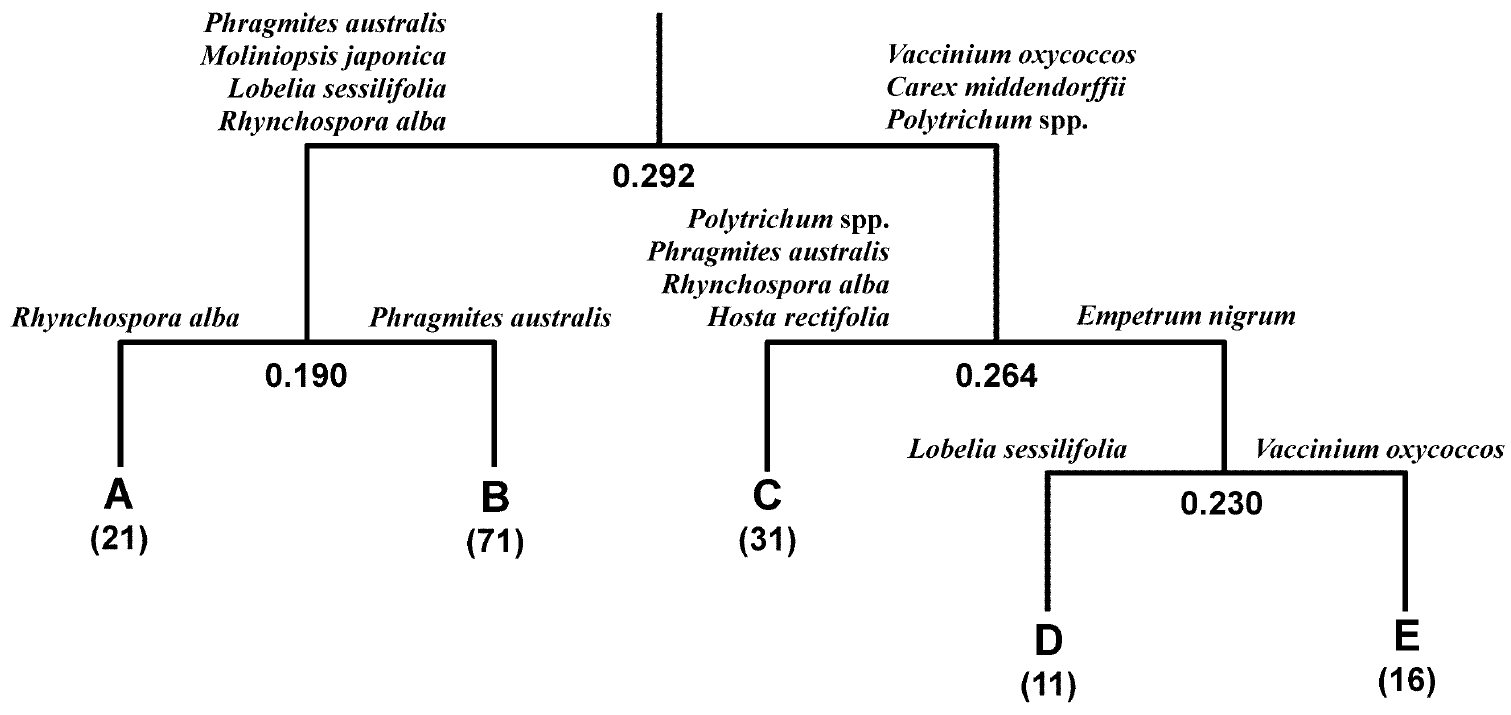
Figure 2. Clustering groups obtained by TWINSPAN by 150 1 m × 1 m plots in a post-mined peatland, Sarobetsu mire, in the early summer of 2017 in relation to the establishment of <i>Phragmites australis</i> marshes.
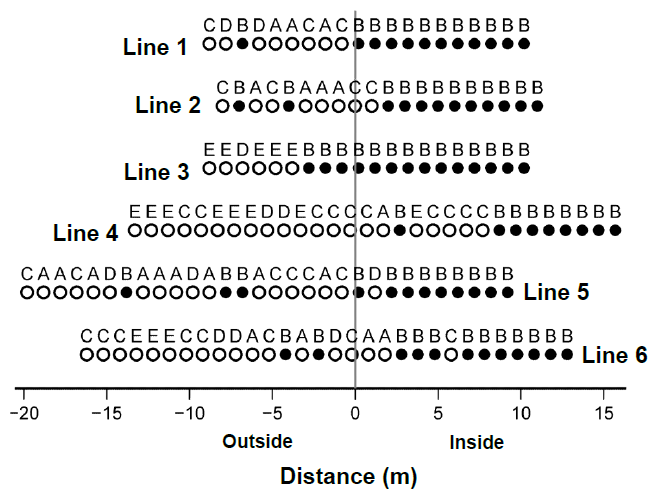
Figure 3. Distribution of TWINSPAN cluster groups A to E along Lines 1 to 6. Cluster group codes are shown above the circles. <i>Phragmites australis</i> marsh (Group B) is represented by solid circles, while the other groups are represented by open circles. A vertical grey line indicates the boundaries of <i>P. australis</i> marshes (0 m), with negative values representing the outside and positive values representing the inside on each line.
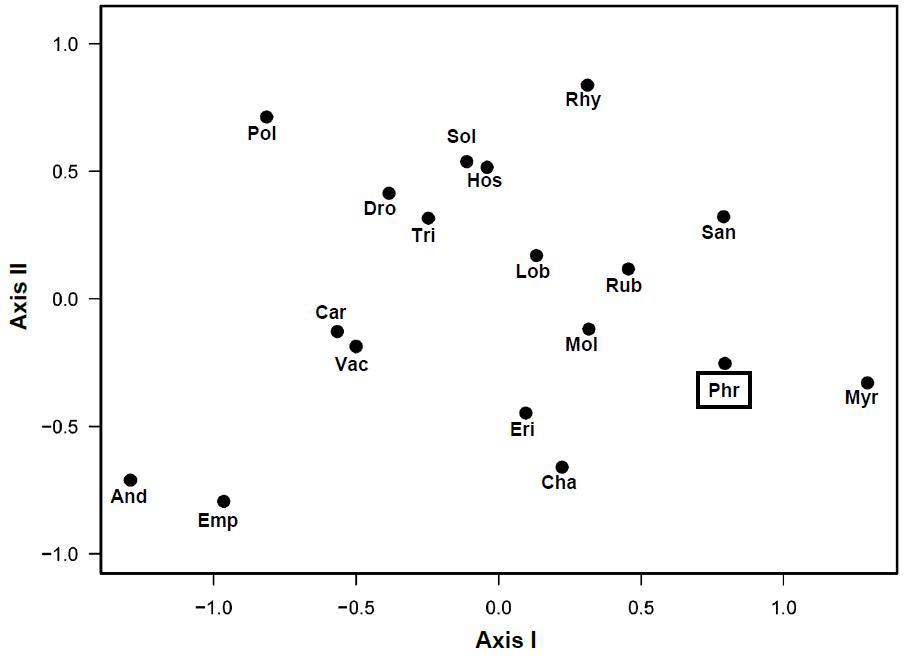
Figure 4. Species scores on the two axes of NMDS, based on plant cover in 150 plots on the post-mined peatland, Sarobetsu mire, in 2017. Species codes are created by the first three letters of genus names. Refer to Table 1 for the full scientific names. <i>Phragmites australis</i> (Phr) is enclosed by a square.
Table 2. Composition of the seed bank in fall 2016 and spring 2017. The effects of season and distance from the boundary of P. australis mashes are analyzed by hurdle models for each species. The terms, Binomial and Poisson refer to the respective components of the hurdle models. All model intercepts are significant at p < 0.01. Numerals indicate the model estimates (slopes). When zero seedlings are recorded, the effects are not examined. -: not examined. Distance: distance from the boundary of P. australis marsh. Negative and positive values indicate locations outside and inside the boundaries, respectively. ∗: significant at p < 0.01. NS: not significant.
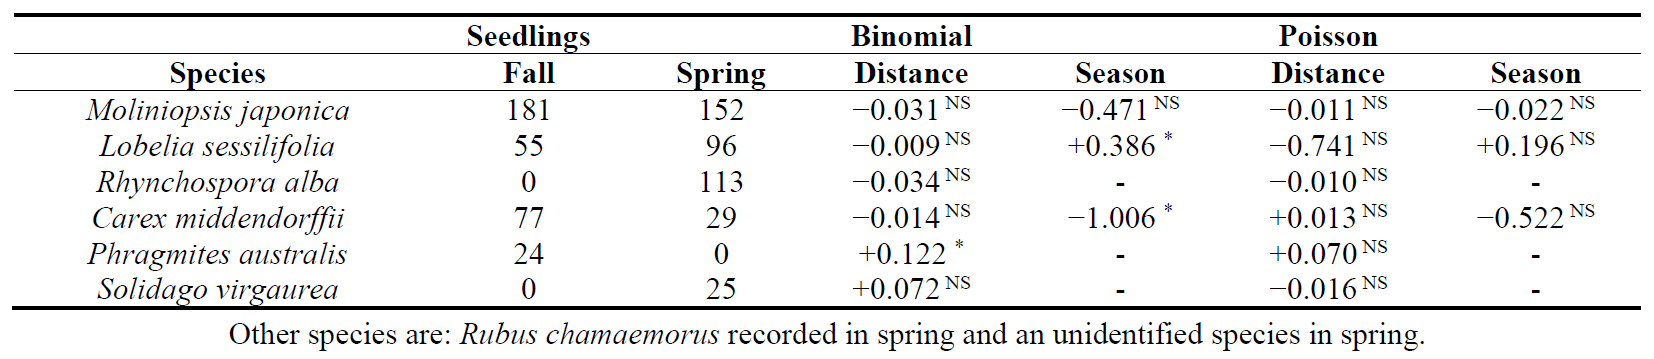

Figure 5. Relative photosynthetic active radiation (Relative PAR, %) and peat moisture (%) measured from 2016 to 2017 in relation to distance from the boundary (0 m) of <i>Phragmites australis</i> marsh. The splicing lines are obtained by generalized additive models (<i>p</i> < 0.01). Note that the range of peat moisture on y-axis differs between the left and right panels. The right panels display only the predicted lines. Each panel numeral indicates the surveyed periods: (1–6) May to October 2016, (7–12) May and July to October 2017.
Table 3. Mean water chemistry in the outside, midpoint and inside Phragmites australis marshes during snow-free periods in 2016 and 2017. The midpoint refers to the midpoint on each transect line. Differences are compared from the inside to the outside of P. australis marsh by GLMMs. ∗: significantly different at p < 0.01. NS: not significant. Due to a few sensors broken or lost by mammalian activities, the mean was calculated by data when all the loggers were functioned. -: not measured.
4. Discussion
4.1. Vegetation Boundaries
The boundaries of P. australis marshes showed little to no changes across all transect lines, suggesting that P. australis occasionally unchanged its distribution. To understand this stable boundary, the seed and vegetative reproduction of P. australis should be considered [25].
The seeds did not immigrate outside the P. australis marsh, while seed reproduction plays a role in long-distance dispersal in the Lawrence River valley, eastern Canada [8] and in an estuary, Mayland, USA [26]. The trajectories of wind seed dispersal, such as for P. australis, are influenced by topography, including shoot shields [27], which seems to restrict seed dispersal within the marsh. Additionally, seed dispersal distance decreases with increasing seed weight and decreasing shoot height [28]. P. australis produces the largest seeds among the dominant species in the post-mined peatland and the tallest shoots [13]. The seed dispersal of P. australis appears to be determined by a balance between large seeds and tall shoots. Long-distance horizontal movement of seeds after dispersal is unlikely because most seeds settle into litter and peat [13]. P. australis did not develop a persistent seed bank in the post-mined peatland. Its seedlings establish at low water levels without prolonged submergence to grow and survive [10]. These findings suggest that seed regeneration is limited to a few years due to seed dispersal limitations and unsuitable habitats for seed germination. Except for P. australis, seed densities in the seed bank did not differ along the distance from the boundaries. This indicates that the shoots of P. australis do not function as the barrier to seed dispersal for most species. The relationships between seed and vegetative reproduction seem to be adaptable to environmental conditions, including topography.
Since P. australis seeds did not contribute to changes in the locations of boundaries, vegetative reproduction likely plays a role in the persistence of P. australis marshes. However, the immobile boundaries suggest that shoot expansion, i.e., vegetative reproduction, was slow, similar to seed reproduction. The emergence of P. australis shoots is inhibited in poorly drained habitats during the initial stages of invasion and is later facilitated by peat disturbance, rhizome burial and altered drainage [9]. The emergence of P. australis seedlings is prevented by continuous flooding, and vegetative expansion is limited at high elevations in the brackish tidal wetlands of the eastern USA [29]. In the post-mined peatland, the ground surface is inundated by melting snow in early spring, suggesting limited seed reproduction. P. australis adapts to stressful habitats through vegetative reproduction [30]. Since P. australis rhizomes are perennial [31], slow expansion by rhizomes allows the species to wait for abrupt changes, such as regime shifts [32].
Therefore, both seed dispersal (sexual reproduction) and rhizome propagation (vegetative reproduction) are expected to contribute to the maintenance of P. australis populations rather than their expansion in the studied area.
4.2. Vegetation in the Inside and Outside of Marsh
The studied area had been subjected to peat mining 34 or 35 years ago. Species diversity and composition indicate that the vegetation does not revert to its original un-mined state even several decades after mining [16]. Additionally, post-mined peatlands on raised bogs exhibit low light and peat moisture levels even 30 years after restoration efforts, such as shrub removal and drainage blocking in Switzerland [33]. These recovery patterns suggested that the areas were still stressed and disturbed.
The P. australis marsh (Group B) exhibited lower H’ compared to Rhynchospora alba sedgeland (groups A and C) but higher than those in Group D. R. alba, which dominated in Group A, is the earliest colonizer following peat mining and acts as a facilitator for subsequent colonizers [15]. Early colonizers often serve as facilitators in stressful and/or disturbed habitats [34]. The R. alba sedgeland is succeeded by M. japonica grassland as succession progresses towards Sphagnum bog [16]. High H’ in Group A is likely due to the cumulative benefits of species richness and J’; however, the species richness and J’ did not differ significantly between Groups A and B. J’ increased with the richness, suggesting that the predominance of specific species was limited in Group A, which was the most stressful and disturbed vegetation [35].
Two ericaceous species, E. nigrum and Andromeda polifolia L., were not established in Group B (P. australis marsh), whereas they were common in Groups D and E. These two ericaceous species are well-known as bog-favored species [36]. The area outside the marsh developed various vegetation types, indicating that the dominance of the marsh restricted vegetation divergence. These results suggested that the succession of post-mined peatlands did not progress towards bog vegetation when P. australis developed the grassland.
4.3. Functions of Phragmites australis
PAR was lower in P. australis marshes with seasonal fluctuations, suggesting that P. australis shoots shaded the ground surface. However, shading by P. australis shoots weakly affects the performance of cohabitants due to their late seasonal growth [37]. Consequently, temperature fluctuation patterns did not differ between the inside and outside of P. australis marshes. However, peat moisture was higher inside the marsh. These results suggest that shading increased peat moisture just below the ground surface or that evapotranspiration was lower in the P. australis marshes. The water level did not differ between the inside and outside. At various spatial scales, soil moisture is often influenced by other environmental variables, such as elevation, slope and aspect [38]. The post-mined peatland is flat; thus, the water level is weak or less affected by water chemistry and physics.
Similarly, the dynamics of P. australis in a Mediterranean marsh enclosed by dykes are stagnant or slow due to both slow vegetative growth and few opportunities for seedling establishment for 25 years [39]. P. australis marshes developed slowly or remained stagnant due to the present state's limitations of seed dispersal and rhizome elongation.
5. Conclusions
The stable or stagnant boundaries of P. australis suggest that this species has not significantly altered the marsh structure. There was no significant difference in water levels inside and outside the P. australis marshes, likely due to the flat terrain and the resultant uniform water levels. Within the marsh, P. australis does not coexist with bog-favored species, such as ericaceous and carnivorous plants, indicating that spontaneous succession to natural bogs becomes suppressed. Both seed dispersal and vegetative reproduction maintain the established P. australis marshes. Peat water chemistry did not differ between the inside and outside of P. australis marshes, suggesting that environmental manipulation is ineffective in reducing P. australis for wetland conservation and restoration.
Acknowledgments
The authors thank Li Q and Zhao X for field assistance. Ministry of the Environment of Japan and Sarobetsu Eco-Network provided the permission and support for this study conducted in the post-mined peatland. The seed bank experiments were conducted in the Center of Advanced Science and Technology, Hokkaido University.
Author Contributions
Ethics Statement
Not applicable.
Informed Consent Statement
Funding
JSPS, MEXT and Asahi Glass Foundation.
Declaration of Competing Interest
The authors declare no competing interests.
References
1.
Packer JG, Meyerson LA, Skalova H, Pysek P, Kueffer C. Biological Flora of the British Isles: Phragmites australis. J. Ecol. 2017, 105, 1123–1162. [Google Scholar]
2.
Keddy PA. Wetland ecology. In Principles and Conservation, 2nd ed.; Cambridge University Press: Cambridge, UK, 2010; pp. 1–497.
3.
Chambers RM, Meyerson LA, Saltonstall K. Expansion of Phragmites australis into tidal wetlands of North America. Aquat. Bot. 1999, 64, 261–273. [Google Scholar]
4.
Rohal CB, Hazelton ELG, McFarland EK, Downard R, McCormick MK, Whigham DF, et al. Landscape and site factors drive invasive Phragmites management and native plant recovery across Chesapeake Bay wetlands. Ecosphere 2023, 14, e4392. doi:10.1002/ecs2.4392.[Google Scholar]
5.
Uddin DN, Robinson RW. Responses of plant species diversity and soil physical-chemical-microbial properties to Phragmites australis invasion along a density gradient. Sci. Rep. 2017, 7, 11007. doi:10.1038/s41598-017-11205-0. [Google Scholar]
6.
Nishimura A, Tsuyuzaki S, Haraguchi A. A chronosequence approach for detecting revegetation patterns after Sphagnum-peat mining, northern Japan. Ecol. Res. 2009, 24, 237–246. [Google Scholar]
7.
Tachibana H, Ito K. Phytosociological studies of the Sarobetsu mire in the northern part of Hokkaido, Japan. Environ. Sci. Hokkaido Univ. 1980, 3, 73–134. [Google Scholar]
8.
Albert A, Brisson J, Belzile F, Turgeon J, Lavoie C. Strategies for a successful plant invasion: The reproduction of Phragmites australis in north-eastern North America. J. Ecol. 2015, 103, 1529–1537. [Google Scholar]
9.
Bart D, Hartman JM. Environmental constraints on early establishment of Phragmites australis in salt marshes. Wetlands 2002, 22, 201–213. [Google Scholar]
10.
Mauchamp A, Blanch S, Grillas P. Effects of submergence on the growth of Phragmites australis seedlings. Aquat. Bot. 2001, 69, 147–164. [Google Scholar]
11.
Nishimura A, Tsuyuzaki S. Plant responses to nitrogen fertilization differ between post-mined and original peatlands. Folia Geobot. 2015, 50, 107–121. [Google Scholar]
12.
Zuo X, Zhao X, Zhao H, Zhang T, Li Y, Wang S, et al. Scale dependent effects of environmental factors on vegetation pattern and composition in Horqin Sandy Land, Northern China. Geoderma 2012, 173–174, 1–9. [Google Scholar]
13.
Egawa C, Tsuyuzaki S. The effects of litter accumulation through succession on seed bank formation for small- and large-seeded species. J. Veg. Sci. 2013, 24, 1062–1073. [Google Scholar]
14.
JMA (Japan Meteorological Agency). Download Past Climatological Data. 2024. Available online: https://www.data.jma.go.jp/gmd/risk/obsdl/ (accessed on 30 June 2024).
15.
Egawa C, Koyama A, Tsuyuzaki S. Relationships between the developments of seedbank, standing vegetation and litter in a post-mined peatland. Plant Ecol. 2009, 203, 217–228. [Google Scholar]
16.
Nishimura A, Tsuyuzaki S. Effects of water level via controlling water chemistry on revegetation patterns after peat mining. Wetlands 2014, 34, 117–127. [Google Scholar]
17.
Hotes S, Grootjans AP, Takahashi H, Ekschmitt K, Poschlod P. Resilience and alternative equilibria in a mire plant community after experimental disturbance by volcanic ash. Oikos 2010, 119, 952–963. [Google Scholar]
18.
Kimura H, Tsuyuzaki S. Fire severity affects vegetation and seed bank in a wetland. Appl. Veg. Sci. 2011, 14, 350–357. [Google Scholar]
19.
Ekstam B, Johannesson R, Milberg P. The effect of light and number of diurnal temperature fluctuations on germination of Phragmites australis. Seed Sci. Res. 1999, 9, 165–170. [Google Scholar]
20.
Oksanen J. R Package for Two-Way Indicator Species Analysis (Hill 1979). 2019. Available online: https://github.com/jarioksa/twinspan.git (accessed on 30 June 2024).
21.
von Wehrden H, Hanspach J, Bruelheide H, Wesche K. Pluralism and diversity: Trends in the use and application of ordination methods 1990–2007. J. Veg. Sci. 2009, 20, 695–705. [Google Scholar]
22.
Dexter E, Rollwagen-Bollens G, Bollens SM. The trouble with stress: A flexible method for the evaluation of nonmetric multidimensional scaling. Limnol. Oceangr. Methods 2018, 16, 434–443. [Google Scholar]
23.
Zeileis A, Kleiber C, Jackman J. Regression models for count data in R. J. Stat. Softw. 2008, 27, 1–25. [Google Scholar]
24.
R Core Team. R: A Language and Environment for Statistical Computing; R Foundation for Statistical Computing: Vienna, Austria, 2023. Available online: https://www.gbif. org/tool/81287/r-a-language-and-environment-for-statistical-computing (accessed on 30 June 2024).
25.
Hazelton ELG, Mazdzer TJ, Burdick DM, Kettenring KM, Whigham DF. Phragmites australis management in the United States: 40 years of methods and outcomes. AoB Plants 2014, 6, plu001. doi:10.1093/aobpla/plu001.[Google Scholar]
26.
McCormick MK, Kettenring KM, Baron HM, Whigham DF. Extent and reproductive mechanisms of Phragmites australis spread in brackish wetlands in Chesapeake Bay, Maryland (USA). Wetlands 2010, 30, 67–74. [Google Scholar]
27.
Fenner M, Thompson K. The Ecology of Seeds; Cambridge Univ Press: Cambridge, UK, 2005; pp. 1–250.
28.
Soons MB. Wind dispersal in freshwater wetlands: Knowledge for conservation and restoration. Appl. Veg. Sci. 2006, 9, 271–278. [Google Scholar]
29.
Baldwin AH, Kettenring KM, Whigham DF. Seed banks of Phragmites australis-dominated brackish wetlands: Relationships to seed viability, inundation, and land cover. Aquat. Bot. 2010, 93, 163–169. [Google Scholar]
30.
Qin H, Jiao J, Li F, Zhou Y. Ecological adaptation strategies of the clonal plant Phragmites australis at the Dunhuang Yangguan wetland in the arid zone of northwest China. Ecol. Ind. 2022, 141, 109109. [Google Scholar]
31.
Mal T, Narine L. The biology of Canadian weeds. 129. Phragmites australis (Cav.) Trin. ex Steud. Canad J. Plant Sci. 2004, 84, 365–396. [Google Scholar]
32.
Folke C, Carpenter S, Walker B, Scheffer M, Elmqvist T, Gunderson L, et al. Regime shifts, resilience, and biodiversity in ecosystem management. Ann. Rev. Ecol. Evol. Syst. 2004, 35, 557–581. [Google Scholar]
33.
Frei S, Holderegger R, Bergamini A. Thirty years later: How successful was the restoration of a raised bog in the Swiss Plateau? Mires Peat 2021, 27, 20. doi:10.19189/MaP.2021. SNPG.StA.2193.[Google Scholar]
34.
Brooker RW, Maestre FT, Callaway RM, Lortie CL, Cavieres LA, Kunstler G, et al. Facilitation in plant communities: The past, the present, and the future. J. Ecol. 2008, 96, 18–34. [Google Scholar]
35.
Cook JE, Halpern CB. Vegetation changes in blown-down and scorched forests 10–26 years after the eruption of Mount St. Helens, Washington, USA. Plant Ecol. 2018, 219, 957–972. [Google Scholar]
36.
Jiroušek M, Peterka M, Chytrý M, Jiménez-Alfaro B, Kuznetsov OL, Pérez-Haase A, et al. Classification of European bog vegetation of the Oxycocco-Sphagnetea class. Appl. Veg. Sci. 2020, 25, e12646. [Google Scholar]
37.
Güsewell S, Edwards P. Shading by Phragmites australis: A threat for species-rich fen meadows? Appl. Veg. Sci. 1999, 2, 61–70. [Google Scholar]
38.
Ma KM, Fu BJ, Liu SL, Guan WB, Liu GH, Lu YH, et al. Multiple-scale soil moisture distribution and its implications for ecosystem restoration in an arid river valley, China. Land Degrad. Dev. 2004, 15, 75–85. [Google Scholar]
39.
Alvarez MG, Tron F, Mauchamp A. Sexual versus asexual colonization by Phragmites australis: 25-year reed dynamics in a Mediterranean marsh, southern France. Wetlands 2005, 25, 639–647. [Google Scholar]