Hydrogen energy holds great potential for reducing carbon emissions across the global economy [
1]. It enables the integration of clean energy in various sectors that are otherwise difficult to decarbonize, such as fuel cells for heavy-duty vehicles (trucks, ships, aeroplanes) [
2,
3,
4,
5], energy-intensive industries (iron, steel, cement) [
6,
7], and building heating [
8,
9]. Furthermore, hydrogen offers a promising solution for balancing electricity supply and demand [
10,
11], effectively utilizing excess electricity generated from renewable sources and natural gas.
The International Energy Agency projects a significant rise in global hydrogen demand, anticipating it to reach 145 million tons by 2030 and 660 million tons by 2050 [
12]. Currently, around 40 countries, which collectively account for a substantial portion of global energy sector emissions, have developed strategies or roadmaps to advance hydrogen production, storage, transport, and end-use technologies. Between 2021 and 2030, a total of 522 hydrogen projects have been announced, including 74 projects focused on hydrogen production from natural gas [
13].
Hydrogen production from natural gas is classified as either grey or blue hydrogen. Grey hydrogen is produced through the standard method of natural gas reforming, which generates greenhouse gas (GHG) emissions that are released into the atmosphere [
14]. Blue hydrogen, on the other hand, is produced using the same method but includes carbon capture and storage (CCS) technology to trap and store carbon dioxide (CO
2) emissions, thus significantly reducing its environmental impact [
15].
While there is general agreement that hydrogen can play a significant role in achieving long-term energy policy goals, a universally accepted vision for a comprehensive grey-blue hydrogen supply chain has yet to be established.However, specific case studies on hydrogen supply chains, though limited, have been explored and documented in the literature. In China, Zhang et al. [
16] investigated the grey-blue hydrogen supply system and created two long-term, multi-regional, monthly optimization models for natural gas and hydrogen supply networks. In South Korea, Lee et al. [
17] performed an economic and environmental analysis of the blue liquid hydrogen supply chain. Their base-case analyses calculated the cost and emissions associated with domestic blue hydrogen production. The most cost-effective supply chain was found to be 3.40 USD per kg of hydrogen, while the supply chain with the lowest environmental impact had emissions of 7.34 kg CO
2e per kg of hydrogen. Notably, the supply chains identified as the most cost-effective and the most environmentally friendly are not the same. In the United States, Sizaire et al. [
18] analyzed the supply chain requirements for hydrogen production from natural gas in Texas and Louisiana. Their findings indicate that by 2050, with an anticipated industrial demand of 276 TWh per year, the levelized cost of hydrogen would range between 3.2 and 3.5 USD per kg of hydrogen. The study emphasized the crucial role of large-scale hydrogen storage in balancing production with the constant industrial demand. Al Ghafri et al. [
19] conducted a thorough techno-economic assessment of the liquefied natural gas hydrogen supply chain between Australia and Japan, leveraging an established trade route between the two countries. Their research focused on blue hydrogen production, achieving a competitive total hydrogen supply cost of 2.30 USD/kg
H2 and a total emission intensity of 40 kg CO
2e per GJ. Balcombe et al. [
20] conducted a comprehensive quantification and analysis of hydrogen production supply chains sourced from natural gas in the United Kingdom. The study revealed that GHG emissions varied across different supply chains, ranging between 371 and 642 g CO
2e per kWh of hydrogen. Specifically, natural gas reforming alone resulted in emissions ranging from 23 to 150 g CO
2e per kWh of hydrogen.
This research thoroughly examines the grey and blue hydrogen supply chains, analyzing energy efficiency and emissions across all pathways. The focus is identifying bottlenecks and inefficiencies that increase emissions and energy losses. Additionally, the Dijkstra Algorithm is utilized to propose a sustainable and energy-efficient supply chain pathway for grey and blue hydrogen. The rest of the paper is structured as follows:
- Section 2—Energy Efficiency and Emissions of Processes: This section begins with an overview of the processes involved in the grey and blue hydrogen supply chains. It then introduces a general framework outlining the various pathways. Following this, the section provides a detailed analysis of the energy efficiency and GHG emissions associated with these processes, emphasizing the key bottlenecks and inefficiencies within the grey and blue hydrogen supply chains.
- Section 3—Energy-Emissions-Efficient Shortest Path: This section analyses all pathways energy efficiency, and GHG emissions in the grey and blue hydrogen supply chains. Using the Dijkstra Algorithm, the section proposes optimized supply chain pathways that improve sustainability and energy efficiency, aiming to minimize energy consumption and reduce emissions.
- Section 4—Summary and Conclusions: The final section provides a summary of the research and its key findings, addresses the limitations of the study, and outlines opportunities for future research in the field.
This section opens with an overview of the grey and blue hydrogen supply chains. It presents a general framework that outlines the various pathways within these chains, delves into a detailed analysis of energy efficiency and GHG emissions, and highlights the inefficiencies in the grey and blue hydrogen supply processes.
2.1. Overview of Processes
The supply chain for grey and blue hydrogen involves five key processes that are categorized in natural gas extraction, hydrogen production, transportation and distribution of natural gas and hydrogen, storage of natural gas and hydrogen, and end-use application of hydrogen.
2.1.1. Natural Gas Extraction
Nearly 95% of global hydrogen production stems from natural gas and coal [
21]; therefore, natural gas is pivotal in the context of hydrogen production. With its abundant supply and established infrastructure, natural gas offers a reliable and efficient pathway for scaling up hydrogen production.
Natural gas extraction is the initial step in the supply chain for grey and blue hydrogen production. This process involves locating and accessing natural gas deposits deep beneath the Earth’s surface, often within shale formations or other rock types. Extraction methods include traditional drilling and more advanced techniques like hydraulic fracturing, which involves injecting high-pressure fluid into the rock to release the gas [
22]. Once extracted, the natural gas is compressed (CNG) and transported through an extensive network of pipelines or, in the case of remote locations, is converted to liquefied natural gas (LNG) and shipped via tankers.
2.1.2. Hydrogen Production
Hydrogen production from natural gas is a multi-step process involving steam methane reforming (SMR), the water-gas shift reaction, hydrogen purification, and CCS for blue hydrogen. This sequence of processes is designed to maximize hydrogen yield while minimizing environmental impact, particularly in the case of blue hydrogen, which incorporates carbon management strategies.
The first major step, SMR, involves reacting methane (CH
4) from natural gas with steam (H
2O) under high temperatures (700–1000 °C) and pressures in the presence of a nickel-based catalyst. This reaction produces hydrogen (H
2), carbon monoxide (CO), and a smaller amount of CO
2. The primary chemical reaction can be represented as CH
4 + H
2O → CO + 3H
2 [
23]. SMR is the most common method for industrial hydrogen production due to its relatively high efficiency and abundant natural gas as a feedstock.
Following SMR, the water-gas shift reaction is employed to convert the carbon monoxide produced in the previous step into additional hydrogen and carbon dioxide. In this reaction, carbon monoxide reacts with steam over a catalyst to produce carbon dioxide and more hydrogen, according to the equation CO + H
2O → CO
2 + H
2. This step increases the overall hydrogen yield andsimplifies the subsequent purification process by converting more carbon monoxide into carbon dioxide, which can be more easily separated from hydrogen [
24].
Hydrogen purification is a step to achieve the high levels of purity required for most applications. Technologies such as pressure swing adsorption or membrane separation are commonly used to isolate hydrogen from the mixture of gases produced in the previous steps. The pressure swing absorption, for instance, works by passing the gas mixture through a series of adsorption beds that preferentially adsorb impurities under high pressure, allowing nearly pure hydrogen to pass through [
23,
24].
For blue hydrogen production, integrating CCS is essential to reduce the carbon footprint of the process. During CCS, the carbon dioxide generated from both the SMR and water-gas shift reactions is captured, compressed, and transported to storage sites. These sites are typically deep geological formations, such as depleted oil and gas fields or saline aquifers, where the CO
2 is injected and stored permanently [
25]. This step is vital for blue hydrogen, as it significantly reduces GHG emissions compared to grey hydrogen, which does not incorporate carbon capture. The implementation of CCS makes blue hydrogen a more environmentally friendly option, bridging the gap between traditional fossil fuel-based hydrogen production and the ultimate goal of green hydrogen produced from renewable sources.
2.1.3. Transportation and Distribution of Natural Gas and Hydrogen
Distribution and transportation are critical phases in the supply chain for grey and blue hydrogen, ensuring the natural gas or hydrogen reaches the following distribution point safely. Transportation facilities include pipelines (ideal for large-scale and long-distance due to their efficiency and cost-effectiveness), high-pressure tube trailers (ideal for short-distance and liquefied commodities), and tankers (ideal for long-distance and liquefied commodities) [
26].
2.1.4. Storage of Natural Gas and Hydrogen
Storage is another component in the supply chain for both natural gas and hydrogen, ensuring a steady and reliable supply to meet fluctuating demand. For natural gas, storage typically involves underground facilities such as depleted oil and gas fields, aquifers, and salt caverns [
27]. These geological formations are ideal for storing large quantities of natural gas safely and efficiently. The gas is injected into these formations during periods of low demand and withdrawn during peak demand, ensuring a consistent supply for various applications, including hydrogen production [
28].
For hydrogen, storage options include compressed hydrogen tanks, liquefied hydrogen tanks, and underground storage in salt caverns or depleted natural gas fields. Compressed hydrogen is stored in high-pressure tanks, which are suitable for smaller-scale applications and transportation. Liquefied hydrogen, stored at cryogenic temperatures, is used for long-distance transportation and large-scale storage due to its higher energy density. Underground storage, similar to natural gas, provides a large-scale solution for balancing supply and demand, particularly for industrial applications and grid energy storage [
29].
2.1.5. End-Use Application of Hydrogen
End-use applications of hydrogen, produced from natural gas, span diverse sectors, driving the transition to cleaner energy systems. In the industrial sector, hydrogen is utilized for refining petroleum, producing ammonia for fertilizers, and manufacturing chemicals [
30]. In the transportation sector, hydrogen powers fuel cell vehicles, offering a zero-emission alternative to traditional internal combustion engines [
2,
3,
4]. Hydrogen is also increasingly used in the energy sector for power generation and grid stabilization, where it can be stored and converted back to electricity to balance intermittent renewable energy sources like wind and solar [
31]. Also, hydrogen is a clean heating fuel for residential and commercial buildings [
32]. The versatility of hydrogen as a fuel and energy carrier underlines its potential to play a pivotal role in reducing carbon emissions across multiple industries and applications.
2.1.6. General Framework of Grey-Blue Hydrogen Supply Chain
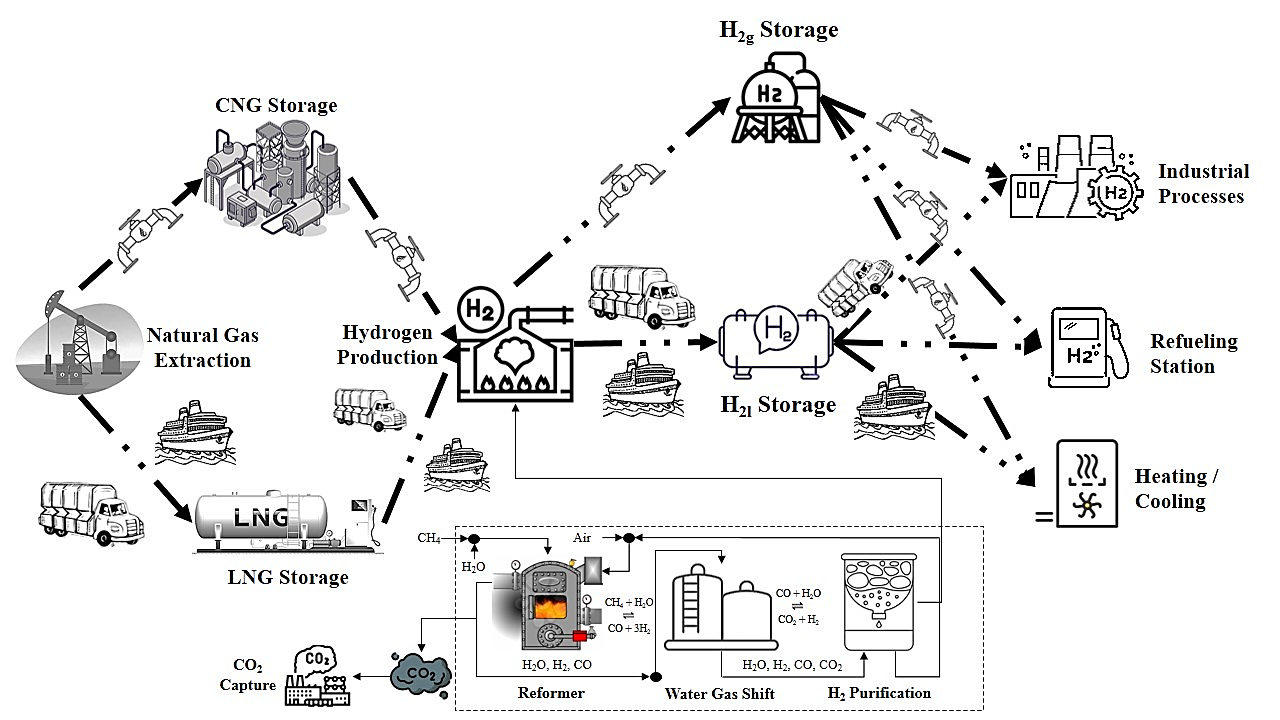
illustrates a general diagram of the grey and blue hydrogen supply chains and summarizes the operating framework of processes within the supply chain. The primary distinction between grey and blue hydrogen lies in CCS; blue hydrogen includes CCS to reduce emissions, whereas grey hydrogen does not.
. Diagram of grey-blue hydrogen supply chain.
The supply chain begins with natural gas extraction. Depending on the infrastructure and transportation distance, natural gas is either compressed or liquefied. CNG is transported via pipelines, while LNG is transported using trailer trucks or tankers for longer distances. Following extraction, natural gas is stored as needed before being transported to a hydrogen production facility. However, natural gas might be transported directly, either in gas or liquid form, to hydrogen production without previously being stored.
Once hydrogen is produced from natural gas, it is stored before being transported to end-use applications. The form in which hydrogen is produced—either gaseous or liquefied—determines its transportation method. Gaseous hydrogen is primarily transported through pipelines, whereas liquefied hydrogen is moved using trucks and tankers. This streamlined supply chain ensures the efficient production, storage, and distribution of hydrogen for various applications. Kindly note that hydrogen might be transported directly, either in gas or liquid form, to end-use without previously being stored.
2.2. Analysis of Energy Efficiency and Greenhouse Gas Emissions
The grey and blue hydrogen supply chains involve various processes that consume energy and incur energy losses. In the hydrogen supply chain from natural gas, energy consumption refers to the total amount of energy used across all stages, from extraction and production to transportation and storage. Energy losses occur when energy is wasted due to inefficiencies in these processes. Energy efficiency measures how effectively the supply chain converts input energy into useful output, with higher efficiency indicating less energy is wasted. This research merges the energy consumption and losses to compute energy efficiency, as in (1). The equation can be applied to calculate the energy efficiency across the entire supply chain, as it can be used at each stage and process. However, when applied to individual processes, the energy input for each subsequent stage should be adjusted based on the energy efficiency of the preceding process. This ensures that the efficiency losses from one stage are accounted for in the next.
Each stage within these supply chains emits GHGs, contributing to pollution and climate change to varying extents. GHG emissions in the hydrogen supply chain from natural gas are primarily composed of CO
2, CO, N
2O, and CH₄, all of which contribute to the overall carbon dioxide equivalent CO
2e footprint. Converting these GHGs into CO
2e provides a comprehensive measure of the supply chain’s environmental impact. displays the conversion metrics of the aforementioned air pollutants into CO
2e. Finally, the GHG emissions of each process are the sum of the air pollutants quantity multiplied by their equivalent in CO
2e, as in (2), where
Q is the quantity of pollutant (in g),
e is the equivalence in CO
2e,
G is the air pollutant gas, and
n is the number of different air pollutants.
. Equivalence of air pollutant in carbon dioxide equivalent.
The data extracted from various sources were carefully selected to ensure validity and coverage across different stages of the hydrogen supply chain. Data from GREET-2023 by Argonne National Laboratory (ANL) [
33] were chosen due to the model’s comprehensive and widely accepted simulation framework for assessing energy efficiency and GHG emissions, validated against real-world operational data. The model covers natural gas extraction, storage, and transportation data. Additionally, data from recent hydrogen maps [
12,
34,
35,
36] were included to provide insights into the latest technological advancements in hydrogen production and storage. The hydrogen maps complement the data from GREET by affording energy efficiency and GHG emissions of hydrogen production, mainly SMR, and hydrogen storage. The international energy reports [
37,
38,
39,
40] were selected based on their global coverage, ensuring the extracted data aligned with internationally recognized standards and benchmarks. Finally, the peer-reviewed publications [
10,
41,
42,
43,
44] provided end-of-use process-level data verified through experimental studies or field measurements.
2.2.1. Energy Efficiency of Processes
Energy losses in the grey and blue hydrogen supply chain, from natural gas extraction to hydrogen refueling stations, occur at multiple stages, each with specific efficiencies.
Firstly, during natural gas extraction and processing, machinery such as drilling rigs and pumps consume energy. This stage has an energy efficiency of about 97%, indicating that 3% of the energy is lost primarily due to the operational energy required for extraction and processing activities.
In the storage phase, both CNG and LNG incur energy losses. CNG storage facilities experience methane leakage and require energy to maintain pressure and temperature, resulting in an energy efficiency of approximately 97.9%. LNG storage, involving energy-intensive processes to maintain cryogenic temperatures, has a slightly lower efficiency of 91.5%.
Transportation of natural gas through pipelines leads to energy losses from compression and transport, with an average efficiency of 78.4%. These losses are due to the energy required for compression stations along the pipeline to maintain pressure. On the other hand, the energy efficiency from the transportation of LNG via truckers varies from 72 and 85%, while it varies from 78 to 90% via tankers.
The production of hydrogen through SMR is highly energy-intensive. Grey hydrogen production, without CCS, has an efficiency of about 72%, as a significant portion of the energy is lost as heat during the endothermic reforming process. Blue hydrogen production, incorporating CCS, has slightly lower efficiencies: 70% with 90% CCS and 71% with 60% CCS, due to the additional energy required for capturing, compressing, and storing CO
2.
In the storage and transportation of hydrogen, compressed gaseous hydrogen (CGH
2) storage exhibits an efficiency of 91.4% due to hydrogen leakage and the energy required to maintain storage conditions. Liquefied hydrogen (LH
2) storage, which involves maintaining very low temperatures, has a lower efficiency of 75%. Transportation of hydrogen by heavy-duty trucks and tankers, for both LNG and LH
2, involves energy losses from fuel consumption and boil-off, with efficiencies ranging from 72% to 90%. The additional energy used to maintain low temperatures for LH
2 further contributes to these losses.
Finally, for end-use applications, further compression and cooling of hydrogen at high pressures or to maintain liquid form demand additional energy, resulting in 82% to 95% efficiency. The cumulative effect of these inefficiencies throughout the supply chain underscores the need for technological advancements and optimization of processes to improve energy efficiency at each stage.
2.2.2. Greenhouse Gas Emissions of Processes
GHG emissions in the production and transportation of grey and blue hydrogen, from natural gas extraction to hydrogen refueling stations, are influenced by various factors at different stages.
During natural gas extraction and processing, methane leakage occurs during drilling and extraction, and GHG emissions arise from the use of machinery and flaring. This stage results in GHG emissions ranging from 0.07 to 0.08 kg CO
2e per kg of natural gas.
The storage of CNG and LNG also contributes to GHG emissions due to methane leakage and boil-off, with emissions ranging from 0.009 to 0.01 kg CO
2e per kg of CNG, and 0.008 to 0.01 kg CO
2e per kg of LNG.
Transporting CNG through pipelines results in methane leakage and CO
2 emissions from compressor stations, leading to GHG emissions of 0.004 to 0.005 kg CO
2e per kg of natural gas. On the other hand, LNG transportation emits different levels of GHG emissions between trucks and tankers. On trucks, the GHG emissions per journey vary between 0.14 and 0.15 kg CO
2e per kg, while on tankers, the GHG emissions per journey are approximately halved to 0.06 and 0.07 kg CO
2e per kg of LNG.
In the production stage, grey hydrogen is produced via SMR, which generates significant GHG emissions due to the reaction of methane with steam to produce hydrogen and CO
2. This process results in GHG emissions of 0.067 to 0.070 kg CO
2e per kg of hydrogen without CCS. Blue hydrogen production, which also uses SMR but with CCS, has GHG emissions ranging from 0.055 to 0.057 kg CO
2e per kg of hydrogen with 60% CCS, and 0.050 to 0.052 kg CO
2e per kg of hydrogen with 90% CCS.
The storage and transportation of hydrogen further contribute to GHG emissions. CGH
2 storage and LH
2 storage result in GHG emissions of 0.018 to 0.02 kg CO
2e and 0.06 to 0.07 kg CO
2e per kg of hydrogen due to hydrogen leakage and boil-off. Transporting hydrogen via pipelines, heavy-duty trucks, and tankers adds more GHG emissions. The transportation of CGH
2 via pipelines emits 0.009 to 0.010 kg CO
2e per kg per journey. For the case of LH
2, trucks emit 0.14 to 0.141 kg CO
2e while tankers emit 0.02 to 0.03 kg CO
2e per kg per journey.
Finally, the end-use application of hydrogen contributes to GHG emissions, leading to an average of 0.0017 to 0.0020 kg CO
2e per kg of hydrogen. These cumulative GHG emissions throughout the supply chain highlight the environmental impact of grey and blue hydrogen production and transportation.
2.3. Inefficiency of Processes
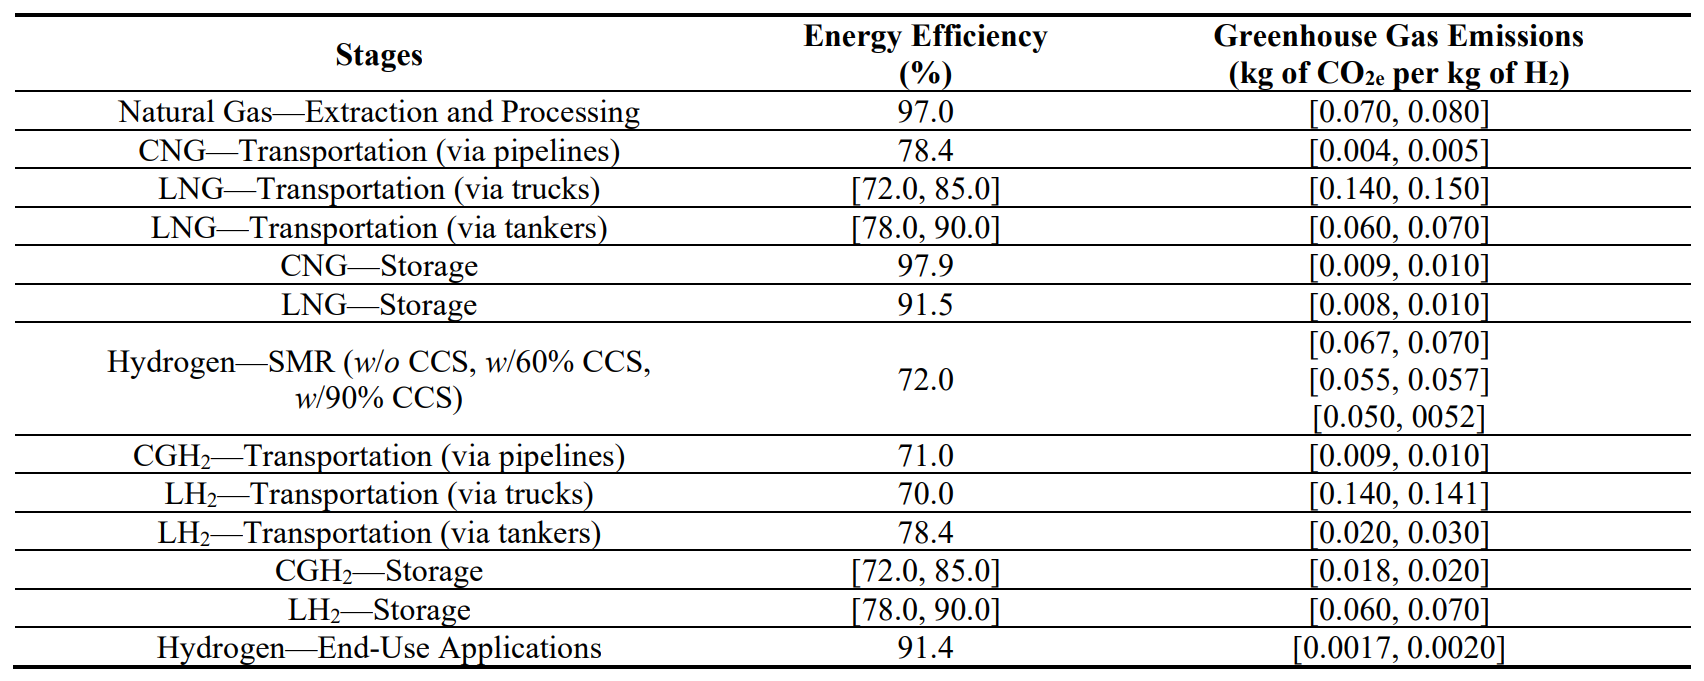
summarizes the energy efficiency and GHG emissions across various stages of the grey and blue hydrogen supply chain. Transportation, SMR, and hydrogen storage are identified as processes with significant energy consumption and losses, resulting in lower energy efficiency. Additionally, transportation via trucks and CGH
2 storage are highlighted as the highest emitting processes in the supply chain, underscoring the need for targeted improvements in hydrogen production, hydrogen storage, and transportation.
. Energy efficiency and greenhouse gas emissions of processes.
2.3.1. Inefficiency of Hydrogen Production
SMR is the most widely used technology for hydrogen production from natural gas globally [
45], despite the availability of other major methods like Auto-Thermal Reforming (ATR) and Partial Oxidation (POX) [
34,
35,
36,
37,
38,
39,
40]. In SMR, natural gas reacts with steam at high temperatures to produce hydrogen and CO
2. ATR integrates SMR with partial oxidation, enhancing thermal efficiency and reducing emissions. On the other hand, POX reacts natural gas with oxygen to produce hydrogen and CO
2 but is less efficient. Without CCS, SMR has an average energy efficiency of 72%, emitting 67 g of CO
2e per kg of hydrogen. In comparison, ATR offers slightly higher efficiency at 76% with lower emissions of 62 g CO
2e but comes at a cost up to 50% higher than SMR [
46]. With 60% efficiency, POX has the highest emissions at 80 g CO
2e [
47] and higher production cost than SMR and ATR. Considering energy efficiency, emissions, and cost, SMR remains the most preferred technology.
In literature, a few researchers have offered novel designs and techniques to improve energy efficiency and reduce the GHG emissions of SMR. Alrashed and Zahid [
48] developed a PdAu-based membrane reactor for SMR, optimized to operate at 30 bar and 550 °C. Compared to the conventional SMR process (23 bar and 900 °C), the membrane reactor showed higher methane conversion, hydrogen yield, and energy efficiency. The economic analysis revealed lower hydrogen production costs for the membrane SMR process with a 3.9% improvement in energy efficiency. Alaidaros and Al Zahrani [
49] proposed an integrated solar system to power SMR, enhancing energy efficiency by 3.3% and reducing GHG emissions by 19.4%. However, this approach increases production costs by 4.8%. The effectiveness of these improvements depends on the sizing and capacity of the renewable energy system used. Secondary techniques include the use of catalytic porous foam in reactive flows [
50], mid-temperature chemical looping [
51], bi-functional catalysts [
52,
53], non-thermal plasma [
54], and enhanced thermo-chemicals [
55,
56]; the aforementioned secondary techniques does not exceed 3.0% energy efficiency improvement and 15% reductions in GHG emissions.
2.3.2. Inefficiency of Hydrogen Storage
Hydrogen storage technologies include CGH
2 and LH
2. CGH
2 stores hydrogen at high pressures, typically around 350–700 bar, with an energy efficiency of up to 85% and low GHG emissions of around 18–20 g CO
2e per kg of hydrogen due to relatively simple compression processes. LH
2 involves cooling hydrogen to cryogenic temperatures (−253 °C), achieving energy efficiency of approximately 78–90% but with higher GHG emissions, around 60–70 g CO
2e per kg of hydrogen, due to the energy-intensive liquefaction process. While CGH
2 is generally more efficient and less emission-intensive, LH
2 allows for higher energy density and longer-term storage, making it suitable for applications requiring large storage volumes.
Recently, hydrogen storage has attracted researchers’ attention due to the topic’s verge and opportunity. Primary solutions to the increase of energy efficiency and reduction in GHG emissions of hydrogen storage include new cooling structures [
57,
58,
59], better operation control [
60], various gas pressure and operating parameters [
61], and improved oxygen resistance [
62]. In new cooling structures, Zhu et al. [
58] achieved maximum energy efficiency improvement for the least GHG emissions by integrating nano-Ni catalysts for efficient sold-state hydrogen storage in magnesium. For better operation control, Ma et al. [
60] introduced a straightforward strategy for controlling power and hydrogen flow tailored to operational characteristics. They also implemented a hybrid hydrogen storage system with high- and low-pressure components, optimized based on the compressor map, to enhance the efficiency of compressed hydrogen storage by 4.1%, hence reducing GHG emissions by approximately 2 g CO
2e per kg of hydrogen stored. For the effect of gas pressure and operating parameters, Bowen et al. [
61] altered cushion gas pressure to allow more storage capacity by 41% for a quarter more energy input. Results reveal better efficiency by nearly 7.2% and less GHG emissions by approximately 4 g CO
2e per kg of hydrogen stored. Xu et al. [
62] developed graphite- and Ni-coated hydrogen storage alloys for improved oxygen resistance. The Ni-coated alloys demonstrated significantly improved oxygen resistance, achieving excellent performance with adequate Ni loading. Additionally, these materials showed improved hydrogen storage capacity and kinetics.
2.3.3. Inefficiency of Trucks Transportation
Transporting hydrogen via trucks, practical for LH
2, is energy-intensive and less efficient compared to other transportation methods. Truck transportation also results in higher GHG emissions, typically averaging at 14 g CO
2e per kg of hydrogen, primarily due to the use of diesel oil. Jelti and Saadani [
63] suggested the use of alternative powertrains such as hybrid, battery-electric, and fuel-cell trucks. In a comparative well-to-wheel study of diesel and alternative fuel trucks, results revealed an energy efficiency of 19% for hybrid trucks, 26% for battery-electric trucks, and 22% for fuel-cell trucks and a reduction in GHG emissions for hybrid trucks up to 40%.
2.3.4. Summary of Inefficiency in Processes
A review of emerging hydrogen production, storage, and truck transportation technologies highlights significant opportunities for enhancing energy efficiency and reducing environmental impacts within the grey-blue hydrogen supply chain. Advances in hydrogen production using SMR can lead to a 3.9% improvement in energy efficiency and a 19.4% reduction in GHG emissions. Optimizing cushion gas pressure for hydrogen storage can boost energy efficiency by 7.2% and decrease GHG emissions by 4 g CO
2e per kg of stored hydrogen. Additionally, transitioning truck transportation to hybrid or fully electric powertrains can achieve energy efficiencies exceeding 19% and reduce GHG emissions by up to 40%.
The following section studies the energy efficiency and emissions of the pathways within the grey-blue hydrogen supply chain. It suggests the energy-emissions-efficient shortest path using the Dijkstra Algorithm. The aforementioned inefficient processes are avoided in the algorithm.
The energy-emissions-efficient shortest path proposes optimized supply chain pathways given maximum energy efficiency and minimum greenhouse emissions. The section begins with an integration of the Dijkstra Algorithm. Second, the possible pathways within the grey and blue hydrogen supply are analyzed in terms of total energy efficiency and emissions. Finally, the shortest path of the supply chain is determined.
3.1. Dijkstra Algorithm
This sub-section provides a conceptual definition, practical relevance, and mathematical formulation of the Dijkstra Algorithm.
3.1.1. Conceptual Definition
Dijkstra Algorithm is a classic graph search algorithm designed to find the shortest path from a single source vertex to all other vertices in a weighted graph, where the weights on the edges represent the cost or distance between the nodes. Developed by Edsger W. Dijkstra in 1956, the algorithm iteratively selects the vertex with the smallest known distance, updates the shortest paths to its neighboring vertices, and continues this process until all vertices have been processed [
64]. Dijkstra Algorithm has been widely applied across various fields, including network routing to determine the most efficient data paths [
65], transportation planning for optimal route finding [
66], robotics for path planning and navigation [
67], and geographic information systems for mapping and geospatial analysis [
68]. Because of its efficiency, reliability, and flexibility, the Dijkstra Algorithm is a preferred technique for shortest-path problems in comparison with other algorithms and techniques.
The bi-objective Dijkstra Algorithm extends the classical version by optimizing two conflicting objectives simultaneously. This multi-criteria approach is essential in scenarios where a single objective optimization does not suffice to capture the complexity of decision-making. The bi-objective algorithm employs Pareto efficiency concepts to identify a set of optimal solutions, known as the Pareto front, where no other solution can improve one objective without worsening the other. In practice, this algorithm is utilized in areas where trade-offs between different performance metrics are crucial.
Standard and bi-objective Dijkstra Algorithms are most commonly applied in the single-source shortest path problem, where the goal is to find the shortest path from a single source vertex to all other vertices in the graph. They can also be adapted for pair-source problems, where the shortest path between two specific nodes is sought, and for multiple-source scenarios, where shortest paths from multiple starting points to a common target are required. Additionally, they can handle single-sink problems, where the objective is to find the shortest paths from all nodes to a single destination node [
69].
3.1.2. Practical Relevance
The current research uses the bi-objective Dijkstra Algorithm, adapted to handle the dual objectives of energy efficiency and GHG emissions in the grey-blue hydrogen supply chain. This single-source-sink algorithm calculates the optimal path from one starting point (the extraction site) to one endpoint (the final application site).
In the literature, the bi-objective Dijkstra Algorithm has been utilized in a similar manner to address dual objectives, such as optimizing both energy efficiency and emissions in various applications. Wang et al. [
70] applied the bi-objective Dijkstra Algorithm to optimize the coal supply chain with a focus on enhancing energy efficiency and reducing GHG emissions. Their findings demonstrated a 27.4% improvement in energy efficiency and a significant reduction in air pollutant emissions by up to 55.6% within the coal transportation industry. Shi et al. [
71] utilized the bi-objective Dijkstra Algorithm in sustainable cold chain logistics to balance energy efficiency and GHG emissions across multiple route choices. Experimental validation demonstrated the algorithm’s robustness and effectiveness in optimizing these conflicting objectives, ensuring a more sustainable and efficient logistics operation.
Despite its effectiveness in solving multi-criteria optimization problems, Shun-Xi [
72] and Shra et al. [
73] mentioned the limitations and challenges that the bi-objective Dijkstra Algorithm faces. One of the primary issues is the increased computational complexity compared to the single-objective version, as it must simultaneously evaluate and maintain multiple Pareto-optimal solutions rather than a single shortest path. This complexity can lead to higher memory and processing requirements, especially in large-scale networks or scenarios with conflicting objectives. Furthermore, the algorithm may struggle with dynamic or uncertain environments where input parameters, such as edge weights, can change over time, requiring frequent re-evaluation of the optimal paths. Finally, the bi-objective Dijkstra Algorithm has proved to be impractical for multiple-source-sink case studies.
3.1.3. Mathematical Modeling
The grey-blue hydrogen supply chain represents a small-scale network with two primary objectives: maximizing energy efficiency and minimizing GHG emissions. It operates in a static environment where input parameters remain constant, and the network structure involves a single-source to single-sink configuration. Given these characteristics, the bi-objective Dijkstra Algorithm is well-suited for identifying the energy-emissions-efficient shortest path within this supply chain.
The directed graph (
G) includes a set of nodes (
V) and a set of edges (
E), as in (3). The directed graph has a single source node (
s) and a single sink node (
f), as represented in (4); the source node and target node are the natural gas extraction point and the end-use application point, respectively. Each vertex
v is connected to at least one other vertex
u in
G. The nodes are weighted as in (5) in terms of energy efficiency,
m1(
v) and GHG emissions,
m2(
v). On the other hand, the edges between the nodes are also weighted as in (6) in terms of energy efficiency,
w1(
u,
v), and GHG emissions,
w2(
u,
v).
Given a path (
psf) from source node
s to final node
f, the objective is to maximize energy efficiency and minimize GHG emissions, as represented in (7) and (8), respectively. To balance both objectives, a weighted sum approach is adopted in (9), where
α and
β are weighting factors that determine the relative importance of each objective. In the current paper, energy efficiency and GHG emissions are equally important; thus, the weighting factors are equal.
Objective function:
The algorithms start with an initialization phase. Counter variables of energy efficiency (
c1) and GHG emissions (
c2) between nodes and edges are initiated as in (10). The counts are assigned the weight of the starting vertex
m(
s). The other nodes are given various distances with an unknown number of nodes, as in (11). Finally, a priority queue
Q is created to store vertices based on their
m1 and
m2 values.
Initialization:
In the main loop, while
Q ≠
∅, the node
u with the smallest distance from
Q is extracted. For each neighbor
v of
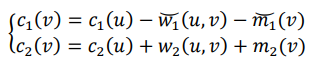
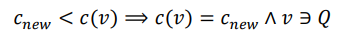
u, a new distance is calculated as in (12). The Breve symbol above efficiencies is the complement, where it should be subtracted from the source efficiency to compute final energy efficiency. The given equation for computing energy efficiency is an alternative to (1). For example, consider a scenario where the energy efficiency of the source vertex is 98%, the efficiency of the subsequent vertex in the queue is 90%, and the efficiency of the connecting edge is 80%. The complement, or inefficiency, of the next vertex is 10%, and the inefficiency of the connecting edge is 20%. This results in a total energy efficiency drop of 30% from the source vertex, leading to an overall efficiency of 68%. In contrast, the calculation of GHG emissions is additive, where emissions from the source, vertices, and edges accumulate along the path, contributing to the total emissions without any reductions. Then, for all
cnew <
c(
v), an update of the energy efficiency and GHG emission counters takes place, and
v is inserted into
Q, as represented in (13) within the main loop. After the main loop completes, the path from
s to
f is constructed by tracing the predecessor nodes.
Loop (while Q ≠ ∅):
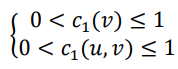
The objective function must satisfy three constraints. First, nodes and edges’ energy efficiency must vary between 0 and 1, as in (14). Second, the assigned value of the GHG emissions of nodes and edges must be equal to or larger than 0, as in (15). Third, the algorithm must always proceed in the direction of the supply chain, as in (16).
Constraints:
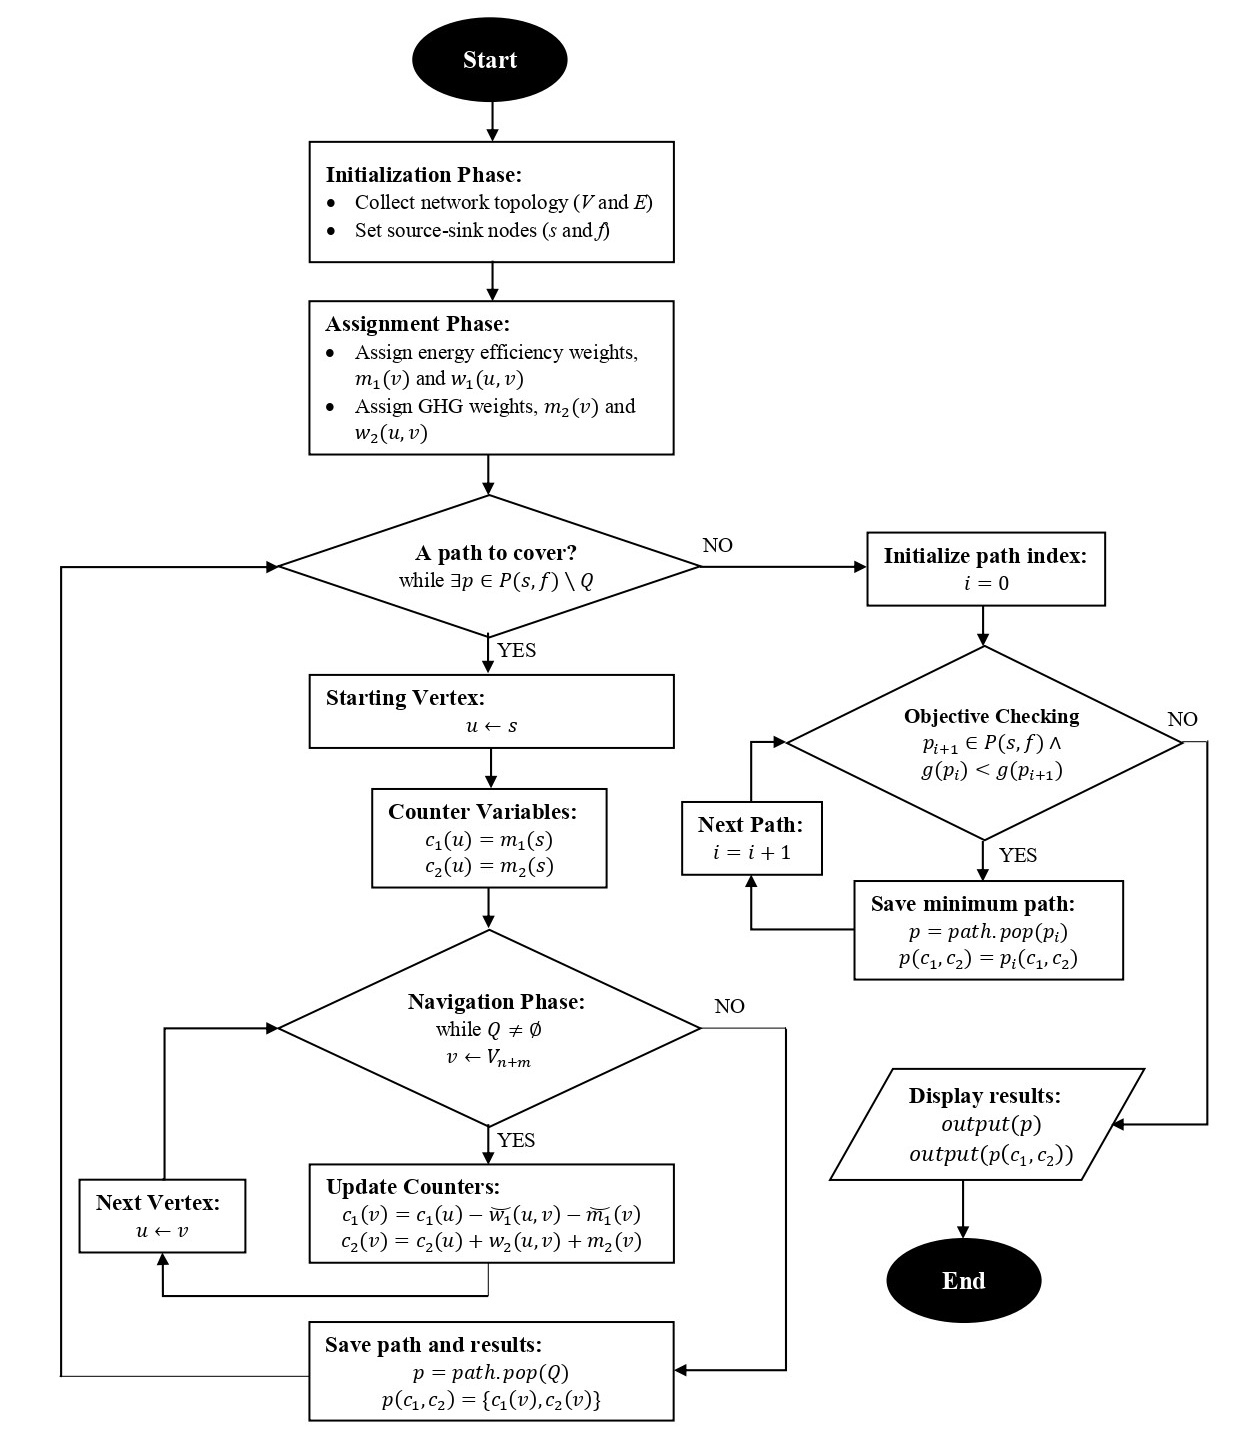
After covering all paths, the algorithm goes analyzes the energy efficiency and GHG emissions of each path within the grey-blue hydrogen supply chain and displays the path with the optimal energy efficiency and GHG emissions. Figure 2 displays the flowchart of the bi-objective Dijkstra algorithm for the energy-emissions-efficient shortest path.
. Algorithm Flowchart of Energy-Emissions-Efficient Shortest Path.
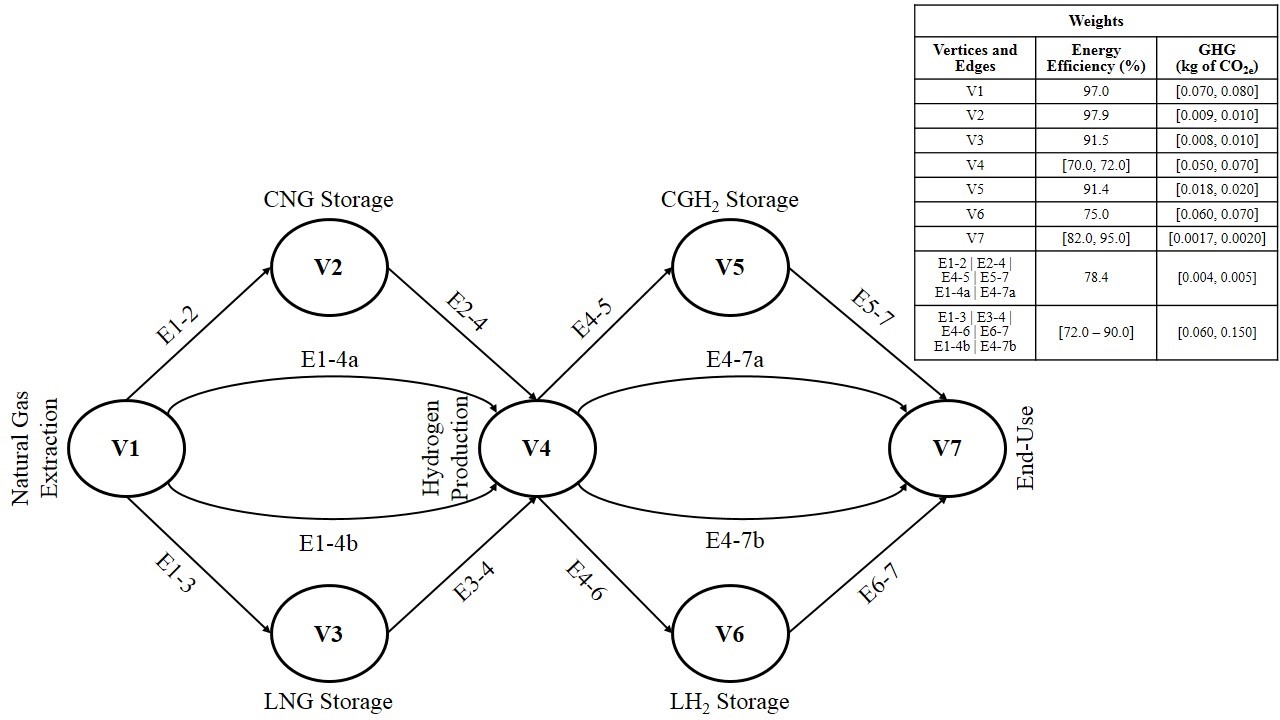
To analyze all possible pathways within the grey and blue hydrogen supply chains, it is essential to represent the supply chain processes and pathways using nodes and edges, as shown in . The vertices (nodes) and edges are assigned weights based on their energy efficiency and GHG emissions. The edges specifically account for the energy efficiency and GHG emissions associated with the transportation between vertices. Some edges, such as E1-4 and E4-7, are redundant because natural gas can be transported directly to hydrogen production without prior storage. E1-4a represents the logistics’ energy efficiency and emissions for compressed natural gas, while E1-4b is for liquefied natural gas. Similarly, E4-7a is for compressed gaseous hydrogen, and E4-7b is for liquefied hydrogen.
. Representation of grey-blue hydrogen supply chain in algorithmic nodes and edges.
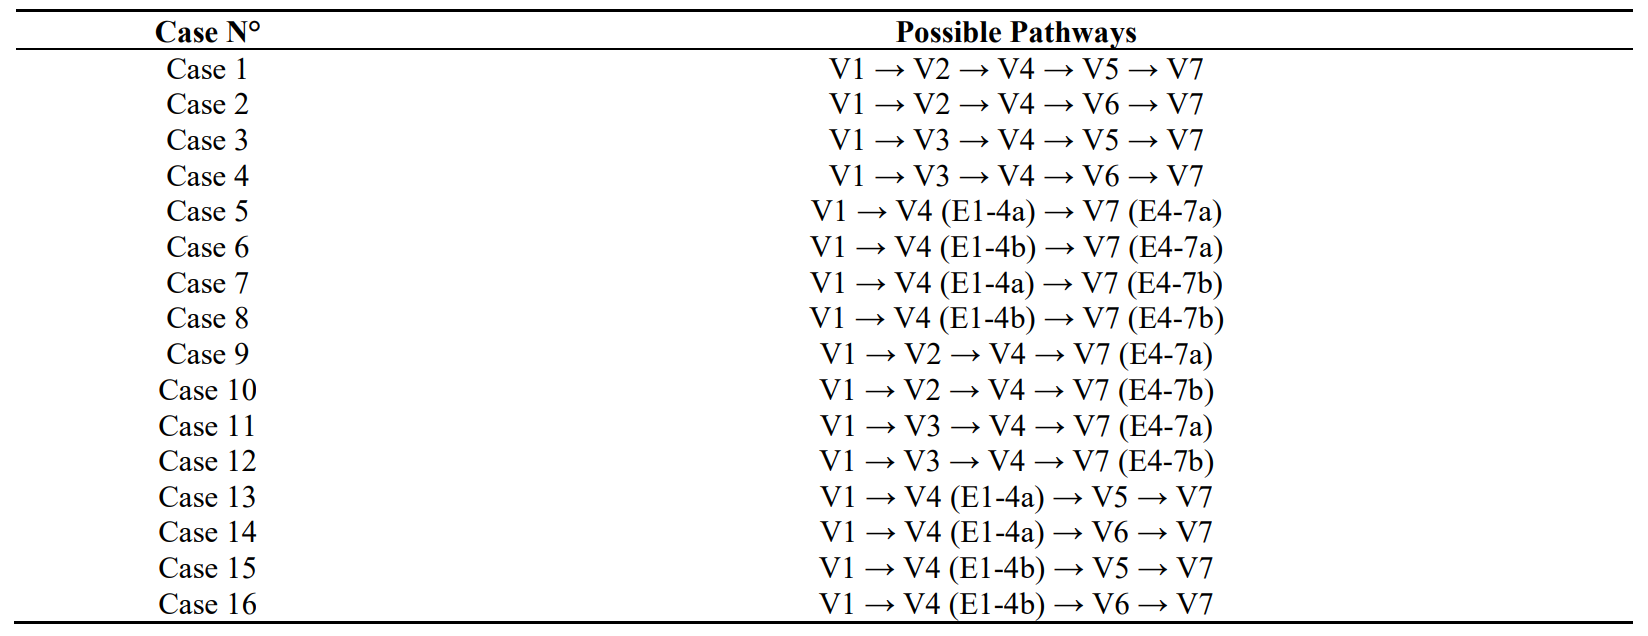
represents the possible pathways in the grey-blue hydrogen supply chain. There exist 16 possible pathways from natural gas extraction to end-use application. Pathways include producing and transporting natural gas and hydrogen in a gaseous and liquid state with storage and without storage.
. Possible pathways in the grey-blue hydrogen supply chain.
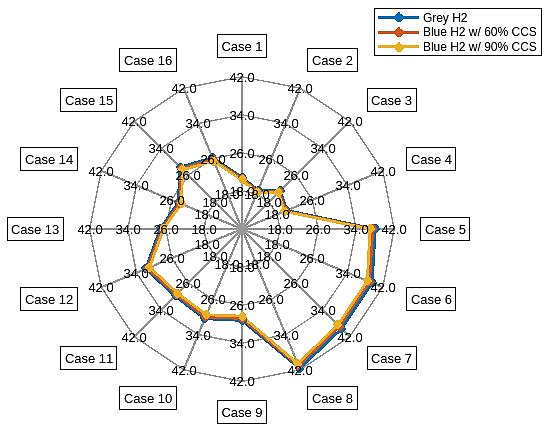
Each of the listed pathways has a distinct energy efficiency and GHG emissions. illustrates and compares the average energy efficiencies of the possible pathways within the grey and blue hydrogen supply chains. The grey hydrogen supply chain demonstrates higher energy efficiency compared to blue hydrogen, indicating that CCS reduces energy efficiency across all cases and pathways. The energy efficiency of the supply chain varies from 18.3% to 41.7% across different pathways. The highest energy efficiency is observed in Case 8, with efficiencies of 41.7% for grey hydrogen, 41.1% for blue hydrogen with 60% CCS, and 40.6% for blue hydrogen with 90% CCS. Conversely, the lowest energy efficiency is observed in Case 2, with efficiencies of 18.8% for grey hydrogen, 18.6% for blue hydrogen with 60% CCS, and 18.3% for blue hydrogen with 90% CCS. These results are logical; fewer processes result in higher energy efficiency.
. Energy efficiency of pathways in the grey-blue hydrogen supply chain.
, on the other hand, illustrates and compares the average GHG emissions associated with various pathways in the grey and blue hydrogen supply chains. As anticipated, blue hydrogen exhibits lower GHG emissions than grey hydrogen due to the incorporation of CCS. The range of GHG emissions spans from 0.1514 to 0.7104 kg CO
2e per kg of hydrogen. The lowest emissions are observed in Case 5 for blue hydrogen with 90% CCS, highlighting the effectiveness of higher levels of carbon capture. In contrast, the highest emissions occur in Case 4 within the grey hydrogen supply chain.
. Greenhouse gas emissions of pathways in the grey-blue hydrogen supply chain.
Additionally, and reveal that both natural gas storage and hydrogen storage negatively impact energy efficiency and GHG emissions. Avoiding these storage steps leads to higher energy efficiency and lower emissions. This insight further emphasizes the need for a strategic approach to optimizing the hydrogen supply chain, taking into account the impacts of storage processes. By minimizing storage requirements, the supply chain can achieve better performance in terms of both energy efficiency and environmental impact.
Grey hydrogen demonstrates higher energy efficiency, whereas the blue hydrogen supply chain results in significantly lower GHG emissions. This creates an inherent trade-off between energy efficiency and GHG emissions in the hydrogen supply chain derived from natural gas. Notably, the cases with the highest energy efficiency, as shown in , do not correspond to those with the lowest GHG emissions, as illustrated in . This divergence indicates that optimizing the hydrogen supply chain requires careful consideration of both objectives. Consequently, employing a bi-objective Dijkstra algorithm to identify the energy-emissions-shortest path becomes essential. This algorithm can effectively balance the dual goals of maximizing energy efficiency and minimizing GHG emissions, providing an optimal solution for sustainable hydrogen production and distribution.
3.3. Results of Energy-Emissions-Efficient Shortest Path
The energy and emissions efficiency analysis for the shortest path reveals that the results are consistent across different hydrogen types: grey hydrogen, blue hydrogen with 60% CCS, and blue hydrogen with 90% CCS. illustrates these shortest paths. For grey hydrogen, the supply chain achieves an energy efficiency of 38.0% resulting in GHG emissions of 0.1689 kg CO
2e per kg of hydrogen at the end-use stage. With blue hydrogen featuring 60% CCS, the energy efficiency slightly decreases to 37.5%, and the GHG emissions reduce to 0.1564 kg CO
2e per kg of hydrogen in end-use. In the case of blue hydrogen with 90% CCS, the energy efficiency further drops to 36.9%, while the GHG emissions are minimized to 0.1514 kg CO
2e per kg of hydrogen at end-use.
. Energy-emissions-efficient shortest path of the grey-blue hydrogen supply chain.
As expected, the grey hydrogen supply chain’s energy efficiency is higher than that of the blue hydrogen supply chain. However, grey hydrogen also has higher GHG emissions. The results show that while liquefied natural gas and liquefied hydrogen offer the highest energy efficiency, they come with the drawback of increased GHG emissions. On the other hand, compressed natural gas and compressed gaseous hydrogen provide a slight reduction in energy efficiency but achieve nearly halved GHG emissions. Thus, for an energy-emissions-efficient shortest path in the grey-blue hydrogen supply chain, compressed natural gas and compressed gaseous hydrogen are preferable options.
Based on the results analysis, if the supply chain requires both natural gas and hydrogen storage, Case 1 emerges as the shortest path. In this scenario, energy efficiency ranges from 20.3% to 20.9%, while GHG emissions range between 0.2034 and 0.2209 kg CO
2e per kg of hydrogen. As additional processes are introduced into the supply chain, both energy efficiency decreases and GH emissions increase.
Hydrogen energy presents a transformative opportunity for reducing carbon emissions and facilitating the integration of clean energy across various sectors that are otherwise challenging to decarbonize. Its potential extends to applications such as fuel cells for heavy-duty vehicles, energy-intensive industries, and building heating. It also offers solutions for balancing electricity supply and demand through the utilization of excess renewable energy. Hydrogen production is categorized into grey and blue hydrogen, with the latter incorporating CCS to mitigate environmental impacts. Despite the recognition of hydrogen’s role in long-term energy policy, a comprehensive vision for grey-blue hydrogen supply chains remains elusive, and a study of energy efficiency and GHG emissions of processes within the supply chain is absent. Thus, the current research addresses the gap and provides a detailed analysis of energy efficiency and emissions across grey and blue hydrogen supply chains; additionally, the bi-objective Dijkstra Algorithm is used to identify the energy-emissions-efficient shortest path.
The grey and blue hydrogen supply chain encompasses five key stages: natural gas extraction, transportation, hydrogen production, storage, and end-use application. It starts with extracting natural gas, which is then either compressed for pipeline transport or liquefied for longer-distance shipping by tankers. After extraction, natural gas may be stored or transported directly to hydrogen production facilities. Post-production, hydrogen is stored and transported according to its form—gaseous hydrogen via pipelines and liquefied hydrogen via trucks and tankers. Key areas of concern include high energy consumption and losses in transportation, SMR, and liquid hydrogen storage, which impact the overall efficiency of the grey-blue hydrogen supply chain. Besides, truck transportation emerges as the highest emitter in the supply chain with average values from 0.140 to 0.150 kg CO2e per kg of hydrogen carried. Emerging technologies in hydrogen production, storage, and transportation from the literature offer substantial improvements in energy efficiency and environmental impact for the grey-blue hydrogen supply chain. Advances in SMR can enhance energy efficiency by 3.9% and cut GHG emissions by 19.4%. Optimizing cushion gas pressure in storage can improve efficiency by 7.2% and lower GHG emissions by 4 g CO2e per kg of hydrogen. Switching truck transportation to hybrid or electric powertrains can boost efficiency by over 19% and reduce GHG emissions by up to 40%.
The analysis of results reveals a trade-off between energy efficiency and GHG emissions in grey and blue hydrogen supply chains. Grey hydrogen demonstrates higher energy efficiency (38.0%) but also higher emissions (0.1689 kg CO2e per kg of hydrogen). In contrast, blue hydrogen with 60% and 90% CCS shows slightly lower energy efficiencies (37.5% and 36.9%, respectively) but reduced emissions (0.1564 and 0.1514 kg CO2e per kg of hydrogen, respectively). Notably, pathways with the highest energy efficiency do not correspond to those with the lowest emissions. Liquefied natural gas and hydrogen offer high energy efficiency but increase emissions, whereas compressed natural gas and gaseous hydrogen slightly reduce efficiency but nearly halve emissions. Therefore, compressed options are preferable for an energy-emissions-efficient shortest path. Additionally, fewer processes in the supply chain result in higher energy efficiency and lower emissions.
While the study offers valuable insights into the energy efficiency and greenhouse gas (GHG) emissions of the grey-blue hydrogen supply chain, several limitations must be acknowledged.First, the analysis relies heavily on data from Europe and North America, which may not accurately represent conditions in regions like Africa, Asia, and South America. Second, aviation transportation was excluded from the transport processes, an aspect future studies should consider despite its current rarity. Third, although effective, the bi-objective Dijkstra algorithm, might benefit from integration with other multi-criteria decision-making tools to capture a broader range of factors influencing supply chain performance. Future research should explore these aspects, incorporate more dynamic and real-time data, and consider regional variations in infrastructure and technology. Last, expanding the scope to include economic factors, such as costs and market dynamics, will provide a more comprehensive assessment of hydrogen supply chain optimization.
Future research on hydrogen supply chain optimization should address the limitations of the current study and integrate emerging technologies to enhance efficiency and sustainability.Advanced artificial intelligence and machine learning algorithms offer potential for real-time management and predictive maintenance, optimizing resource use and lowering costs. Blockchain could enhance transparency and traceability throughout the hydrogen supply chain, from production to distribution. Digital twin technology, with its ability to simulate and analyze supply chain dynamics in real-time, can support data-driven decision-making and process optimization. Additionally, exploring the integration of green hydrogen—produced via electrolysis using renewable energy—with traditional SMR methods using natural gas can diversify production strategies. Regional studies that account for variations in infrastructure, policies, and market conditions are also necessary for developing targeted optimization approaches. These research directions are crucial for building a robust, scalable, and sustainable hydrogen supply chain.
The work was supported by the School of Science and Engineering in Al Akhawayn University within the framework of ‘Advancing Hydrogen Technologies for Sustainable Energy’.
Conceptualization, H.E.H. and M.A.H.; Methodology, H.E.H. and M.A.H.; Software, H.E.H.; Validation, H.E.H., M.A.H. and A.K.; Formal Analysis, H.E.H. and M.A.H.; Investigation, M.A.H.; Resources, M.A.H.; Data Curation, M.A.H.; Writing—Original Draft Preparation, H.E.H.; Writing—Review & Editing, H.E.H.; Visualization, H.E.H.; Supervision, A.K.; Project Administration, H.E.H. and A.K.; Funding Acquisition, A.K.
Not applicable.
Not applicable.
This research received no external funding.
The authors declare that they have no known competing financial interests or personal relationships that could have appeared to influence the work reported in this paper.