Under the context of global climate change and low-carbon development, China’s “dual-carbon” strategy has imposed stricter environmental requirements on the steel industry. As a typical energy-intensive and high-emission sector, carbon reduction across the entire steel production process has become a core challenge for industrial transformation. Notably, as a critical front-end step in blast furnace ironmaking, the sintering process exhibits particularly prominent energy consumption and carbon emission issues. This process converts iron ore fines into sintered ore suitable for blast furnace smelting through high-temperature consolidation reactions, where fuel combustion behavior directly determines thermal efficiency, sinter quality, and pollutant emissions. Despite emerging technologies like hydrogen-based direct reduction and oxygen-enriched sintering, traditional sintering processes will remain dominant in China’s long-process-dominated steel production structure for decades. Consequently, optimizing fuel combustion behavior to achieve energy conservation and emission reduction in sintering has become a key focus for both academia and industry [
1,
2,
3].
As the primary heat source in sintering, fuel combustion demonstrates critical coupling between dynamic combustion characteristics and process conditions [
4,
5,
6]. During actual sintering, fuel particles undergo rapid heating, combustion, and cooling phases post-ignition, with their combustion rates and heat release intensity dynamically controlled by temperature field variations. Studies reveal significant non-uniformity in heating rates across the sinter bed: surface-layer fuel particles in the ignition zone experience heating rates of 100–200 °C/min, while middle-lower layers may abruptly drop to 5–30 °C/min. Such drastic temperature gradients induce heterogeneous combustion behaviors, leading to localized overburning, sinter quality fluctuations, and energy waste [
7,
8,
9]. Therefore, clarifying the mechanism of heating rate effects on fuel combustion kinetics provides essential theoretical foundations for optimizing sintering thermal regimes and improving combustion efficiency [
10,
11].
In recent years, exploratory studies have been conducted on the impact of heating rate on fuel combustion characteristics [
12,
13,
14,
15]. Through thermogravimetric analysis (TGA) and drop-tube furnace experiments, researchers have identified significant correlations between heating rates and fuel reactivity [
16]. For instance, Wang et al. [
17,
18] calculated coke combustion kinetic parameters at different heating rates (5–50 °C/min) using isoconversional methods, finding that increasing heating rates from 10 °C/min to 30 °C/min reduced apparent activation energy by 18% and increased reaction rate constants by 1.5–2 times. This phenomenon was attributed to rapid, volatile release and pore structure evolution under fast heating: higher rates shorten fuel preheating time, promote micropore expansion/interconnection, and enhance oxygen diffusion efficiency [
19].
Further research highlights fuel-type dependency in heating rate effects. Coke shows significantly higher sensitivity to heating rate variations compared to anthracite or biomass. Li et al. [
20] compared three fuels under 10–100 °C/min heating rates, observing 300% combustion rate enhancement for coke versus 150% for anthracite. This divergence likely stems from coke’s unique structural properties: its well-developed pore network facilitates oxygen diffusion channels under rapid heating, while high fixed carbon content avoids combustion interface disruption by volatile release. Industrial sintering’s complex heat/mass transfer environment amplifies heating rate effects. In practice, fuel combustion is simultaneously regulated by heating rates, bed permeability, gas velocity, and raw material moisture. Zhang’s team [
21] numerically demonstrated that reducing the bed permeability index from 0.8 to 0.5 decreased average fuel heating rates by 40%, increasing combustion zone thickness by 15–20% and elevating sinter FeO content by 2–3 percentage points. These findings underscore the synergistic mechanisms between process parameters and combustion kinetics. However, existing studies predominantly focus on single fuel samples, neglecting systematic investigation of coke quality variations on heating rate effects.
Current research on heating rate impacts on coke combustion remains limited in mechanistic studies of rate-dependent effects across coke types, with most focusing on industrial outcomes. This study systematically investigates four coke types through kinetic analysis and experiments to elucidate the effects of heating rate on combustion performance. By analyzing physicochemical structures and combustion characteristics, exploring relationships between heating rates and coke combustion behaviors, aiming to provide theoretical support for optimizing sintering combustion systems and advancing energy efficiency/emission reduction in the steel industry under China’s dual-carbon goals.
2.1. Materials
Four types of coke with a fixed carbon content greater than 85% were selected as the focus of this study. The fixed carbon content, from high to low, is JY, JH, MJ, and WG. The proximate and ultimate analysis results are shown in . As can be seen from the table, the ash content of the four coke powders is less than 14%, and the sulfur content is less than 1%, meeting the requirements for fuel used in sintering production. Meanwhile, the gross calorific value on a dry basis (Q
gr,d) of the coke was measured using an oxygen bomb calorimeter (XRY-1A, Jichang, Shanghai, China), and the samples were tested according to the Chinese standard “Method for Determination of Calorific Value of Coal” (GB/T 213-2008). The calorific value was determined in an oxygen bomb calorimeter. A certain amount of the analytical sample was combusted in the oxygen bomb calorimeter, which was filled with excess oxygen. The heat capacity of the calorimeter was determined by combusting a certain amount of the reference calorific substance, benzoic acid, under similar conditions. Based on the temperature rise of the calorimetric system before and after the combustion of the sample and after correcting for additional heat, such as ignition heat, the bomb calorific value of the sample was obtained. The gross calorific value was derived by subtracting the heat of the formation of nitric acid and the correction heat of sulfuric acid (the difference between the heat of the formation of hydrated sulfuric acid and gaseous sulfur dioxide formed in the oxygen bomb reaction) from the bomb calorific value.
.
The proximate and ultimate analysis results of coke samples.
| Sample |
Proximate Analysis (%) |
Ultimate Analysis (%) |
Qgr,d (MJ/kg) |
| FCd |
Ad |
Vd |
Cd |
Hd |
Od |
Nd |
Sd |
| JY |
85.40 |
13.88 |
0.72 |
82.90 |
0.09 |
1.45 |
0.77 |
0.91 |
23.16 |
| JH |
85.35 |
13.73 |
0.92 |
83.10 |
0.21 |
1.20 |
0.89 |
0.87 |
25.33 |
| MJ |
85.11 |
14.00 |
0.89 |
82.94 |
0.22 |
1.20 |
0.87 |
0.77 |
25.35 |
| WG |
85.08 |
13.73 |
1.19 |
83.52 |
0.23 |
0.95 |
0.75 |
0.82 |
25.37 |
2.2. Experiments Methods
2.2.1. Raman Spectroscopy
The internal carbon structure of the coke was investigated using a Raman spectrometer (LabRAM HR Evolution, Horiba, Tokyo, Japan). The Raman spectral analysis range was set at 800–1800 cm
−1, with a laser as the signal source, a spectral resolution of 2 cm
−1, and a wavelength of 532 nm. By employing a computational approach combining Gaussian and Lorentzian functions, more detailed structural parameters of the samples were obtained.
2.2.2. X-ray Diffraction
X-Ray diffraction (XRD) is one of the most effective methods for analyzing the microstructure of materials, leveraging the characteristic diffraction of X-rays in crystals to obtain the signatures of different X-ray signals after diffraction (Rigaku Ultima IV). Crystal structure information of coke samples is obtained through the application of the Scherrer equation and Bragg’s law.
2.2.3. Combustion Characteristics
The combustion characteristics of coke were tested using a WCT-2 thermal analyzer (Henven-2, Hengjiu, Beijing, China). During the combustion experiment, to ensure stability in the air flow within the equipment, the equipment was first purged with air at a flow rate of 100 mL/min for 5 min. A sample of 10 ± 0.3 mg was placed in a 4 × 5 mm Al
2O
3 crucible, the particle size of all samples was below 200 μm, and the heating rates were set to 5 °C/min, 10 °C/min, and 15 °C/min to increase the sample temperature from room temperature to 1250 °C. The sample was then held at 1250 °C for 30 min, during which the change in sample weight was recorded.
Equation (1) is used to calculate the weight loss rate of the sample [
22,
23]:
where
m0 is the initial mass of the sample,
mt is the mass at time
t, and
mash is the mass of the residue after complete reaction. Note that the ash mass from industrial analysis was used in this study.
The temperature at which the weight loss rate reaches 5% is defined as the initial combustion temperature
Ti; the temperature at which the weight loss rate reaches 95% is defined as the combustion temperature
Tf. The peak rate in the coke combustion rate curve represents the maximum rate of weight loss of the sample, and the temperature corresponding to this maximum rate is
Tmax. The average weight loss rate of the coke sample can be calculated using Equation (2) [
24,
25].
In the equation, (
dα/
dt) represents the weight loss rate (mg/°C) of the sample at a specific moment, $$\beta$$ is the heating rate (°C/min), and
Rmax and
Rmean are the maximum and average weight loss rates (mg/min) during the combustion process.
The comprehensive combustion characteristic index
S is an important parameter for evaluating the combustion performance of coke, and its specific calculation method is shown in Equation (3).
where
S is the comprehensive combustion characteristic index of the sample (mg
2·min
2·K
3).
2.2.4. Kinetic Model
In terms of obtaining kinetic parameters, the Coats-Redfern model is utilized to obtain a relatively reliable apparent activation energy (Ea). This method theoretically analyzes the influence of different heating rates on the kinetic behavior of combustion reactivity for different cokes. This approach is highly practical for calculating the combustion activation energy of coke. The calculation process is as follows [
26,
27,
28]:
$$k \left(T\right)$$ is the reaction rate constant in the Arrhenius equation, specifically described by Equation (5):
where
A is the pre-exponential factor,
E is the activation energy of the chemical reaction (kJ/mol),
T is the reaction temperature (K),
R is the molar gas constant (8.314 J/mol·K), and $$f \left(\alpha\right)$$ is the differential form of the reaction mechanism function.
where
n is the reaction order, and since coke combustion is considered a first-order reaction,
n is taken as 1 in this study.
Substituting Equations (5) and (6) into Equation (4) yields the following Equation (7):
By taking the logarithm of both sides of Equation (7), we can obtain Equations (8) and (9):
The heating rate $$\beta$$ (°C/min) can be represented by the following Equation (10):
Substituting Equation (10) into Equation (7) yields Equation (11):
Further mathematical transformations can lead to Equation (12) [
29,
30,
31,
32]:
Based on the above equation, by performing a linear fit between $$ln \left[- \frac{ln \left(1 - \alpha\right)}{T^{2}}\right]$$ and $$\frac{1}{T}$$ under different α conditions, the corresponding apparent activation energy can be obtained from the slope, and the pre-exponential factor can be calculated from the intercept.
In this study, since the sintering process is a complex temperature changing process, the heating rate range is extended within the range of possible temperature changes. The combustion curves of coke samples were mathematically processed under heating rates of 5 °C/min, 10 °C/min, and 15 °C/min, respectively. The average conversion ratio ranged from 0.05 to 0.95, and the activation energy was determined from the slope of the linear fit.
3.1. Proximate and Ultimate Analysis
The fixed carbon content of the four types of coke is very similar, at around 85%, indicating that their carbon skeleton structures are alike. They exhibit characteristics of high fixed carbon, low volatile matter, and low hydrogen content, suggesting a high degree of maturity, stable combustion processes, and minor differences in the main heat source during combustion (fixed carbon combustion). JY has a slightly higher fixed carbon content (85.40%), while WG has a slightly lower one (85.08%). The ash content ranges from 13.73% to 14.00%, with MJ having the highest ash content and JH and WG having the lowest. Ash is an inert substance that reduces the calorific value of coke and affects combustion efficiency. MJ’s slightly higher ash content may lead to slightly poorer combustion performance. The volatile matter content of the four coke powders ranges from 0.72% to 1.19%, with JY having the lowest volatile matter content (0.72%) and WG having the highest (1.19%). The low volatile matter content indicates a high degree of coke maturity, with less volatile matter released during combustion, resulting in a more stable combustion process.
The carbon content ranges from 82.90% to 83.52%, with WG having the highest carbon content and JY having the lowest. Carbon content is positively correlated with fixed carbon content, and WG’s high carbon content suggests that its combustion calorific value may be higher. The oxygen content ranges from 0.95% to 1.45%, with JY having the highest oxygen content and WG having the lowest. High oxygen content may increase the risk of incomplete combustion during the combustion process, generating more CO. Additionally, the preheating of oxygen content shows a negative correlation trend with changes, verifying the impact of oxygen content on combustion performance. JY’s calorific value is significantly lower than that of the other three types of coke, which may be related to its higher oxygen content and lower carbon content. The calorific values of JH, MJ, and WG are very close (25.33–25.37 MJ/kg), indicating similar energy densities and suitability for use as high-energy fuels.
3.2. Carbonaceous Structural
3.2.1. Raman Analysis
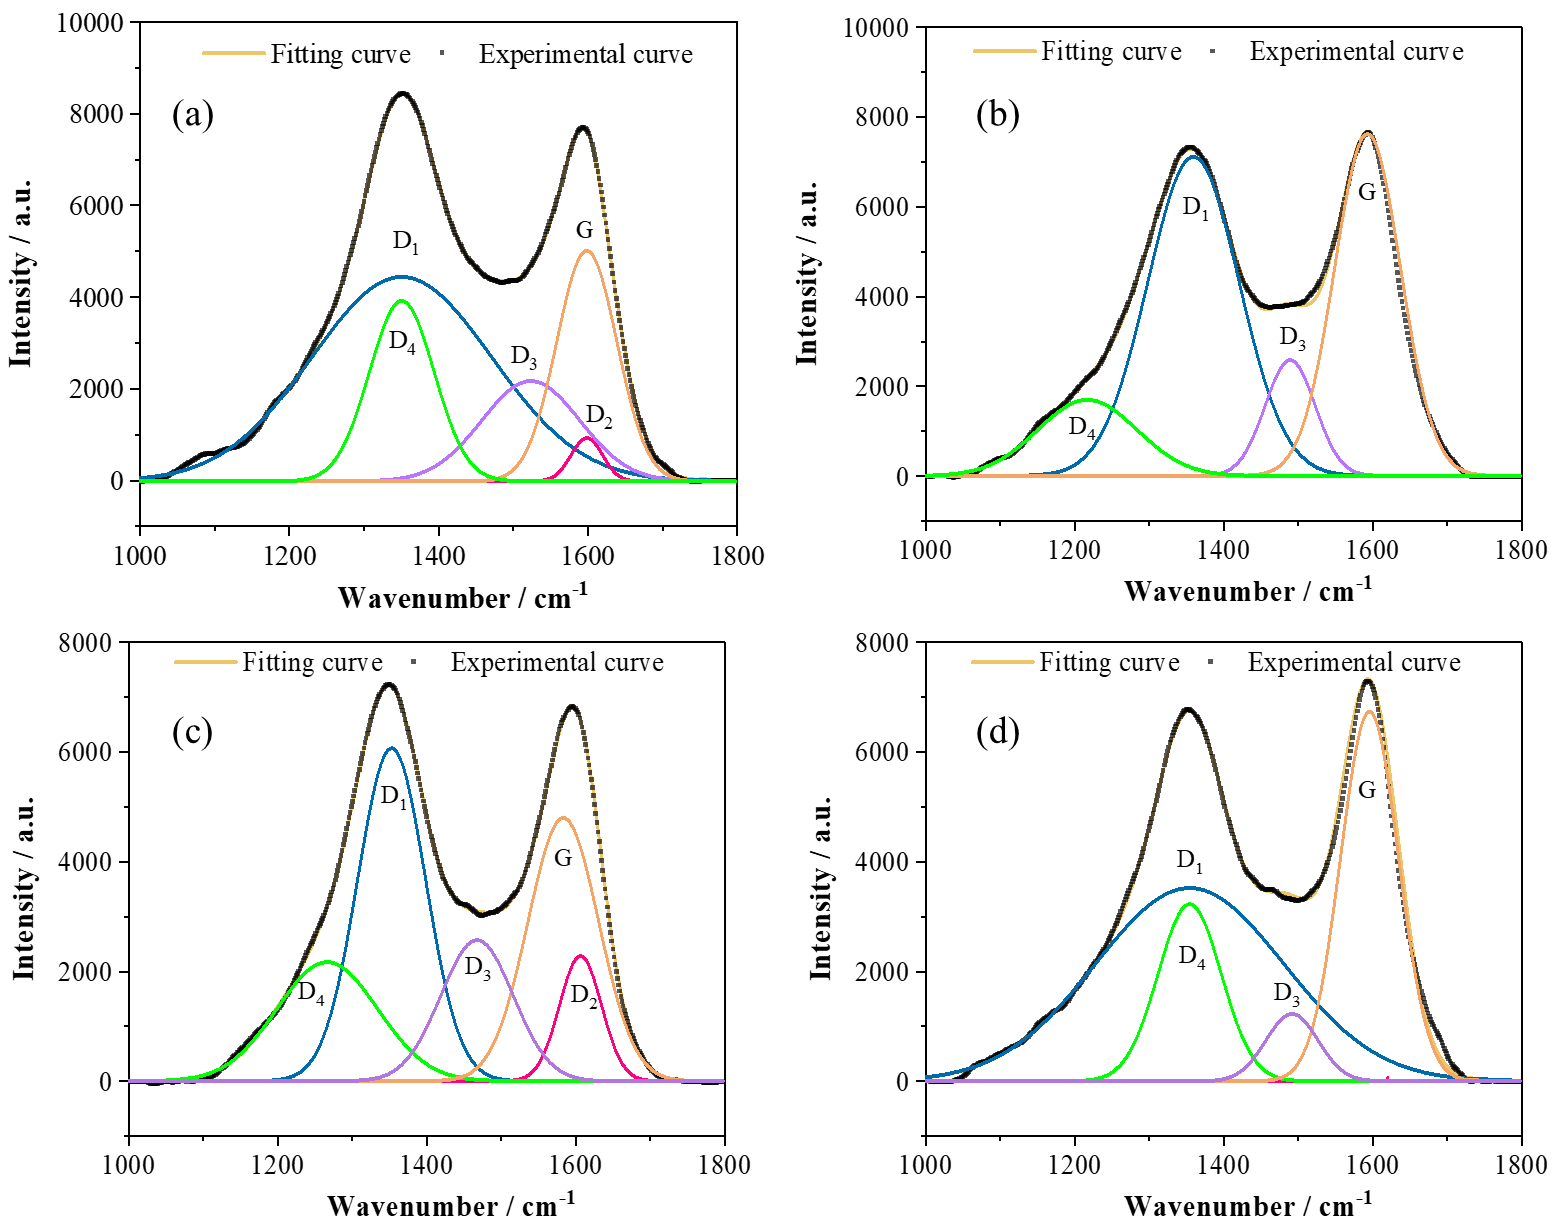
displays the peaks of the Raman spectra for four types of cokes, while presents the carbon structural parameters of the samples, including I
D1/I
G, I
D3+D4/I
G, I
G/I
All, and I
D3/I
All, the D-band intensity reflects lattice defects and disordered carbon, while the G-band corresponds to in-plane vibrations of sp
2-bonded graphitic layers. The Raman spectral data analysis for the four coke types (JY, JH, MJ, and WG) reveals differences in their structural characteristics and combustion properties. Firstly, in terms of the content of disordered carbon structures, JY has the highest I
D1/I
G ratio, indicating a higher content of disordered carbon structures, which may be related to its higher oxygen content and lower carbon content, resulting in a relatively disordered structure. In contrast, MJ has the lowest I
D1/I
G ratio, suggesting a lower content of disordered carbon structures and a relatively ordered structure. Secondly, in terms of the content of defective structures, JY and WG exhibit higher I
D3+D4/I
G ratios (0.68 and 0.69, respectively), indicating more defective structures, potentially associated with higher oxygen and volatile matter contents. This may lead to higher reactivity during combustion but may also increase the risk of incomplete combustion. In comparison, JH and MJ have lower I
D3+D4/I
G ratios, suggesting fewer defective structures, a relatively intact structure, and a more stable combustion performance.
Further analysis of the degree of graphitization (I
G/I
All ratio) reveals that JH has the highest I
G/I
All ratio, indicating a higher degree of graphitization and a more ordered structure. This is consistent with its higher fixed carbon content and lower volatile matter content from laboratory and industrial analyses, making it suitable as an efficient and clean fuel. In contrast, JY has the lowest I
G/I
All ratio, suggesting a lower degree of graphitization and a more disordered structure, which may result in a lower calorific value during combustion. Additionally, in terms of the content of sp
3 hybridized carbon structures (I
D3/I
All ratio), JH has the highest I
D3/I
All ratio, indicating a higher content of sp
3 hybridized carbon structures, potentially related to its higher hydrogen content. On the other hand, WG has the lowest I
D3/I
All ratio, suggesting that its structure is dominated by sp
2 hybridization, which may exhibit higher reactivity during combustion.
JH coke has a high degree of graphitization and fewer defective structures, leading to stable combustion performance and suitability as an efficient and clean fuel. Although WG coke has more defective structures, its dominant sp
2 hybridized carbon structure results in high combustion reactivity and a high calorific value (25.37 MJ/kg). MJ coke has a relatively ordered structure with combustion performance between JY and JH. JY coke has a disordered structure with many defective structures, leading to high combustion reactivity but a low calorific value, necessitating attention to combustion stability. Therefore, the recommended order of use is JH > WG > MJ > JY. JH and WG exhibit the best overall performance and are suitable as efficient fuels, while MJ and JY require optimized use based on specific operating conditions.
. Raman analysis of different cokes. (<b>a</b>) JY; (<b>b</b>) JH; (<b>c</b>) MJ; (<b>d</b>) WG.
.
Carbon structure parameters of different cokes.
| Sample |
ID1 |
ID2 |
ID3 |
ID4 |
IG |
I1/IG |
ID3+D4/IG |
IG/IAll |
ID3/IAll |
| JY |
1,248,223 |
10,114 |
140,634 |
297,530 |
643,233 |
1.94 |
0.68 |
0.27 |
0.06 |
| JH |
1,094,881 |
/ |
217,881 |
283,104 |
847,559 |
1.29 |
0.59 |
0.35 |
0.09 |
| MJ |
936,892 |
50,328 |
140,190 |
95,716 |
580,727 |
1.61 |
0.41 |
0.32 |
0.08 |
| WG |
1,117,782 |
/ |
107,664 |
343,204 |
656,596 |
1.70 |
0.69 |
0.30 |
0.05 |
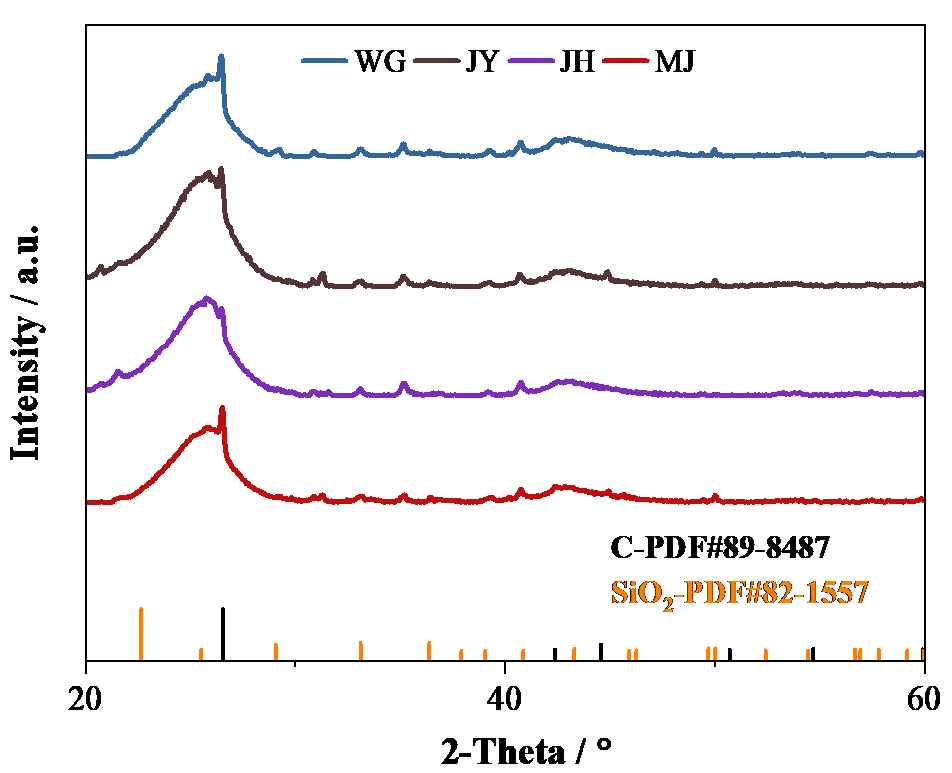
3.2.2. XRD Analysis
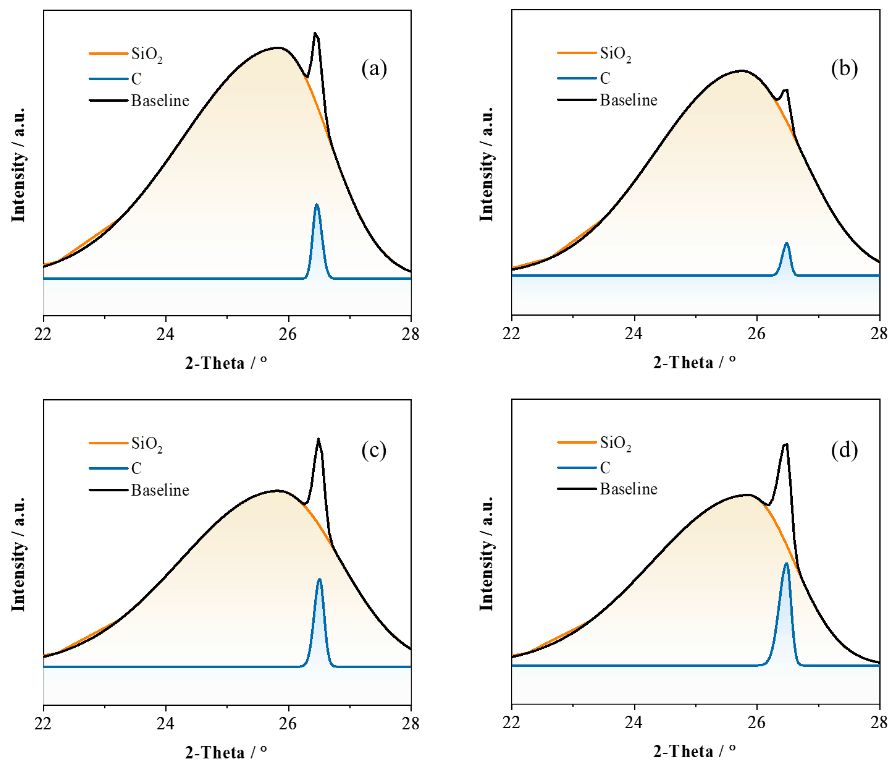
The carbon microcrystalline structural parameters of the coke samples were determined using a high-temperature X-ray diffractometer with a copper target (λ = 0.1541 nm). The XRD pattern of the samples is shown in . The XRD pattern within the 2θ range of 22–28° was selected for peak fitting to provide a more intuitive study of the carbon microcrystalline structure in the samples, as shown in . Among the fitted peaks, the carbon content of the samples can be quantitatively described based on the areas of the SiO
2 peak and the C peak. The variable $$f$$ represents the proportion of the
C peak area; a larger proportion indicates a higher
C content in the sample. The calculation method is shown in Equation (13). The interlayer spacing (
d) of carbon layers, the microcrystalline size (
Lc), and the number of microcrystals in the stacked layers (
N) are given in Equations (14)–(16) [
12,
33].
The constant 0.89 is dependent on the X-ray reflecting planes of copper; FWHM stands for Full Width at Half Maximum, and
θ represents the peak position. The
Lc value indicates the spacing between crystallographic planes. The results of the carbon structural parameters obtained through XRD are presented in . Additionally,
Lc can also reflect the reactivity of coke. The diffraction angles (2
θ) of the four types of coke range from 26.440° to 26.490°, corresponding to interlayer spacings (
d) of 0.336–0.337 nm, which are close to the typical interlayer spacing of graphite (0.335 nm).
This similarity in interlayer spacing suggests that the carbon microstructures of these coke samples have some degree of graphitization, meaning their carbon layers are relatively well-ordered and packed similarly to those in graphite [
34,
35,
36]. The
Lc value, which represents the average size of the stacked carbon layers, can provide insights into the reactivity of the coke. Generally, a larger
Lc value indicates better graphitization and potentially lower reactivity, as the larger, more ordered carbon layers may be more stable and less prone to chemical or physical disruptions. However, the specific reactivity of the coke will also depend on other factors such as its mineral content, ash composition, and the presence of defects or impurities in the carbon structure.
. XRD analysis of different cokes.
. XRD peak fitting analysis of different cokes. (<b>a</b>) JY; (<b>b</b>) JH; (<b>c</b>) MJ; (<b>d</b>) WG.
.
Carbon structure parameters obtained by XRD fitting analysis.
| Sample |
2θ (°) |
FWHM (°) |
d (nm) |
Lc (nm) |
N |
| JY |
26.490 |
0.190 |
0.336 |
0.743 |
3.211 |
| JH |
26.470 |
0.152 |
0.336 |
0.924 |
3.746 |
| MJ |
26.470 |
0.173 |
0.336 |
0.815 |
3.422 |
| WG |
26.440 |
0.228 |
0.337 |
0.617 |
2.830 |
JY has the highest diffraction angle and the smallest interlayer spacing, indicating a relatively high degree of graphitization. In contrast, WG has the lowest diffraction angle and the largest interlayer spacing, suggesting a relatively low degree of graphitization. The Full Width at Half Maximum (FWHM) reflects the degree of defects in the crystal structure; a smaller FWHM indicates a more complete crystal structure. JH has the smallest FWHM (0.152°) and the largest microcrystallite size, indicating the most complete crystal structure and the highest degree of graphitization. Conversely, WG has the largest FWHM (0.228°) and the smallest microcrystallite size, suggesting numerous defects in its crystal structure and a lower degree of graphitization. JY and MJ have FWHM values of 0.190° and 0.173°, respectively, with microcrystallite sizes of 0.743 nm and 0.815 nm, indicating that their crystal structure completeness and degree of graphitization fall between those of JH and WG. The number of graphene layers (N) reflects the stacking number of graphite microcrystallites in coke; a larger N value indicates a more ordered crystal structure. JH has the highest number of graphene layers, indicating more stacked graphite microcrystallites and the most ordered crystal structure. WG has the lowest number of graphene layers (2.830), suggesting fewer stacked graphite microcrystallites and a looser crystal structure. JY and MJ have numbers of graphene layers of 3.211 and 3.422, respectively, indicating that the orderliness of their crystal structures lies between those of JH and WG. Overall, JH coke exhibits the best overall performance and is suitable as an efficient and clean fuel, while WG coke has poorer combustion stability.
3.3. Combustion Experiments
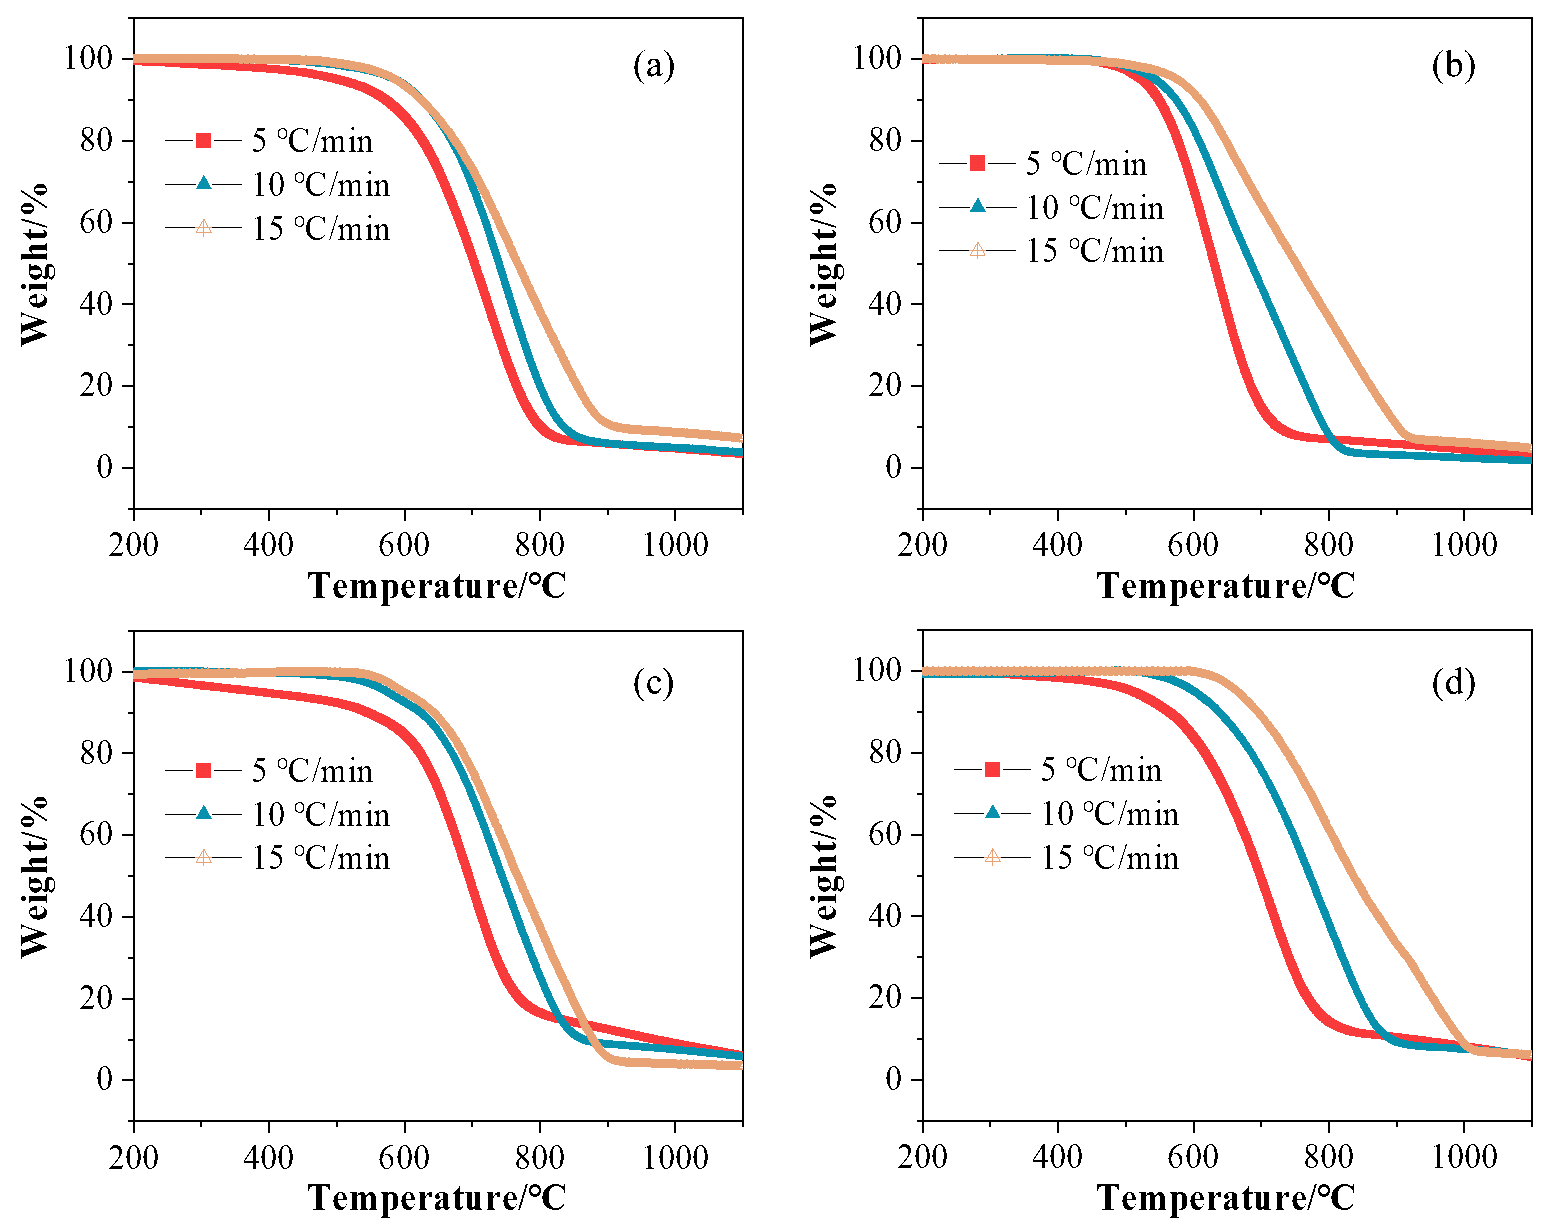
By studying the Thermogravimetry (TG) and Differential Thermogravimetry (DTG) curves of samples under different operating conditions could analyze the entire process of thermal decomposition of the samples. shows the TG curves of different coke types at heating rates of 5 °C/min, 10 °C/min, and 15 °C/min, while presents the DTG curves at different heating rates. As the heating rate increases, coke combustion’s onset and end temperatures rise due to the lag effect in heat transfer under rapid heating conditions. At a heating rate of 5 °C/min, JY coke exhibits a lower onset combustion temperature, indicating a higher content of flammable components and higher combustion reactivity. As the heating rate increases, the combustion range of JY coke gradually broadens, suggesting an intensification of the separation between the combustion of flammable and non-flammable components. At a heating rate of 15 °C/min, the end combustion temperatures of JH and WG cokes significantly increase, indicating that their non-flammable components can maintain high combustion efficiency at high temperatures.
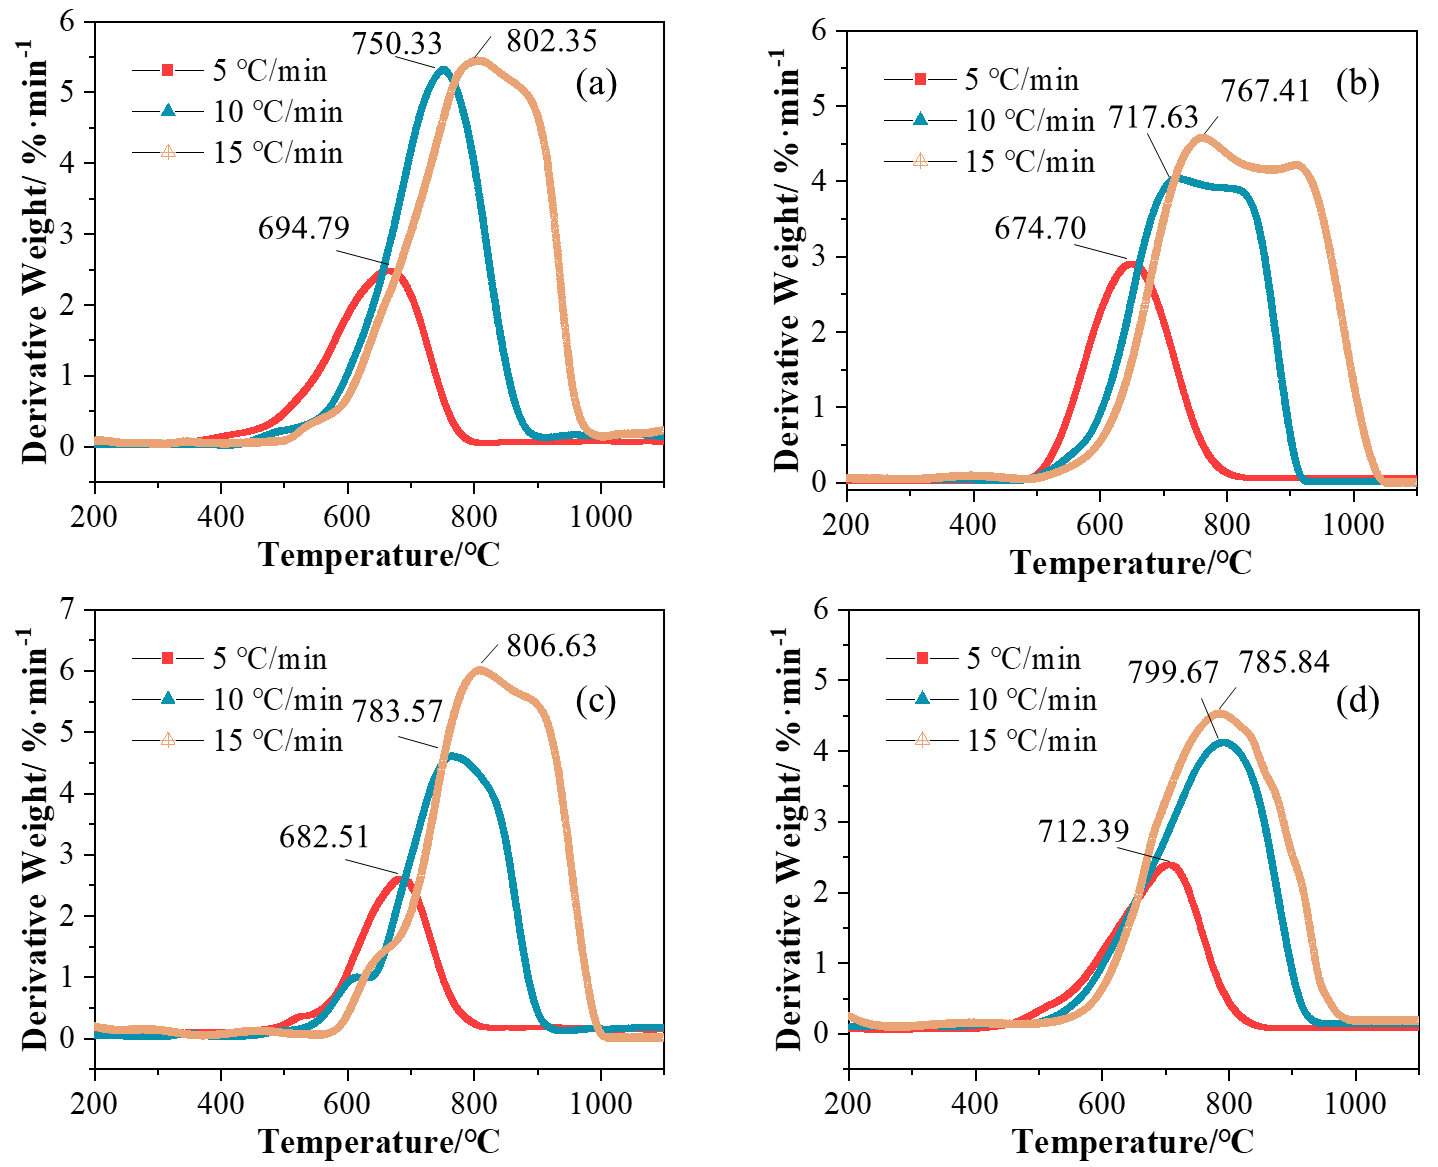
The DTG curves further reveal the changes in the mass loss rate during coke combustion. As seen in , with increasing heating rates, the weight loss peaks in the DTG curves shift towards higher temperatures and increase in magnitude, indicating a significant increase in the combustion rate. At a heating rate of 5 °C/min, the DTG curve of JY coke shows a single weight loss peak, indicating a relatively continuous combustion process for both its flammable and non-flammable components. Compared to JH coke, the DTG peak shapes of JY and MJ cokes change less, while the DTG peak shape of WG coke changes the least, suggesting that its combustion behavior is less sensitive to changes in heating rate.
. The combustion weight loss of different cokes. (<b>a</b>) JY; (<b>b</b>) JH; (<b>c</b>) MJ; (<b>d</b>) WG.
. The combustion weight loss rate curves of different cokes. (<b>a</b>) JY; (<b>b</b>) JH; (<b>c</b>) MJ; (<b>d</b>) WG.
Analysis of the combustion characteristics parameters of four types of coke (JY, JH, MJ, and WG) at different heating rates (5 °C/min, 10 °C/min, and 15 °C/min) reveals differences in their combustion behavior and their response patterns to heating rates, as shown in . Both the onset temperature (
Ti) and termination temperature (
Tf) of combustion significantly increase with the heating rate, indicating an enhanced lag effect in heat transfer due to rapid heating. For example, WG’s
Ti rises from 406.06 °C at 5 °C/min to 526.30 °C at 15 °C/min, and its
Tf increases from 848.26 °C to 984.18 °C. In contrast, JY has the lowest
Ti, which is related to its high degree of graphitization and ordered structure, which is favorable for low-temperature combustion activity.
In terms of combustion rates, both the average rate (
Rmean) and the maximum rate (
Rmax) increase significantly with the heating rate. MJ achieves an
Rmax of 0.060 mg/min at 15 °C/min, exhibiting the fastest high-temperature combustion rate, which is associated with its high carbon content and defective structure facilitating oxygen penetration. JY’s
Rmean increases steadily, reflecting its combustion stability. The comprehensive combustion index (S/10
−11) indicates that JY has the highest
S index at 5 °C/min (1.841), showing optimal overall performance at low temperatures. Meanwhile, MJ’s
S index reaches 2.245 at 15 °C/min, marking a significant improvement in high-temperature performance (an increase of 235%). JH exhibits weaker overall performance. The results suggest that coke combustion behavior is regulated by its structural characteristics and heating rate: MJ is suitable for low-temperature efficient combustion scenarios, JY excels at high temperatures, WG is most sensitive to heating rate changes, and JH has relatively poorer overall performance.
.
Combustion characteristic parameters of cokes with different heating rate.
| Sample |
Heating Rate (℃/min) |
Ti (℃) |
Tf (℃) |
Tmax (℃) |
Rmean (mg/min) |
Rmax (mg/min) |
S/10−11 (mg2⋅(min2⋅K3)−1) |
| JY |
5 |
364.208 |
674.880 |
694.787 |
0.067 |
0.025 |
1.841 |
|
10 |
443.816 |
901.796 |
750.327 |
0.069 |
0.053 |
2.068 |
|
15 |
507.768 |
996.817 |
802.350 |
0.124 |
0.054 |
2.625 |
| JH |
5 |
437.502 |
852.153 |
674.702 |
0.043 |
0.029 |
0.756 |
|
10 |
495.328 |
922.824 |
717.629 |
0.111 |
0.040 |
1.991 |
|
15 |
559.807 |
1050.833 |
767.406 |
0.161 |
0.046 |
2.226 |
| MJ |
5 |
473.800 |
815.503 |
682.507 |
0.047 |
0.026 |
0.670 |
|
10 |
541.703 |
925.354 |
783.570 |
0.090 |
0.045 |
1.496 |
|
15 |
564.029 |
1004.943 |
806.627 |
0.120 |
0.060 |
2.245 |
| WG |
5 |
406.060 |
848.262 |
712.391 |
0.043 |
0.034 |
1.051 |
|
10 |
486.456 |
937.000 |
799.673 |
0.089 |
0.041 |
1.654 |
|
15 |
526.301 |
984.176 |
785.844 |
0.159 |
0.045 |
2.638 |
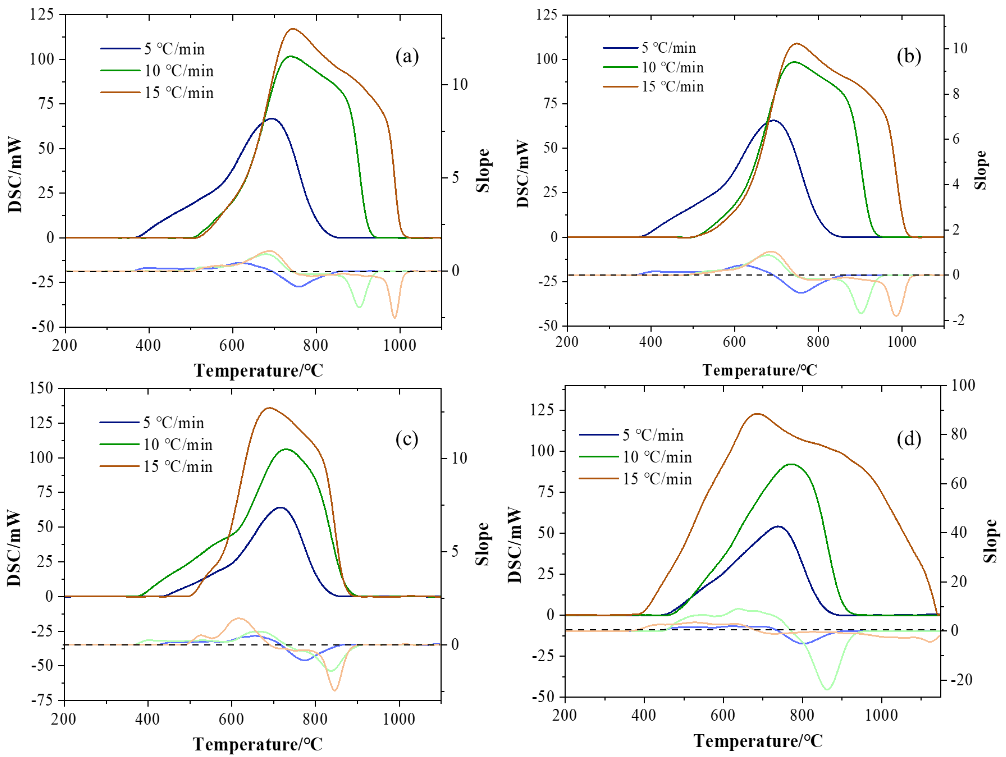
By analyzing the DSC (Differential Scanning Calorimetry) curves of the four types of coke (JY, JH, MJ, WG), as shown in , the thermal effect characteristics during their combustion process can be further revealed [
21,
31,
37]. The DSC curves reflect the changes in heat flow during the heating process of the coke, providing insights into their combustion mechanisms and energy release properties. As the heating rate increases, the DSC curves of the coke exhibit significant trends. Firstly, the exothermic peaks gradually shift from narrow and sharp to broad and high, which is attributed to the heat transfer hysteresis effect under rapid heating conditions. At lower heating rates (e.g., 5 °C/min), the combustion process of the coke is relatively gentle, with symmetric and concentrated exothermic peaks. In contrast, at higher heating rates (e.g., 15 °C/min), the combustion reaction becomes more intense, and the exothermic peaks become broader and higher, indicating a significant increase in the combustion rate. Secondly, the total heat release increases with the heating rate as the combustion reaction becomes more complete and energy release more concentrated under rapid heating conditions. Additionally, the exothermic peak shifts to higher temperatures, indicating an increase in both the ignition and termination temperatures of coke combustion. Overall, the increase in heating rate significantly enhances the combustion reactivity of the coke, but the sensitivity to heating rate varies among different types of coke, which is consistent with the analysis results of the TG curves.
. The heat release curves of different cokes. (<b>a</b>) JY; (<b>b</b>) JH; (<b>c</b>) MJ; (<b>d</b>) WG.
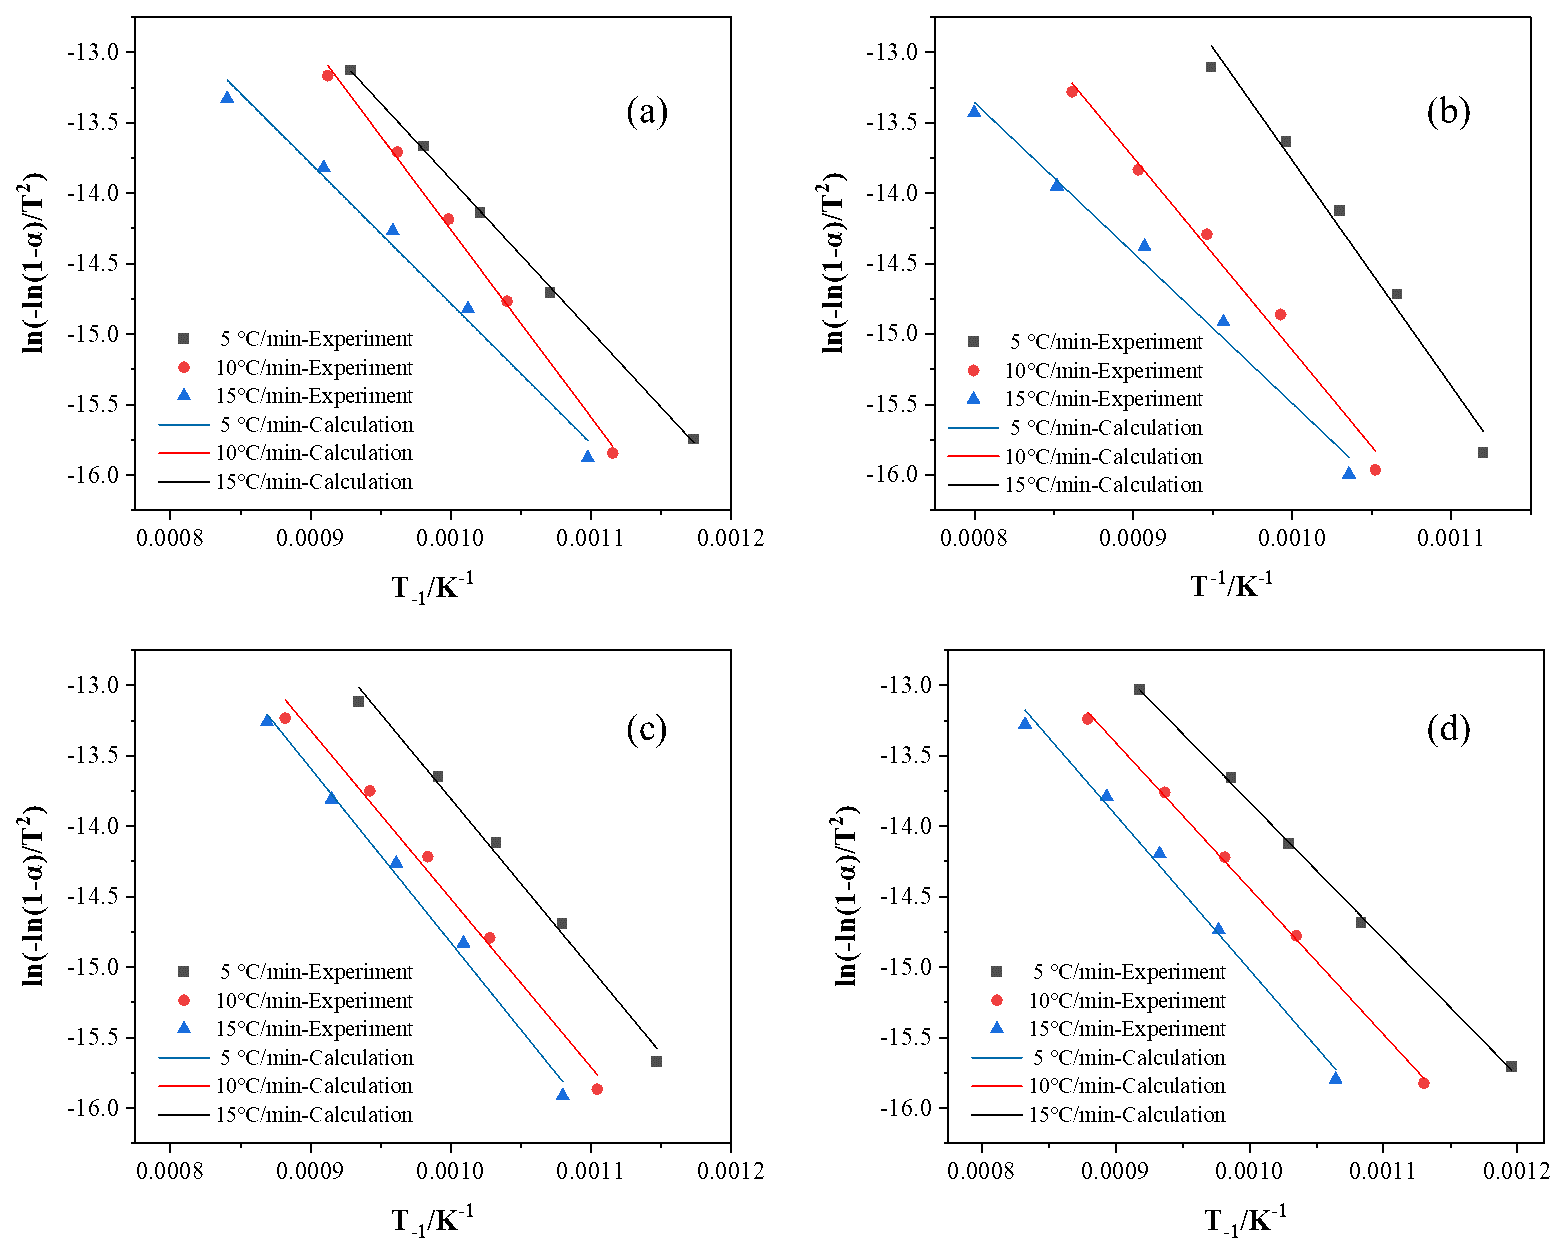
The apparent activation energy (Ea) of coke powder at various combustion stages (α) under different heating rates is illustrated in and . The correlation coefficient R
2 for each sample is greater than 0.98, indicating that the kinetic analysis provides a good fit for the experimental results [
21,
36,
37].
Through kinetic analysis, this study found that the activation energies of the four types of coke exhibit significant differences in heating rates, closely related to their microstructure and combustion behavior. JH coke shows a monotonic increase in activation energy with heating rate. At low temperatures (5 °C/min), its intact crystal structure facilitates oxygen diffusion, resulting in a lower reaction energy barrier. However, at higher heating rates (15 °C/min), lattice thermal vibration resistance increases, leading to a significant rise in activation energy. This characteristic makes it suitable for stable combustion in the sintering ignition stage but should be avoided in high-temperature zones to prevent localized overburning. In contrast, WG coke exhibits a decreasing trend in activation energy. Rapid heating intensifies oxygen adsorption at defect sites, lowering the energy barrier, and enabling it to exhibit efficient combustion characteristics in the sintering high-temperature zone. This can shorten the sintering cycle and increase production capacity.
JY coke’s activation energy displays non-monotonic fluctuations, reflecting the synergistic influence of its high ash content and disordered structure (I
G/I
All = 0.27). At higher heating rates (15 °C/min), heat accumulation partially overcomes ash resistance, causing activation energy to decrease. This instability results in poor controllability of its combustion process, tending to increase sinter porosity. MJ coke has relatively stable activation energy due to its uniform component distribution and moderate structural characteristics. It is suitable as a fuel in transition zones, balancing temperature gradients. However, its high ash content necessitates controlled blending to avoid excessive liquid phase formation.
For JY and MJ, applicability can be improved through fuel blending and synergistic optimization of process parameters: mixing JY (≤30% proportion) with low-activation energy fuels can compensate for ash disadvantages using its high-temperature reactivity. Additionally, dynamically adjusting heating rates can maximize the utilization of WG’s decreasing activation energy effect, reducing energy consumption in high-temperature zones.
. Fitting line of combustion kinetic of coke samples with different heating rate. (<b>a</b>) JY; (<b>b</b>) JH; (<b>c</b>) MJ; (<b>d</b>) WG.
.
Apparent activation energy of coke samples with different heating rate.
| Sample |
Heating Rate (℃/min) |
Apparent Activation Energy (kJ⋅mol−1) |
Correlation Index R2 |
| JY |
5 |
82.699 |
0.986 |
|
10 |
110.551 |
0.997 |
|
15 |
89.666 |
0.999 |
| JH |
5 |
88.827 |
0.987 |
|
10 |
113.752 |
0.987 |
|
15 |
133.049 |
0.982 |
| MJ |
5 |
102.811 |
0.992 |
|
10 |
99.444 |
0.989 |
|
15 |
100.159 |
0.991 |
| WG |
5 |
91.354 |
0.993 |
|
10 |
86.033 |
0.999 |
|
15 |
80.746 |
0.999 |
The authors gratefully acknowledge the financial support provided by the National Natural Science Foundation of China (52204335), the National Youth Talent Support Program (GJRC2023008), and the National Natural Science Foundation of China (52174291).
Writing—Original Draft Preparation, Z.L. (Zhen Li); Writing—Review & Editing, Y.W.; Writing—Review & Editing, Z.L. (Zhengjian Liu); Supervision, J.Z.
Not applicable.
Not applicable.
Data can be provided upon request.
This research was funded by the National Natural Science Foundation of China (52204335), the National Youth Talent Support Program (GJRC2023008), and the National Natural Science Foundation of China (52174291).
The authors declare that they have no known competing financial interests or personal relationships that could have appeared to influence the work reported in this paper.