1. Introduction
The COVID-19 pandemic and geopolitical turmoil in recent years have disrupted the balanced pattern of global food production and trade, while the main contradiction of Chinese society in the new era has shifted to the contradiction between people’s growing material and cultural needs and inadequate and unbalanced development, and the domestic and international situation facing food security has undergone significant changes [
1]. Cultivated land is the material carrier of grain production. Protecting, building, and utilizing cultivated land is not only closely bound up with people’s food and clothing, but also affects the overall development pattern of a country. Under the multi-wheel drive of market economy, urbanization, and industrialization, the diminishing marginal utility of the household contract system has led to the fragmentation of land management, which is not conducive to the commodity economy and agricultural modernization, and has limited agricultural production efficiency and farmers’ income to a certain extent [
2]. In 2017, the No. 1 document of the Central Committee of the Communist Party of China (CPC) and The State Council on Deepening Agricultural Supply-side Structural Reform and Accelerating the Cultivation of New Driving forces for Agricultural and Rural Development proposed that “moderate scale operation should be actively developed” and “multiple forms of scale operation such as land flow transformation and service-oriented operation should be accelerated.” Land circulation is an important way to adjust agricultural structure, improve agricultural production efficiency, and realize moderate scale operation [
3,
4]. However, in the context of the current market-oriented reform of agricultural land factors, the rising cost of land triggered by land transfer has become a gradually strengthening trend in agricultural development, leading to a serious disparity between the average output value of grain production per mu and the growth rate of costs. According to the “State of Food Security and Nutrition in the World 2021” released by the Food and Agriculture Organization of the United Nations (FAO), the incidence of undernourishment will rise from 8.4% to 9.9% in 2020 after five consecutive years of unchanged growth. About 720–811 million people are facing hunger, and nearly 2.37 billion people cannot obtain enough food [
5], making the global food security situation not optimistic. Accelerating the transformation of food security to make it efficient, resilient, environmentally sustainable and inclusive has become a global focus, and the farmland circulation price is a key factor and an important starting point to ensure food security and realize the appropriate scale management of farmland. At present, there are still many developing countries whose rural economic system is similar to that of China. Although they have vigorously promoted the farmland circulation, the development of farmland market and the reform of farmland system, there are still serious fragmentations of farmland and the incomplete establishment of effective land market, resulting in a lack of vitality of land market. As a country with a large population, China feeds 20% of the world’s population with food grown of 8% of the world’s land, which benefits from the rational use of farmland. Farmland circulation is an important way to stimulate rural vitality and ensure food security. The price of cultivated land transfer is an indicator reflecting the changes in the relationship between supply and demand. How to play a good role in ensuring the production function of farmland, improve its production efficiency through farmland transfer, and increase the effective supply level of important agricultural products to ensure national food security is an urgent problem to be solved. Therefore, studying the farmland circulation price can not only make a considerable contribution to solve the problem of world hunger, but also be worth referring to for improving the transfer system of cultivated land in developing countries and enhancing the vitality of land market.
With the rapid development of the land market, academic circles have conducted a series of studies on land circulation. At present, the domestic research focuses on land circulation models [
6,
7], the land circulation institutional change and optimization [
8,
9], the influencing factors [
10] and driving mechanism [
11]. Foreign research mainly focuses on the influencing factors [
12,
13] and performance evaluation of land circulation [
14,
15]. As the basic mechanism of the market mechanism, the land circulation price indicates not only the adjustment of the supply and demand of land circulation, but also the important starting point of the state macro-control of land circulation market [
16]. The academic research on land circulation price is relatively few, and they mainly involve the connotation and nature of land price [
17], the relationship between land rent and food security [
18], agricultural land use efficiency [
19], land circulation price evaluation methods [
20], influencing factors [
21], regional differences and spatial differentiation [
22]. Foreign scholars mostly analyze influencing factors, such as the boundary of land property properties [
23], the perfection of land transaction market [
24], land transaction costs, and family wealth from the perspective of economics [
25]. Domestic scholars comprehensively consider the nature, social economy, population, policy, subject will, and behavior and other aspects of research [
26,
27,
28] Overall, the existing researches focus on theoretical discussion. Although some researches discuss the spatial distribution and influencing factors of regional land transfer rent through local areas, most of these researches are based on samples of local areas such as a single administrative province or a single village, and land transfer price information is mainly obtained through sampling survey of farmers. In general, the existing researches focus on theoretical discussion. Although some researches discuss the spatial distribution and influencing factors of regional land transfer rent through local areas, most of these researches are based on samples of local areas such as a single administrative province or a single village, and land transfer price information is mainly obtained through sampling survey of farmers. From the perspective of space, China is a vast country with significant differences in rural development among different regions. Agriculture is mainly concentrated in counties, with the majority of rural areas distributed in counties and most farmers living in counties. Taking counties as research units, we can accurately understand the reality of rural development in each region.
By crawling the temporal data of farmland circulation price from the land transfer big data platform, this paper comprehensively applied spatial analysis and spatial measurement methods to examine the spatial distribution characteristics and influencing factors of farmland circulation price at county level in China from different periods, regions, and types of farmland utilization. It is of great significance to explore the spatiotemporal differences of the farmland circulation price and its driving factors at the national level for improving agricultural development policies, promoting agricultural modernization and sustainable development and ensuring food security.
2. Data and Methods
2.1. Data
The data of farmland circulation price used in this paper mainly come from the land transfer information platform (www.tuliu.com). As the largest rural land transaction platform in China, tuliu.com connects farmers who possess idle land with land transfer intermediaries and land planting enterprises. It has realized the high-speed transfer transaction on the land network, and opened up a new era of rural land transfer with a new form of efficient land transfer. Using Python language to design codes and December 2021 as the collection point, the circulation prices of farmland (including paddy field, dry land, irrigated land and other cultivated land) in all regions and counties of China in each quarter during 2015–2020 were collected from tuliu.com. Missing data were supplemented by the rural land Property Rights Exchange Centers of various regions and official websites of Agriculture and Rural Affairs Committee of the NPC. A total of 70,032 pieces of relevant data were obtained to construct the farmland circulation price database of each district and county in China. After cleaning the collected data, 67,368 effective samples were obtained by eliminating data with missing circulation prices and abnormal values of the circulation (i.e., price less than 450 Yuan/ha and greater than 75,000 Yuan/ha), with an effectivity ratio of 96.20%. China’s land system implements socialist public ownership, and the farmland circulation price is a form of capitalization of its management rights, mainly through subcontracting and leasing. Therefore, the farmland circulation price referred to in this paper is the average price of each quarter of the subcontracting and leasing of household farmland.
In addition, the attribute data of population density, Digital Elevation Mode (DEM), road traffic network, remote sensing monitoring data of land use, and kilometer-grid GDP are obtained from the Center for Resources and Environmental Sciences, Chinese Academy of Sciences (https://www.resdc.cn/). Night light data were obtained from Colorado School of Mines (https://eogdata.mines.edu/products/vnl/), and social and economic data were from the China statistical yearbook (county-level).
2.2. Methods
2.2.1 Spatial Characteristics Analysis
From the point of view of space, agriculture is mainly concentrated in counties. Rural subjects are distributed in counties, and most farmers live in counties. In this paper, the basic research unit of farmland circulation price is county scale, and spatial interaction may be observed between units. Therefore, the traditional statistical method based on the assumption of independent observation value is not suitable for analyzing spatial data. Hence, this paper selects spatial characteristics analysis to explore the spatial structure characteristics and patterns of farmland circulation price. First, trend analysis is used to characterize the spatial distribution characteristics of farmland circulation price at county level in China. Second, Moran’s I is used to judge the spatial correlation of farmland circulation price. Moran’s I is divided into Global Moran’s I and Local Moran’s I. Global Moran’s I is used to judge whether spatial data have spatial agglomeration characteristics, and its calculation method is expressed by formula 1 [
29]:
where
n is the number of districts and counties;
Xi and
Xj are random variable
X in geographical unit attribute value in the history of
i and
j, respectively; $$\bar{X}$$ attribute values for
n space unit sample mean,
Wij is a geographical unit weight matrix adjacency relationship between each other, space can be measured according to the weight matrix adjacency standards or distance, adjacent standard unit 1, the space connect is not defined as 0. The distance standard is defined as 1 within a certain range and 0 beyond the distance. The value range of
I is [−1, 1];
I < 0 indicates negative spatial correlation. The smaller the value is, the greater the spatial difference is.
I > 0 indicates positive spatial correlation. The larger the value is, the greater the spatial correlation is. When
I = 0, the space is not correlated.
The Global Moran’s I is a comprehensive measure of the spatial characteristics of the research area, but it cannot reflect the spatial heterogeneity of each research unit. Therefore, Local Moran’s I is used to measure the heterogeneity of each basic research unit to reveal the local spatial characteristics and correlation rules of the research area. Its calculation method is expressed in formula 2 [
30]:
where
Ii is the Local Moran’s I.
2.2.2. Correlation Analysis
In order to clarify the closeness of the relationship between farmland circulation price and its influencing factors, SPSS software was used for correlation analysis, and correlation coefficient was used to represent the closeness between farmland circulation price and influencing factors. The calculation method was expressed by formula 3 [
2]:
In the formula,
r is the correlation coefficient, and
Y is the influencing factor.
2.2.3. Spatial Econometric Analysis
Screening key variables according to the correlation coefficient can further reveal the key influencing factors of farmland circulation price. Most of the traditional econometric models are developed from the least squares method. This method essentially studies the conditional expectation of the explained variables, but it often ignores the spatial correlation between some variables [
22]. Therefore, this paper adopts ordinary least squares (OLS) regression model, spatial lag model (SLM), spatial error model (SEM), and other spatial econometric models for comparative analysis. The quantitative relationship between farmland circulation price and influencing factors is further measured. When the variables are spatially independent and do not follow a completely normal distribution, OLS regression model is suitable for correlation research. When the variables have spatial spillover effect, the SLM is adopted (Formula 4). When spatial lag effect is observed in data error, SEM is adopted (Formula 5) [
31]:
where
y is the dependent variable, an
n × 1 vector, and
x is an
n ×
k independent variable matrix;
W is an
n ×
n spatial proximity matrix,
Wy is the spatial lag dependent variable,
ρ is the spatial lag regression coefficient,
β is the coefficient of the independent variable, reflecting the influence of the independent variable on the dependent variable.
where
λ is the regression coefficient of spatial error, and
ε represents the residual of
y to
x after regression.
3. Results
*3.1. Descriptive Statistical Analysis of Farmland Circulation Price*
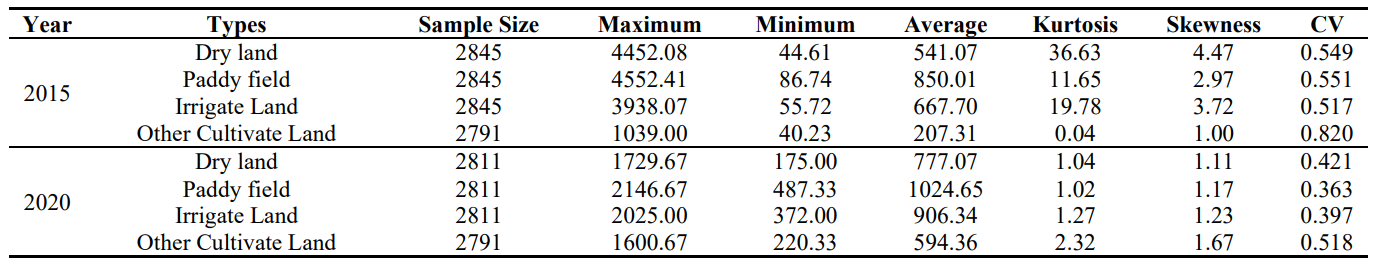
SPSS was used for the descriptive statistical analysis of farmland circulation price in each county in China (). As shown in , the average price of cultivated land circulation is paddy field > irrigated land > dry land > other cultivated land. Maximum values of dry land, paddy field and irrigated land in 2020 are significantly lower than those in 2015, with a marked increase in the minimum average value at the same time. This increase was mainly due to the Third Plenary Session of the 18th Central Committee of the Communist Party of China, which proposed major reform initiatives of rural contracted land ownership, contract right and franchise division, contract right and the separation of management as well as management of allowing flexibility, further to the development of rural land market. The capitalization of rural land gradually increased the farmland land price. In addition, in order to resolutely curb the conversion of cultivated land to non-agricultural land and prevent the excessive “non-food” of cultivated land, the state strictly restricted the use of rural land, preventing the excessive capitalization of land. The kurtosis coefficient of 2015 is significantly greater than 3, and the skewness coefficient is significantly greater than that of 2020, indicating that the distribution frequency of farmland circulation price in 2015 is not uniform, while the two levels of land transfer market in 2015 are more differentiated. In order to compare the regional differences of farmland circulation price in China, this paper divides China into nine agricultural regions by referring to the agricultural regionalization scheme [
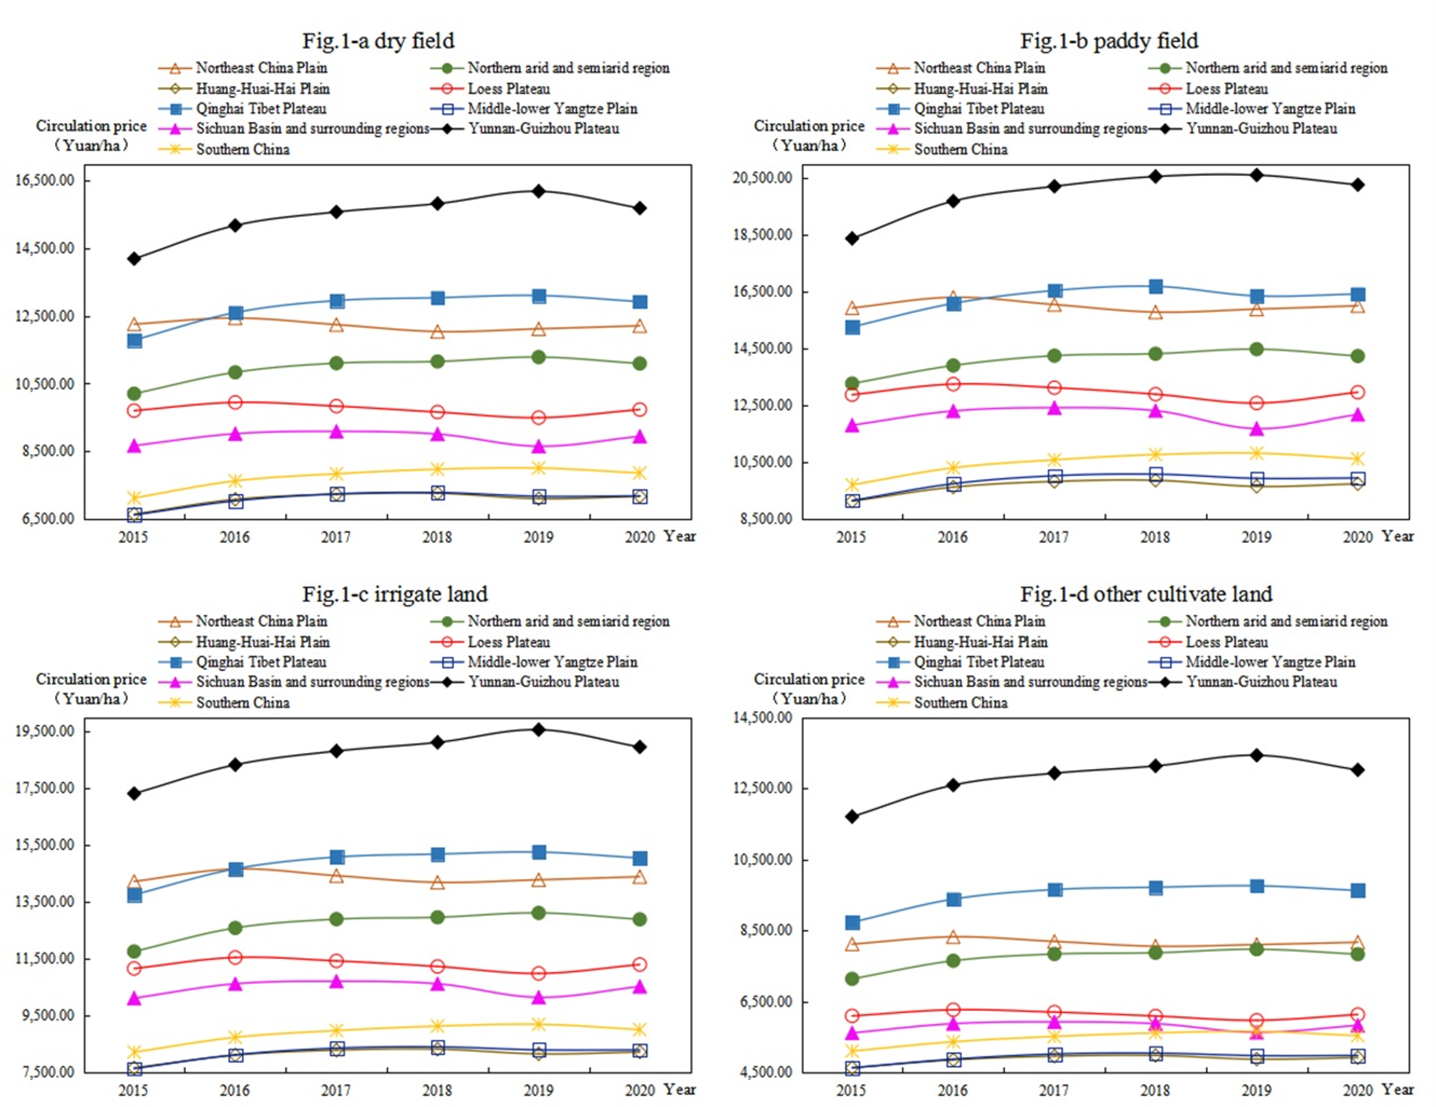
32] and compares the regional differences (). As shown in , from 2015 to 2020, the farmland circulation price in Huang-Huai-Hai Plain was always the highest, the farmland circulation price in Qinghai–Tibet Plateau was always the lowest, and the farmland circulation prices in Northeast China Plain, Loess Plateau, Middle-lower Yangtze Plain, Sichuan Basin and surrounding regions and Southern China were relatively close and at a medium level. The farmland circulation prices in Yunnan–Guizhou Plateau and northern arid and semiarid region were low. Generally, the difference in annual regional cultivated land circulation prices from 2015 to 2020 is not large, and it is closely related to China’s arable land circulation policy. In the report of the 19th National Congress of the CPC, General Secretary Xi Jinping proposed “implementing the rural revitalization strategy” and reiterated that “the land contract relationship will be kept stable and unchanged for a long time, and will be extended for another 30 years after the second round of land contracts expires”. Due to the long agricultural production cycle, extending the land contract for another 30 years can meet farmers’ needs for policy stability, which lead to further rational planning of their agricultural business practices and more resources invested in the protection and utilization of arable land, thus stabilizing agricultural development. As the contract period is extended for 30 years, the confidence of the market for contracted management rights of rural land will be improved. For enterprises, the further development of agricultural enterprises will enable a large amount of land to enter the market, improving the profits of enterprises, making the interests of farmers and enterprises closely linked and stable, and facilitating the large-scale and intensive management of land.
. Descriptive statistical analysis of farmland transfer price.
. Change of farmland circulation price from 2015 to 2020.
*3.2. Spatio-temporal Evolution Characteristics of Farmland Circulation Price*
3.2.1. Global Spatio-temporal Characteristics
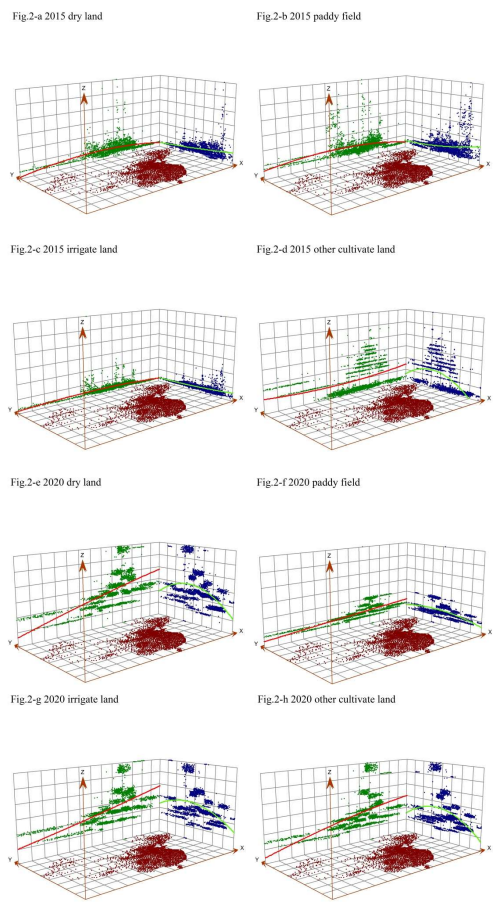
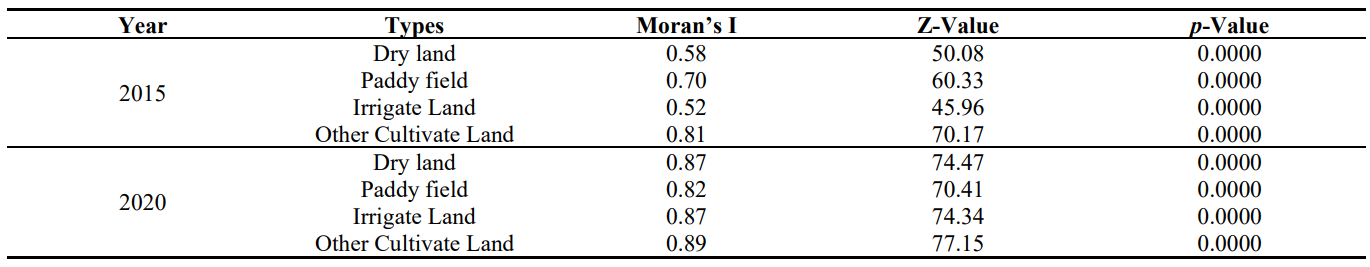
The trend analysis tool of ArcGIS10.2 software was used to draw a 3D spatial map to represent the spatial trend of farmland circulation price at the county level in 2015 and 2020 (). In the figure, X represents due east direction, Y represents due north direction, Z represents farmland circulation price, and the red and green lines represent the trend lines of east-west direction and north-south direction, respectively. As shown in , in 2015, the circulation prices of dryland, paddy field, and irrigated land show an inverted “U” trend of low in the east and west, high in the middle, and an obvious trend of high in the south and north. By contrast, the circulation prices of other cultivated land show a weak “U” trend of low in the west and high in the east, and an inverted “U” trend of high in the north and low in the south. In 2020, the four types of farmland circulation prices show an obvious inverted “U” shape with high in the east and low in the west and high in the north and low in the south. In order to explore the spatial aggregation of cultivated land circulation price, ArcGIS was used to calculate the global Moran’s I of cultivated land circulation price (), and the result passed the Z-statistic test and was extremely significant at the 1% significance level. The global Moran’s I value was positive, indicating that the correlation of cultivated land circulation price is positive, and a significant spatial agglomeration feature exists, that is, regions with high cultivated land circulation price have high aggregation degree, and regions with low cultivated land circulation price are also adjacent to each other. In addition, the 2020 Moran’s I is significantly greater than that in 2015. The spatial aggregation features are more obvious, indicating that the measures of establishing advantageous areas of special agricultural products through the transfer of farmland and promoting various forms of moderate scale operation during the 13th Five-Year Plan period have made the inter-county connection closer and the spatial aggregation gradually increased, contributing to realize the common development of county economies.
. Spatial trend of farmland circulation price in 2015 and 2020.
. Global Moran’s I of farmland circulation price in 2015 and 2020.
3.2.2. Local Spatio-temporal Characteristics
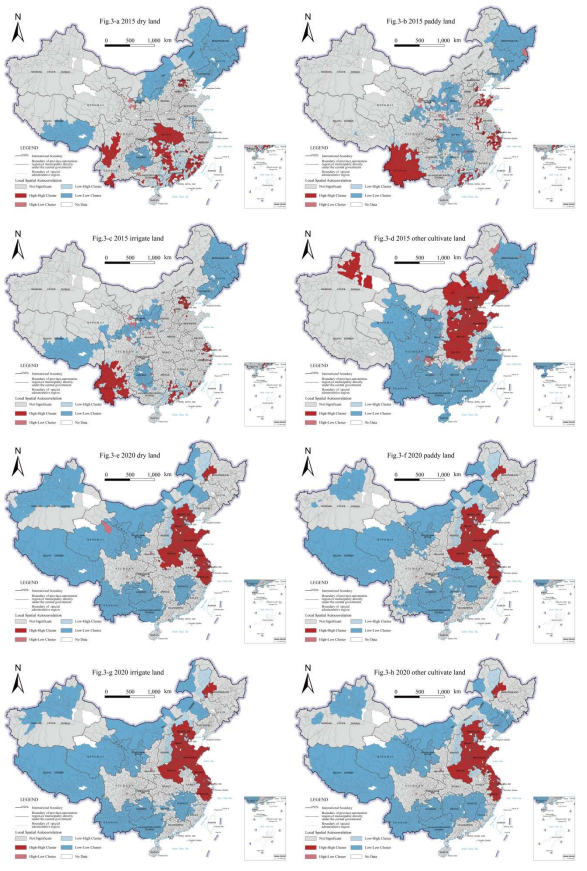
The global spatial characteristics can only reflect the spatial heterogeneity of cultivated land circulation price, but not reveal their interaction and regional aggregation characteristics. In order to further reveal the specific types and regional differences of the aggregation distribution of cultivated land circulation price, ArcGIS was used to calculate the local Moran’s I to characterize its spatial heterogeneity (). shows four kinds of distribution of farmland circulation price space aggregation degree model. Wider ranges of distribution are mainly low-low clusters and high-high clusters. In 2015, the low-low clusters of drylands, paddy fields and irrigated lands were mainly located in Qinghai–Tibet plateau such as Tibet and Qinghai, Northern arid and semiarid region such as Inner Mongolia and Xinjiang, and Northeast China Plain. The high-high clusters were mainly concentrated in Yunnan Province. The low-low clusters of other cultivated land were concentrated in northern arid and semiarid region, Sichuan Basin and surrounding regions, Yunnan–Guizhou Plateau, Southern China, and Middle-lower Yangtze Plain, with a wide distribution range. High-high clusters were concentrated in Huang-Huai-Hai Plain. In 2020, low-low clusters of farmland circulation price were mainly concentrated in the Qinghai–Tibet Plateau, Northern arid and semiarid region, Yunnan–Guizhou Plateau, Jiangxi and Hubei provinces in Middle-lower Yangtze Plain. High-high clusters were mainly concentrated in the Huang-Huai-Hai Plain and Northeast China Plain.
Above all, the farmland circulation price presents the spatial characteristics of low-low clusters in northern arid and semiarid region, Qinghai–Tibet Plateau and Yunnan–Guizhou Plateau, and high-high clusters in Huang-Huai-Hai Plain. This result is mainly due to the uneven spatial distribution of farmland resources in China. The central and western regions have complex terrains, poor natural resource endowment conditions, low level of agricultural modernization and mechanization, and simple man-land relationship. At the same time, with the accelerated urbanization process, the migration of rural young and middle-aged labor has aggravated the problem of rural poverty and aging, with the economic development relatively lagging behind. Huang-Huai-Hai plain is formed by the flood of the Yellow River and the impact of the Huaihe River, equipped with flat terrain and good natural resource endowment. As one of China’s major grain-producing areas, Huang-Huai-Hai plain’s cultivated land area accounts for 11% and food production accounts for 21.3% of the country, with quick development of agricultural facilities and a large scale, while being the most economically developed region in China, the inter-regional competition is complex. By promoting modern agriculture, vigorously developing urban agriculture and tourism and leisure agriculture, innovating modern agricultural business models, cultivating new modern agricultural business entities, and moderate scale operation makes the radiation effect of farmland transfer enhanced. In addition, farmland circulation price spatial agglomeration significantly increased in 2015–2020. During the 13th Five-Year Plan period, through the orderly implementation of regional development strategy—supporting the eastern region in spearheading development, developing the western region, revitalizing the northeast region and energizing the central region, the coordination of regional development was further enhanced, which promoted regional comparative advantage and accelerated the formation of division of labor and cooperation pattern.
. The spatial agglomeration of farmland circulation price in 2015 and 2020. Note: Maps were drawn according to the standard map with the drawing No. GS (2019) 1823, which was downloaded from the standard map service website of Ministry of Natural Resources of the People’s Republic of China. No modifications were made on the base map.
*3.3. Analysis of Influencing Factors*
3.3.1. Index Selection of Influencing Factors
As a land resource, cultivated land does not condense human labor, and the price of cultivated land is only the capitalization of relevant power. As a form of land asset, land price is the basis of human labor input for economic compensation. The binary structure of land resources and assets to the characteristics of the arable land price is essentially used for profitability performance of agricultural land. Therefore, the level of the cultivated land prices is mainly affected by the cost of production and its output capacity [
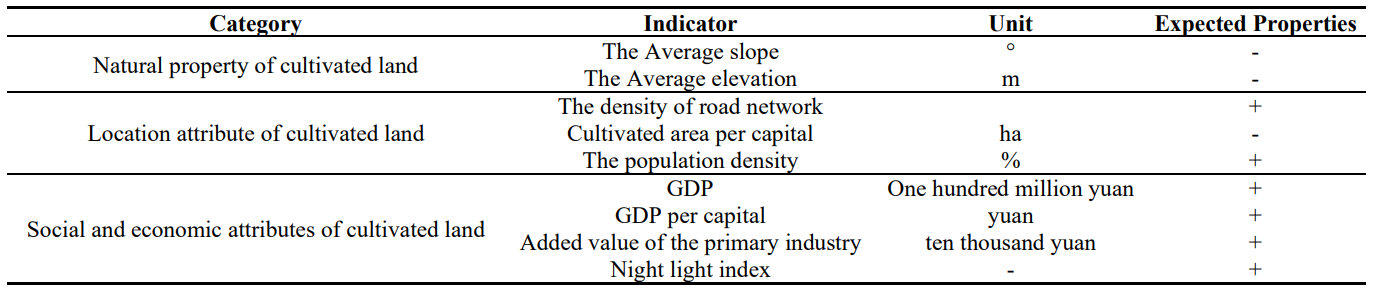
33]. In order to quantify the production cost and output capacity of cultivated land, according to the theory of land rent, the formation of land price is mainly affected by its natural property, location and labor productivity. As a natural-economic complex, the natural attributes of cultivated land affect the price mainly through the quality of cultivated land and terrain conditions. The quality of cultivated land is the result of the comprehensive effects of light, temperature, water, soil, gas and biogenesis, which determine the output efficiency of cultivated land to a certain extent and then affect the price. Topographic conditions change the use value of cultivated land by influencing the level of agricultural mechanization in the region, thus affecting the production cost of cultivated land. Therefore, the average slope and average elevation of the region are selected to reflect the natural property of cultivated land. Given the immobility of the spatial location of land, the land market among different regions lacks linkage, and the land price is obviously regional. The location attribute of cultivated land determines the utilization mode and transportation cost of cultivated land, thus affecting the price of cultivated land. Therefore, location condition is one of the determinants of the price of cultivated land. The density of the road network, cultivated land area per capita and population density were selected to reflect the location attributes of cultivated land. In addition, under the influence of social and economic conditions, the differences of land use efficiency and regional competitiveness level in the process of economic development have a certain impact on the price of cultivated land. Therefore, GDP, GDP per capita, added value of the primary industry and night light index were selected to reflect the socio-economic attributes of cultivated land. Above all, by referring to relevant studies and following the principles of scientific [
16,
34,
35], systematic and data accessibility, indicators were selected from three dimensions of cultivated land natural attribute, cultivated land location attribute and cultivated land social and economic attribute to explore its impact on farmland circulation price ().
. Index system of influencing factors of farmland circulation price.
3.3.2. Correlation Analysis
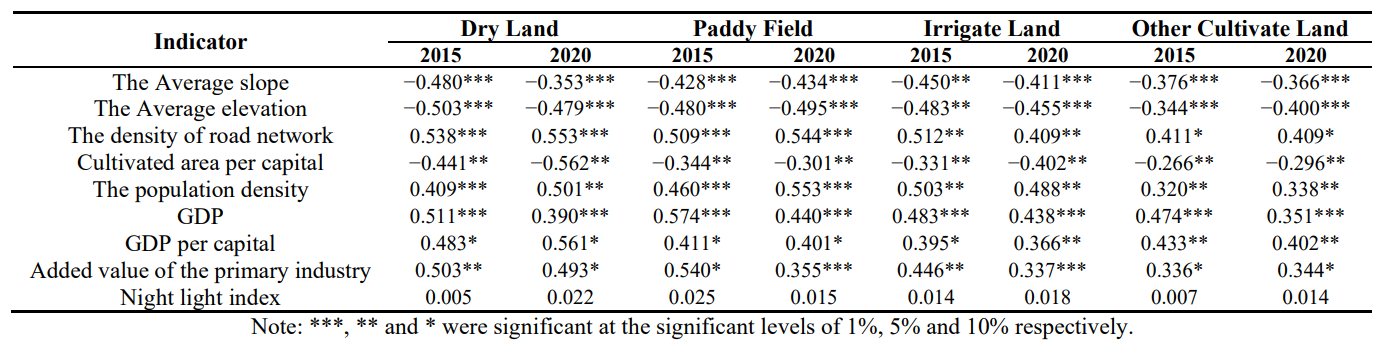
In order to reveal the correlation between farmland circulation price and influencing factors, and to analyze and screen key factors for spatial measurement, SPSS was used to calculate the correlation coefficients between farmland circulation price and nine indicators (). As shown in , except for the night light index which failed the significance test, the other eight indicators were significantly correlated with the farmland circulation price. Road network density, population density, GDP, GDP per capita, and added value of the primary industry are consistent with the expected attribute judgment, and a significant positive correlation was observed with the farmland circulation price. The average slope, average elevation, and cultivated land area per capita were significantly negatively correlated with the price of cultivated land circulation.
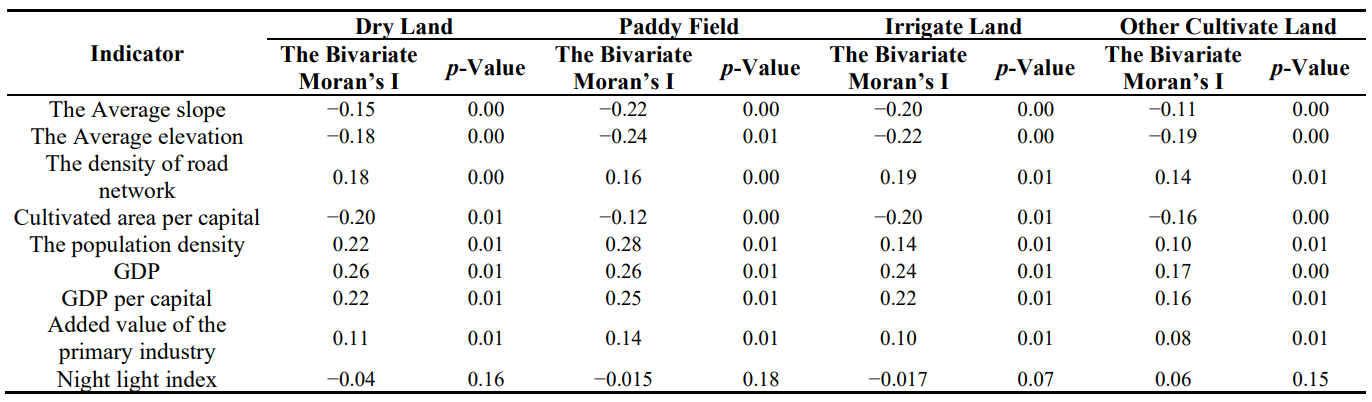
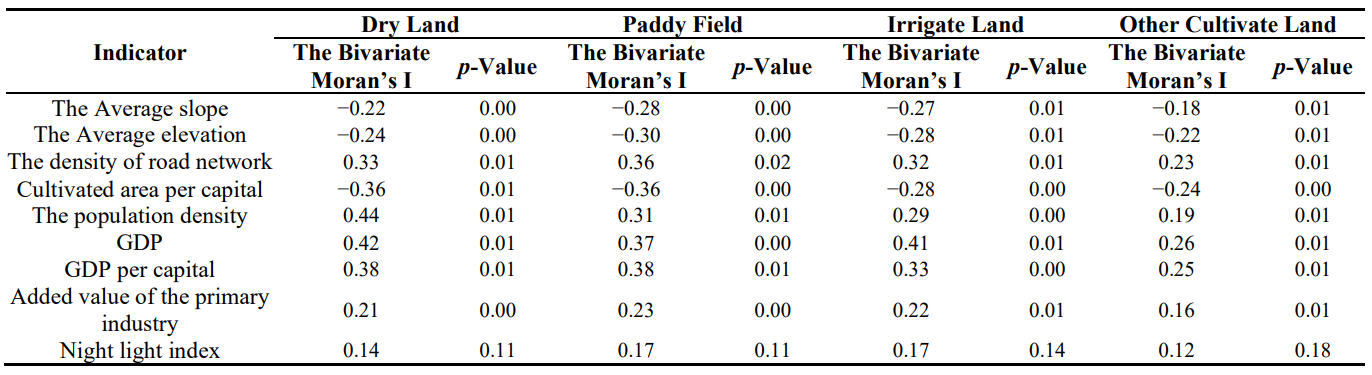
The above analysis reveals the statistical correlation between farmland circulation price and average slope, average elevation, road network density, farmland area per capita, population density, GDP, GDP per capita, and added value of the primary industry. However, the above analysis shows that the farmland circulation price has a significant spatial correlation, but statistical correlation does not mean that the influencing factors have a spatial correlation. Therefore, the spatial correlation between the farmland circulation price and the influencing factors was explored using GeoDa to calculate the bivariate Moran’s I between farmland circulation price and influencing factors ( and ). and show a significant negative spatial correlation between farmland circulation price and average slope, average elevation, and arable land area per capita. The region with smaller average slope, average elevation, and arable land area per capita has a higher farmland circulation price. A significant positive spatial correlation exists between road network density, population density, GDP, GDP per capita, and the added value of the primary industry. Moreover, the land circulation price is relatively high in the region where the location attribute of cultivated land and the social and economic conditions of cultivated land are superior. The night light index failed to pass the significance test, indicating that no significant spatial correlation exists between night light index and farmland circulation price. Overall, the spatial correlation between the socio-economic attributes of cropland and the price of cropland transfer is the highest and the spatial correlation between the natural attributes of cropland and the price of cropland transfer is the lowest. Cultivated land circulation price and average slope and elevation of the bivariate Moran’s I have not changed much, mainly because cultivated land natural attribute in the short term will not change, and it has a small influence on farmland circulation price. In terms of the time dimension, the absolute value ranking of the bivariate Moran index between the flow price of cropland and the influencing factors during 2015–2020 are all paddy land > watered land > dry land > other cropland, indicating that the spatial correlation between the flow price of paddy land and the influencing factors is stronger, and the flow price of paddy land is higher in areas with the same cropland conditions. The bivariate Moran’s I of cultivated land location attribute and social economic attribute, is significantly higher in 2020 than that in 2015, indicating that the spatial correlation between cultivated land circulation price and cultivated land location attribute and social economic attribute is strengthened during the 13th Five-Year Plan period.
. Correlation coefficient between farmland circulation price and influencing factors.
. The bivariate Moran’s I between farmland circulation price and influencing factors in 2015.
. The bivariate Moran’s I between farmland circulation price and influencing factors in 2020.
3.3.3. Spatial Econometric Analysis
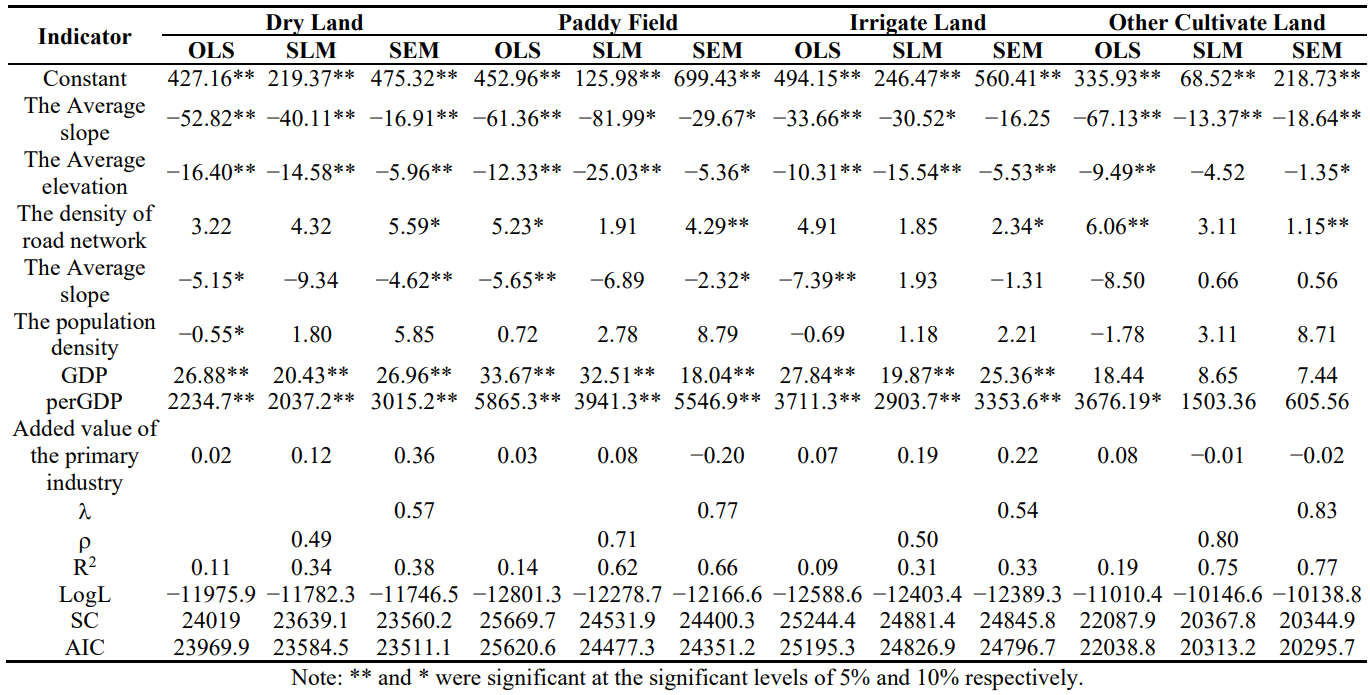
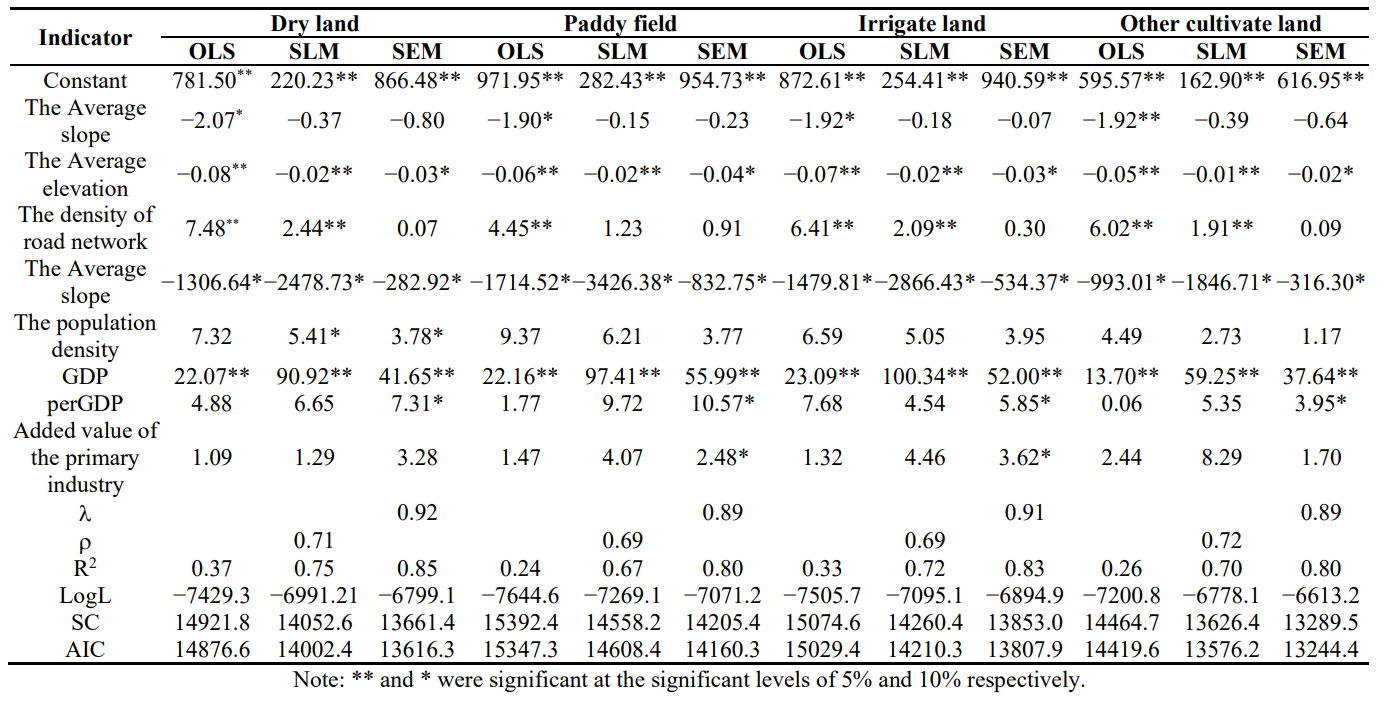
In order to explore the quantitative relationship between farmland circulation price and influencing factors, spatial econometric analysis was carried out by combining the key factors selected above with significant spatial correlation with cultivated land circulation price ( and ). GeoDa software was used for spatial econometric analysis. Owing to the different applicability of each model, OLS, SLM, and SEM model analysis results were compared, and parameters such as goodness of fit R2, log likelihood (LogL), Schwartz criterion (SC), and Akaike info criterion (AIC) were comprehensively considered. When R2 and LogL were large, the SC and AIC were small, indicating that the model is accurate and the results are scientific. As shown in and , in both 2015 and 2020, the R2 and LogL of SEM model are higher than those of SLM and OLS model, and SC and AIC are lower than those of SLM and OLS model. Therefore, this paper selects the calculation results of SEM model to analyze the influencing factors of farmland circulation price.
shows that in 2015, average slope and elevation coefficients are negative. The significance test showed that the natural property of 2015 cultivated land in all kinds of farmland circulation price has significant negative effects, namely, average slope cultivated land. Moreover, the higher the average elevation, the more difficult land use is, because machinery cannot effectively replace labor. The limitation of agricultural mechanization and modernization increases the difficulty of factor input and agricultural structure adjustment, and its agricultural production cost is higher under the condition of the same income. Road network density coefficient was positive and significant at the 1% and 5% levels, reflecting that road network density has a positive influence on farmland circulation price. Road network density reflects the level of regional infrastructure construction, and the development level of road network density determines the inter-regional material information exchange, the convenience of rural subjects to carry out agricultural activities and the cost of cash crop transportation. The spillover effect of farmland transfer price is more obvious in areas with developed road network density, which determines the transportation cost of products. However, the higher the circulation price of cultivated land, the larger proportion of cultivated land used for planting high value-added cash crops, which have higher requirements for rapid transportation. In addition, farmers in areas with convenient transportation are more likely to obtain market information, adjust and select appropriate cash crops in time according to market fluctuations, and reduce the risk caused by changes in market supply and demand relations affecting agricultural prices and market losses. The per capita cultivated land area coefficient of dryland and paddy field circulation prices passed the significance test at the level of 1% and 5%, respectively. However, the per capita cultivated land coefficient of irrigated land and other cultivated land circulation prices did not pass the significance test, indicating that the cultivated land area per capita has a negative impact on dryland and paddy field circulation prices. The coefficient of population density is positive, but it failed to pass the significance test, indicating a positive relationship between population density and farmland circulation price, but the effect is not significant. The coefficients of GDP and GDP per capita have significant positive correlation with the circulation prices of dryland, paddy field, and irrigated land, but have no significant effect on the circulation prices of other cultivated land. The added value of the primary industry did not pass the significance test. Generally, the level of regional economic development directly restricts the payment ability of cultivated land transfer. The higher the GDP and GDP per capita, the higher the agricultural output benefit of farmers, thus boosting the price of cultivated land transfer.
shows that in 2020, the average slope passed the test of significance. The average height coefficient is significantly lower than that in 2015, as the country revitalization strategy, together with the advancement of urbanization, the rapid growth of agricultural mechanization level for cultivated land scale and intensive management provided the material support. At the same time, to save arable land and labor costs, and to accelerate the transformation of agricultural industrial structure, the change of production conditions and the improvement of production efficiency are conducive to the large-scale operation of cultivated land. Thus, the restriction of the natural property of cultivated land on the price of cultivated land transfer tends to be insignificant. The density of road network was not significant in 2020. With the development of the e-commerce industry and the promotion of the rural revitalization strategy, the implementation of measures such as “village-to-village access” and “Four Good Rural Roads” is accelerated, rural infrastructure is gradually improved, agricultural production costs are significantly reduced, and the impact of transportation on the transfer price of cultivated land is further reduced. The coefficient of per capita cultivated land area was negative and significant at the level of 0.05, indicating that the rigid constraint of cultivated land resources is becoming tight. With the development of industrialization and urbanization, a large amount of cultivated land is converted into construction land. The increase of land demand and the decrease of natural supply of cultivated land resources will inevitably lead to the increase of cultivated land circulation price. Similar to 2015, population density failed the significance test. The coefficient of GDP and GDP per capita passed the significance test, and the GDP coefficient increased compared with 2015, indicating that farmers enjoy higher dividends of economic growth, and cultivated land provides higher social security coefficient of employment, medical care and pension in relatively developed areas. In addition, regional economic level is the embodiment of farmers’ income level, and farmers’ income level directly restricts the payment level in the process of land transfer. The value-added coefficient of the primary industry increased compared with that in 2015. Meanwhile, the added value of paddy field and irrigated land passed the significance test, indicating that the higher the added value of the primary industry, the higher the circulation price of paddy field and irrigated land.
. Spatial econometric analysis results in 2015.
. Spatial econometric analysis results in 2020.
4. Discussion
The farmland circulation is an effective way to optimize the allocation of cultivated land resources and improve the efficiency of land management, and it is also the only way to adjust agricultural industrial structure and develop modern agriculture. However, under the background of the current factor market reform, the unreasonable farmland circulation leads to the overcapitalization of farmland, and the land production cost rises year by year, further weakening the production function of farmland. At the same time, with the increase in farmland circulation price, the production cost of food crops has reduced the profit margin of rural operators. Driven by the comparative interests of cash crops, in order to meet the expected income of operators, they often choose to plant cash crops to make up for their loss of profit, leading to the phenomenon of “non-grain” of farmland, which has laid a hidden danger for China’s food security problem. Therefore, this study proposes how to prevent excessive capitalization of land by controlling the circulation price of cultivated land to alleviate the problem of global food security.
First, farmland circulation price needs to be timely regulated, and excessive capitalization of land should be prevented. China’s farmland circulation price presents a trend of low in the west and high in the east. Different types of cultivated land causes varied circulation prices. Thus, different geographical locations, land resource endowments, infrastructure investment levels, and differences in the quality of public service lead to regional differences of land value. Therefore, the formulation of farmland circulation price needs to be combined with the actual situation of the region, to avoid blind comparison, which results in price illusion. Urbanization and industrialization have strengthened the influence of socio-economic factors on the transfer price of arable land. The influence of the economy is relatively developed; farmers enjoy the benefits of economic development and more jobs, and the non-agricultural transfer of rural labor force increases the farmland conversion rate. The employment skills of farmers in relatively economically backward areas should be improved and surplus rural labor should be transferred. Stakeholders should strengthen the construction of cultivated land infrastructure, improve the production efficiency of cultivated land, relieve the pressure of land transaction cost, and avoid excessive capitalization of land. In addition, the tightening of arable land resources per capita makes the scarcity of arable land prominent and increases the circulation price. Under the condition of increasing tension between man and land, the cultivated land area per capita will decrease, and the fragmentation of cultivated land distribution will lead to the rise of production cost.
Second, the control system needs to be improved and measures should be taken for the transfer of cultivated land. In the face of the current food demand and the realistic background of dietary structure adjustment, Chinese food imports in the pandemic era reduced the stability of the international trade, which caused imbalance in the global food supply, and instability in agricultural prices requires perfect cultivated land protection measures to reverse the trend of non-grain of farmland and even non-food, in response to the impact of the food security problem. The fundamental reason for the conversion of cultivated land is that investors will turn to planting cash crops with higher economic added value to reduce losses after reducing production costs for the food crops they grow without surplus profit or even loss. In order to deal with such problems, the government should strengthen the guidance and subsidies for grain cultivation, set up special funds to deal with the risks of non-food conversion, and improve the efficiency of subsidies. The cultivated land monitoring mechanism of “quantity, quality, ecology and price” should be established to monitor the change of cultivated land use in real time and strictly limit the change of its use. The government should also make a regular comparison of different regions and different types of farmland transfer price differences, and conduct macro control of the land market fluctuations.
Third, the land factor market needs further deepened and improved, and a “government + market” dual drive consensus relationship needs to be formed. As the most direct expression of the supply and demand relationship in the land factor market, improving the vitality of the land factor market is the basis to ensure the reasonable price of land transfer. Therefore, deepening the land factor market is the key point of the future national economic system reform. As the rule-maker for allocation of land factors and the maintainer of market order and environment, the government should give full play to its functions of service coordination, remedy for market failure, and implementation of supervision and punishment in agricultural land market. In view of the current phenomenon of irregular circulation and unreasonable circulation price in some areas, the government needs to improve the circulation mechanism. First, by formulating and implementing farmland circulation rules, the government can ensure smooth circulation to stabilize farmers’ operating expectations and prevent transaction risks. Second, the construction of the transfer price reference system and the formation of cultivated land transfer price evaluation system should be implemented, so that the transfer of cultivated land has a more scientific formation mode to ensure that the value of cultivated land can be objectively reflected. Third, the government should strengthen the construction of land trading platform and supporting service system, build four-level trading platform of city-county-town-village, expand information publicity channels and market boundaries of land trading, address farmers’ difficulty in obtaining information and information asymmetry between transaction parties, and guide the formation of long-term and stable leasing relations. As an invisible hand, the market should exert its price lever to control the rational allocation of land resources. In accordance with the principle of “optimal allocation of market resources”, the market plays a decisive role in the allocation of land resources, which is completely rationally allocated by the market except for major regional projects or market failures. The market should perfect the price mechanism, competition mechanism, and supply and demand mechanism in land circulation, guide the free flow and rational allocation of land resources according to market pricing, market competition and supply and demand relationship, and realize the optimal utilization of land factor resources.
By studying the transfer prices of different types of cultivated land at the county level across the country, this paper provides a macro understanding of the actual conditions of China’s land transfer for developing countries, and helps to improve the lack of macro level exploration in current relevant studies, so it has a certain practical reference value. Cultivated land transfer is affected by society, economy, nature and environment. In this paper, due to the limitations of data availability and the difficulty in quantifying some indicators, the index system of influencing factors of cultivated land transfer price is not comprehensive and perfect. In essence, cultivated land transfer is the rational behavior choice of farmers under the influence of policies. This paper has not fully considered the influencing factors of farmers and policies. Therefore, how to scientifically and completely select indicators to fully and accurately reveal the influencing factors of cultivated land transfer price will be the focus of further research.
5. Conclusions
In this study, the spatial characteristics analysis model, correlation analysis, and spatial econometric model were used to analyze the spatiotemporal evolution of China’s farmland circulation price and its influencing factors using the county-level data of China’s farmland circulation price from 2015 to 2020. The following are the main conclusions:
Descriptive statistical analysis showed that farmland circulation price from 2015 to 2020 is paddy field > irrigated land > dry land > other cultivated land. The farmland circulation price in Huang-Huai-Hai Plain was always the highest, whereas that in Qinghai–Tibet Plateau was the lowest. However, the inter-annual difference of the farmland circulation price in different regions was not significant, which was primarily due to China’s policies of strictly restricting land use, preventing the conversion of farmland to non-agricultural and non-grain uses, and maintaining permanent land contract relationships.
The spatio-temporal evolution characteristics analysis showed that the circulation prices of dryland, paddy field, and irrigated land in 2015 presented a spatial pattern of “high in the south, low in the north, and inverted U-shape from east to west”, while the transfer prices of other cultivated land presented a spatial pattern of “high in the north, low in the south, low in the west, high in the east and weak in the U-shape”. In 2020, arable land circulation prices showed an inverted U-shaped spatial pattern of “high in the east and low in the west, high in the north and low in the south”. From 2015 to 2020, the global Moran’s I of farmland transfer price increased significantly, the spatial agglomeration of farmland transfer price improved, and the inter-county economic spillover effect was stronger, all of which contributed to the common development of county economy. Local Moran’s I showed that the low-low agglomerations of farmland circulation price are mainly located in the Qinghai–Tibet Plateau, whereas the high-high agglomerations are mainly concentrated in the Huang-Huai-Hai Plain.
The analysis of influencing factors showed that the circulation price of cultivated land is the result of the combined action of natural attribute, location attribute, and social economic attribute of cultivated land. Specifically, the natural attributes of cultivated land had a significant negative impact on the farmland circulation price in 2015. Among the location attributes of cultivated land, road network density has a positive impact on the circulation price of cultivated land, whereas cultivated land area per capita has a negative impact on the circulation price of dry land and paddy field. GDP and GDP per capita have a significant positive impact on farmland circulation price. With the development of land market and urbanization, the natural property of cultivated land weakens its restriction on the circulation price of cultivated land, whereas the social and economic property of cultivated land strengthens continuously. At the same time, the increase of land demand and the decrease of natural supply of cultivated land lead to the tightening of the rigid constraint of cultivated land, and the negative impact of cultivated land area per capita on the price of cultivated land transfer becomes increasingly significant.
Acknowledgments
This work was supported by the [Chongqing Natural Science Foundation project] grant number [CSTB2022NSCQ-MSX027], and [Chongqing Social Science Planning project] grant number [2022NDYB51], and [Southwest University Research and Interpretation of the Party's 20 Spirit Special project] grant number [SWU2209046].
Author Contributions
X.L.: Investigation, Methodology, Formal analysis, Writing - original draft, review & editing. J.W.: Validation, Visualization. C.W.: Conceptualization, Resources, Data curation, Supervision, Funding acquisition.
Ethics Statement
Not applicable.
Informed Consent Statement
Not applicable.
Funding
This research was funded by [Chongqing Natural Science Foundation Project] grant number [CSTB2022NSCQ-MSX027], and [Chongqing Social Science Planning Project] grant number [2022NDYB51], and [Southwest University Research and Interpretation of the Party’s 20 Spirit Special Project] grant number [SWU2209046].
Declaration of Competing Interest
The authors declare that they have no known competing financial interests or personal relationships that could have appeared to influence the work reported in this paper.
References
1.
Wang XJ, He YP, Jiang HP. China’s Food Security during the 14th Five-Year Plan Period: Situation, Problems and Countermeasures.
Reform 2020,
9, 27–40.
[Google Scholar]
2.
Du T, Zhu DL, Zhang LX. Study on cultivated land transfer price in Gansu province based on spatial e-conometric model. J. Arid Land Resources Environ. 2018, 32, 56–62. https://doi.org/10.13448/j.cnki.jalre.2018.073 (In Chinese).
3.
Brümmer B, Glauben T, Lu W. Policy Reform and Productivity Change in Chinese Agriculture: A Distance Function Approach.
J. Dev. Econ. 2006,
81, 61–79.
[Google Scholar]
4.
Xu ZG, Tan X, Zheng XY, Lu W. The Influence and Constraints of the Development of Farmland Transfer Market on Grain Production.
Chin. Rural Econ. 2017,
9, 26–43.
[Google Scholar]
6.
Lan Y, Jiang M, He J. Comparative Study on the Stability of Land Management Rights of Family Farms under Three Circulation Models. J. Agrotech. Econ. 2019, 12, 21–33. https://doi.org/10.13246/j.cnki.jae.2019.12.002 (In Chinese).
7.
Li WM, Chen TT. Research on Novel Land Transfer Mode Operation Mechanism of Internet+Land Transfer—based on Experience Survey on Tuliuwang. Prices Monthly 2017, 10, 81–85. https://doi.org/10.14076/j.issn.1006-2025.2017.10.17 (In Chinese).
8.
Peng XX. The Functional Review and the Reform Path of the Chinese Rural Land Transfer System. Theor. Explor. 2022, 1, 120–128. https://doi.org/10.3969/j.issn.1004-4175.2022.01.016 (In Chinese).
9.
Wang HJ. The Path Evolution, Practice Dilemma and Reflection of Contracted Land Withdrawal. J. Nanjing Agric. Univ. Soc. Sci. Ed. 2022, 22, 126–134. https://doi.org/10.19714/j.cnki.1671-7465.2022.0024 (In Chinese).
10.
Wang JY, Li XB, Xin LJ. Spatial-temporal Variations and Influential Factors of Land Transfer in China. J. Nat. Resources 2018, 33, 2067–2083. https://doi.org/10.31497/zrzyxb.20171215 (In Chinese).
11.
Wang Q, Wang YS, Du GM. Geographical exploration of spatial differentiation characteristics and driving mechanism of cultivated land circulation in arid regions based on human–land relationships. J. Agric. Resources Environ. 2021, 38, 241–248. https://doi.org/10.13254/j.jare.2020.0204 (In Chinese).
12.
Ayala-Cantu L, Morando B. Rental markets, gender, and land certificates: evidence from Vietnam.
Food Policy 2020,
94, 101842.
[Google Scholar]
13.
Peng T. The effect of hazard shock and disclosure information on property and land prices: a machine-learning assessment in the case of Japan.
Rev. Region Res. 2021,
41, 1–32.
[Google Scholar]
14.
Abman R, Carney C. Land rights, agricultural productivity, and deforestation.
Food Policy 2020,
94, 101841.
[Google Scholar]
15.
Elahi E, Khalid Z, Cui WJ, Zhang HM. The public policy of agricultural land allotment to agrarians and its impact on crop productivity in Punjab province of Pakistan.
Land Use Policy 2020,
90, 104324.
[Google Scholar]
16.
Du T, Zhu DL. Studies on the spatio-temporal evolution and macro-mechanism of land circulation price in China. Resources Sci. 2018, 40, 2202–2212. https://doi.org/10.18402/resci.2018.11.07 (In Chinese).
17.
Zhu DL, Li YY, Zhang LX. The Nature and Source of Land Prices. China Land Sci. 2021, 40, 2202–2212. https://doi.org/10.11994/zgtdkx.20210702.160709 (In Chinese).
18.
Muraoka R, Jin S, Jayne TS. Land access, land rental and food security: evidence from Kenya.
Land Use Policy 2018,
70, 611–622.
[Google Scholar]
19.
Fei RL, Lin ZY, Chunga J. How land transfer affects agricultural land use efficiency: Evidence from China’s agricultural sector.
Land Use Policy 2021,
103, 105300.
[Google Scholar]
20.
Mu SL, Zhang YF, Wang KY. Agricultural land contract and management rights: transferring price and countermeasures in typical agricultural areas of China. J. Resources Ecol. 2012, 3, 262–268. https://doi.org/10.5814/j.issn.1674-764x.2012.03.009.
21.
Wang GM, Chen C, Cao GQ, Yi ZY. Spatial-temporal characteristics and influential factors decomposition of farmland transfer in China. Transact. Chin. Soc. Agric. Eng. 2017, 33, 1–7. https://doi.org/10.11975/j.issn.1002-6819.2017.01.001 (In Chinese).
22.
Xu Y, Li X., Xin LJ. Differentiation of scale-farmland transfer rent and its influencing factors in China. Acta Geogr. Sin. 2021, 76, 753–763. https://doi.org/10.11821/dlxb202103018 (In Chinese).
23.
Krajewska M, Szopińska K, Siemińska E. Value of land properties in the context of planning conditions risk on the example of the suburban zone of a Polish city.
Land Use Policy 2019,
109, 105697.
[Google Scholar]
24.
Kionka M, Odening M, Plogmann J, Ritter, M. Measuring liquidity in agricultural land markets.
Agric. Finance Rev. 2021,
82, 690–713.
[Google Scholar]
25.
Zhang YX, Halder P, Zhang XN, Qu M. Analyzing the deviation between farmers’ land transfer intention and behavior in China’s impoverished mountainous area: a Logistic-ISM model approach.
Land Use Policy 2020,
94, 104534.
[Google Scholar]
26.
Pu L. Research on the impact of farmers’ trust on land circulation and its price. Price Theory Pract. 2020, 429, 48–51. https://doi.org/10.19851/j.cnki.cn11-1010/f.2020.03.368 (In Chinese).
27.
Du T, Zhu DL, Zhang LX, Zhao Y. Spatial distribution and formation mechanism of cultivated land transfer price in Henan Province. Transact. Chin. Soc. Agric. Eng. 2016, 32, 250–258. https://doi.org/10.11975/j.issn.1002-6819.2016.20.033 (In Chinese).
28.
Wu XB, Wang FY, Li DS. An Empirical Analysis of the influencing factors of land transfer price in large-scale operation. Stat. Decis. 2016, 10, 87–90. https://doi.org/10.13546/j.cnki.tjyjc.2016.10.024 (In Chinese).
29.
Yang WL, Du DB, Liu CL, Ma YH. Study on the Spatial-Temporal Evolution and Internal Mechanism of Geo-Economic Connections of China. Acta Geogr. Sin. 2016, 71, 956–969. https://doi.org/10.11821/dlxb201606005 (In Chinese).
30.
Tsai PJ, Teng HJ. Role of
Aedes aegypti (Linnaeus) and
Aedes albopictus (Skuse) in local dengue epidemics in Taiwan.
BMC Infect. Dis. 2016,
16, 662.
[Google Scholar]
31.
Cui NN, Feng CC, Song Y. Spatial pattern of residential land parcels and determinants of residential land price in Beijing since 2004. Acta Geogr. Sin. 2017, 72, 1049–1062. https://doi.org/10.11821/dlxb201706008(In Chinese).
32.
Liu L, Xu XL, Liu JY, Chen X, Ning, J. Impact of farmland changes on production potential in China during recent two decades. Acta Geogr. Sin. 2014, 69, 1767–1778. https://doi.org/10.11821/dlxb201412003 (In Chinese).
33.
Yang QY. Land Economics; Science Press: Beijing, China, 2018. (In Chinese).
34.
Wang N, Zu J, Hao JM, Gu TW, Chen AQ. Influencing Factors of Farmers’ Willingness to Transfer Cultivated Land in Huang-Huai-Hai Plain. Res. Soil Water Conserv. 2020, 28, 272–278. doi:10.13869/j.cnki.rswc.2021.01.034 (In Chinese).
35.
Yang AX, Wang YH. Spatiotemporal Variations in Farmland Rents and Its Drivers in Rural China: Evidence from Plot-Level Transactions.
Land 2022,
11, 229.
[Google Scholar]