1. Introduction
Among the main causes of water scarcity are climate change [
1] and the transformations of a given area caused by primary sector extractivist activities such as mining, forestry monocultures, and the export agroindustry [
2,
3,
4,
5,
6,
7]. The continuous expansion of these activities has translated into a significant increase in the demand for factors of production, including land and water. Water has become a scarce consumer good and a fundamental input to sustain large-scale production processes. However, its availability, quality, coverage, and continuity have been substantially altered, especially for the rural population, resulting in unequal distribution of and access to water resources [
8].
The Hurst-Kolmogorov dynamics suggest that hydrological processes exhibit long-term persistence, meaning that water availability is influenced not just by isolated climatic fluctuations but broader stochastic trends [
9]. A global-scale study by [
10] confirmed that long-term climate variability is a more significant driver of water scarcity than temperature increases. Similarly, [
11] conducted a bibliometric review of the Hurst-Kolmogorov dynamic over the past 50 years, reinforcing the importance of understanding hydrological persistence in water management strategies.
Globally, it is estimated that 370 million people live in indigenous communities, and many of these people face the challenge of protecting their access and traditional rights to ancestral land and water resources. According to the United Nations, this challenge has various causes, including climate change, increasing water contamination, and depletion of fresh surface and groundwater resources. As a result, indigenous communities in many countries and territories have lost access to water they have traditionally used, as their access is physically and legally restricted. Studies have reported that mineral extraction and forestry monocultures in indigenous territories have resulted in the loss of food systems, the destruction of ecological systems and cultural land, and significant migratory processes [
8]. Water scarcity undermines indigenous peoples to maintain their traditional ways of life, especially because water is considered a community good and natural element that has a spirit, life, and power [
12,
13,
14,
15]. Thus, water becomes a subject for the Mapuche, under a dual perspective of “being in the land and being of the land” [
16,
17].
According to some authors, the Mapuche have developed a historical relationship with water, in which genetic, linguistic, and cognitive elements of the human experience converge [
18]; that is, a biocultural memory that, among other aspects, depends on the historical and territorial context in which a people develop. This Mapuche feeling and thinking or “feel-thinking” on water arises from the interaction between memory and the daily practices of individuals [
19].
This research assumes that the expansive dynamics of capital, in its extractivist form, and changing climate patterns, acting interrelatedly along with more local-scale factors, generate major pressures and tensions in territories inhabited by indigenous peoples [
20]. In the study area, both factors operate simultaneously [
21,
22,
23].
1.1. The Mapuche Situation
The Mapuche are the largest indigenous group in Chile. It is estimated that 250,000 Mapuche live in rural areas, mainly in the Biobío, La Araucanía, Los Ríos, and Los Lagos regions, in small wooden houses on plots of land typically smaller than one hectare [
24]. The Mapuche engage in subsistence agriculture, which often does not generate enough income to support a family. This forces both men and women to seek wage labor outside their communities, primarily in urban areas and forestry companies. Many Mapuche families and communities in these regions live near or adjacent to forestry plantations [
24,
25].
According to figures from CORMA (National Wood Corporation), of the 3814 legally registered Mapuche communities listed by CONADI (National Corporation for Indigenous Development), 1012 maintain collaborative relationships or provide services to forestry companies. Meanwhile, Forestal MININCO, one of Chile’s largest forestry companies, owns properties bordering approximately 12,000 hectares adjacent to 380 Mapuche communities. Similarly, Forestal Arauco’s properties border 404 communities [
26].
Recent studies indicate that the geographic expansion of forestry monocultures has significantly contributed to socio-environmental problems such as soil erosion, water scarcity in heavily forested areas, and rural population migration [
27,
28,
29,
30,
31]. Some researchers argue that Mapuche and non-Mapuche farmer communities adjacent to these plantations have not benefited significantly; instead, they have experienced multiple harms and coexistence conflicts [
5,
32,
33,
34].
This discord has historical roots in the military occupation of Wallmapu. Government-led land ownership, auctions, colonization, and community settlements contributed to a sustained loss of sovereignty, autonomy, and future development opportunities for the Mapuche. In recent decades, pressures on water, land, and forests and social tensions in Wallmapu have intensified. Water access is not guaranteed for the Mapuche, and its legal distribution remains unequal, with a clear pattern of water concentration observed at the national level [
35].
1.2. Water Crisis and Climate Patterns
According to data from the DGA in the northern and central macro-zone of our country, in the last two decades, a decrease in precipitation and the flow of the main rivers has been observed, with a reduction of 20% and 50% in the availability of water in both macro-zones, respectively, a trend that is projected to continue in the next 30 years [
36,
37].
In the Araucanía Region, precipitation has been variable over the last 60 years, with a marked reduction starting in the 90s and current annual precipitation not exceeding 800 mm, much lower than the historical average for a normal year, 1150 mm [
38]. Before the 90s, annual rainfall over 1400 mm was common in small stretches of years. In the Araucanía, rainfall deficits are estimated at 30% [
39] and in the Chol-Chol basin, the trend is similar: decreases in flow and precipitation. Data from three DGA stream gauges indicate a decrease in the flows of the Traiguén and Lumaco rivers, tributaries of the Chol-Chol River located north of the study area. The records indicate that over a period of 23 years, the flow of the Traiguén River has decreased by approximately 1 m
3/s, a figure that reaches 3.5 m
3/s for the Lumaco River and 20 m3/s for the Chol-Chol River. Temperatures in the last 23 years have increased by 0.5° Celsius [
39].
Water scarcity prompted the Chilean government to declare a water emergency in the basin, decreeing a series of measures: construction of wells, Rural Drinking Water (APR, for its initials in Spanish) projects, and distribution of drinking water with tanker trucks [
5]. However, such actions have proven insufficient against the magnitude of the problem. The lack of water has forced rural populations to migrate to areas with APRs that provide a constant supply of better-quality water [
40]. This infrastructure has had to face a demand for which it was not prepared, with a greater number of users connected, often informally, to water distribution networks [
21]. It has been estimated that 33% of the population of the Chol-Chol River basin is supplied with water from natural surface or groundwater sources such as rivers, streams, and springs, 37.2% from tanker trucks, and 29.8% by APRs [
5,
21]. Consumption is low, especially among the population supplied by trucks (under 50 L per capita) in the more arid northern part of the basin [
21].
1.3. Study Area
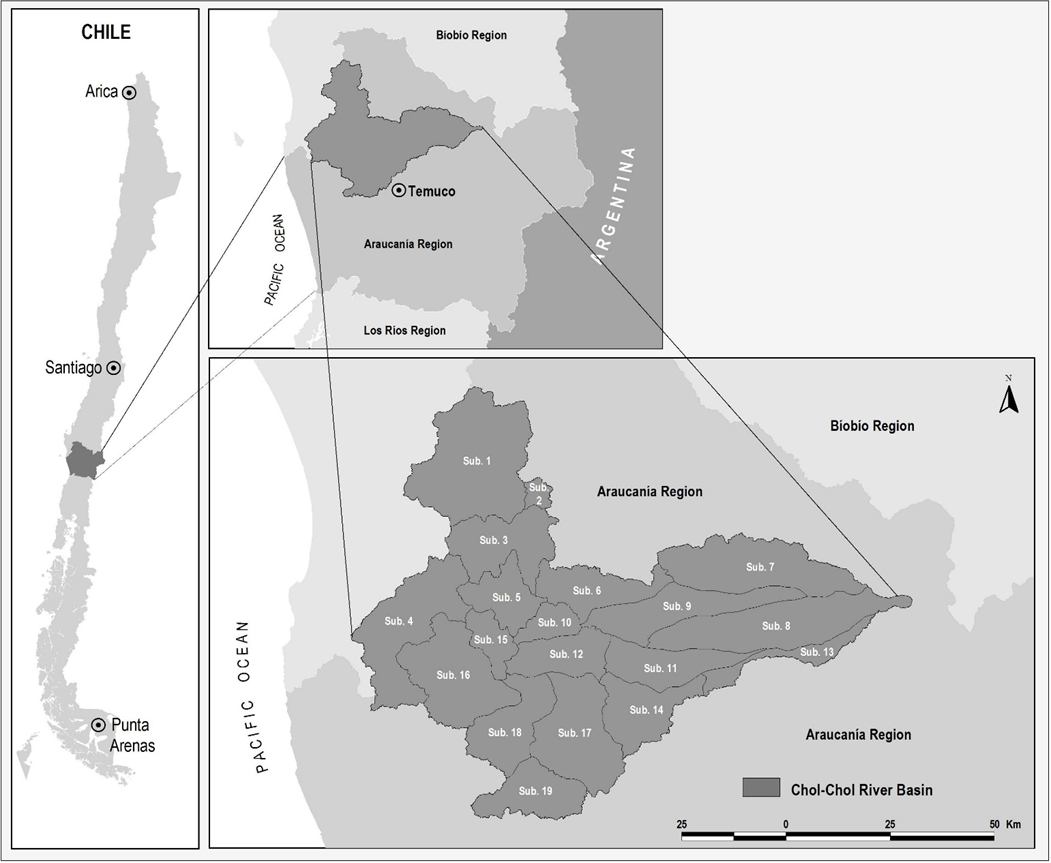
The Chol-Chol River basin is in the Araucanía Region in central Chile, with a surface area of 573,500 hectares (). Its population is 102,275, of whom 71% are Mapuche, distributed mainly in rural areas. This territory includes significant morphological diversity, which has given rise to a great variety of climates, soils, and ecosystems, shaping, over the years, different forms of occupation and socio-cultural and economic development processes, including widespread intensive forestry production, associated with radiata pine and eucalyptus monocultures, especially in the southeast and northeast. The south of the basin is wetter and has greater water availability, a situation that favors small-scale agriculture that commercially links Mapuche communities with the cities of Temuco and Nueva Imperial. The north of the basin is more arid, with greater water scarcity.
Studies based on political ecology and ethnographic methods have described the severity of limited water access in the Chol-Chol River watershed [
40], identifying negative impacts on the indigenous population and economies, such as alteration of gender and family roles, habitat fragmentation and loss of natural sources of water with cultural meaning. Due to the lack of water, many families have migrated to areas with concentrated or semi-concentrated populations that have APRs and, at present, a constant, higher-quality water supply [
40]. However, these areas have had to cope with a demand for which they were not prepared: a greater number of users have connected, often informally, to distribution networks, placing strain on well water availability [
21]. Finally, around 33% of the watershed’s population is supplied by natural surface or groundwater sources such as rivers, streams, and springs.
. Study area, Chol-Chol River basin.
2. Materials and Methods
2.1. Database and Construction of Variables
A field registry of Rural Drinking Water (APR) projects and information from datasheets on drinking water distribution with tanker trucks provided by municipalities of the basin allowed drinking water consumption variables to be constructed. Information on water rights was obtained from official registries of water use rights registered at the General Water Directorate [
41] and registrations of water use rights at offices of land and property registrars [
42] for the 2001–2015 period. Information on flows and petitioners by sub-basin was used to develop a GINI index.
Information on Mapuche land was obtained from the Land, Water, and Irrigation Fund of the National Corporation for Indigenous Development [
43] including digital coverages of Títulos de Merced (titles to historical Mapuche land granted by the Chilean government to Mapuche communities between 1880 and 1930), land purchases or subsidies (Indigenous Law of Chile, 19.253, Articles 20a and 20b, 1997–2017 period), and land demanded by Mapuche people and communities [
44]. The land-use categories (native forest, secondary native forest, agriculture, forestry plantation) were constructed based on digital coverages from the Registry of Plant Resources of Chile from 1997 and 2013 [
45].
This allowed variables of land-use change between the two periods to be generated. To assess the suitability of the land for agricultural use, the arable land category was used, based on information generated by the Natural Resource Information Center [
46]. ArcGis 10.1 was used to process the digital coverages and create thematic maps showing the spatial behavior of the analyzed variables. For the statistical analysis, a multi-variate data matrix was constructed, where each row corresponds to a sub-basin (i), and each column shows the value of the variable (). This matrix was the basis for the principal component analysis (PCA).
.
Definition and coding of the variables used in the statistical analysis.
| Variable Code (Xij) |
Variable Description |
| ShA(Area) |
Sub-basin area, value expressed in hectares |
| GINI(GINI) |
GINI index by sub-basin, expresses the concentration of water rights distribution |
| NPer(N) |
Number of people supplied with drinking water by tanker trucks by sub-basin, January 2017. |
| PerC (PeC) |
Average water consumption value per capita by sub-basin, January 2017 |
| PobT(PobT) |
Total population by sub-basin (INE, 2017). |
| DerA(Dere) |
Percentage of water rights granted to Mapuche people by sub-basin (DGA, 2021a), 2005–2017 period. |
| TieAper(A_per) |
Arable land per capita by sub-basin, expressed in hectares (CIREN, 2013) |
| TieATot(A_to) |
Total arable land by sub-basin, expressed in hectares (CIREN, 2013) |
| TieAMap(Tma) |
Total arable Mapuche land by sub-basin, expressed in hectares (CIREN, 2013) |
| PobTMap(PTMap) |
Estimated total Mapuche population by sub-basin (INE, 2017) |
| TieApermap(Aperc) |
Arable Mapuche land per capita by sub-basin, hectares per capita (CIREN, 2013) |
| DeApMap(PDM) |
Average Mapuche water rights per capita by sub-basin, liters/second/per capita (DGA) |
| DeAnoMap(PDNM) |
Average non-Mapuche water rights per capita by sub-basin, liters/second/per capita (DGA) |
| TieMap%(Tma) |
Pecentage Mapuche land by sub-basin % (CIREN,2013) |
| TieDMap(DdaT) |
Indigenous land demands, expressed as a percentage by sub-basin (CONADI, 2016) |
| TieCONADI(Tcona) |
CONADI land purchases, expressed as a percentage by sub-basin (CONADI, 2016) |
| For1997(For97) |
Forestry plantations in 1997, expressed as a percentage by sub-basin (CONAF) |
| For2013(For2013) |
Forestry plantations in 2013, expressed as a percentage by sub-basin (CONAF) |
| Cam97_2013(C972013) |
Forestry plantation change rate 1997–2013, expressed as a percentage by sub-basin (CONAF) |
| Nati_1997(Nati_1997) |
Native forest in 1991, expressed as a percentage by sub-basin (CONAF) |
| Nati_2013 (Nati_2013) |
Native forest in 2013, expressed as a percentage by sub-basin (CONAF) |
| NatiCamb97(NaCam97) |
Native forest change rate 1997–2013, expressed as a percentage by sub-basin (CONAF) |
| Renob_1997(R1997) |
Secondary native forest percentage 1997, (% by sub-basin; CONAF) |
| Renob_2013(R2013) |
Secondary native forest percentage 2013, (% by sub-basin; CONAF) |
| Cambrenob(Cbrenb) |
Secondary native forest change rate 1997–2013, (% by sub-basin; CONAF) |
| Agro1997(A97) |
Agricultural use percentage 1997, (% by sub-basin; CONAF) |
| Agro2013(A2013) |
Agricultural use percentage 2013, (% by sub-basin; CONAF) |
| Camagro (Ca) |
Agricultural use change rate 1997–2013, (% by sub-basin; CONAF) |
| APR_P(APR_P) |
Average water consumption per capita per APR project (*) by sub-basin, January 2018 |
| APR_F(APR_F) |
Average water consumption per family per APR project (*) by sub-basin, January 2018 |
2.2. Statistical Analysis
The Principal Component Analysis (PCA) technique is based on a set of correlated data and aims to reduce the number of explanatory variables using linear transformations. The result is a set of new variables, called principal components, which together describe a phenomenon more efficiently while minimizing redundancy among the original variables.
PCA is a dimensionality reduction technique that transforms a set of potentially correlated variables into a smaller set of linearly uncorrelated variables, known as principal components (PCs). This transformation is achieved by identifying the directions (eigen vectors) along which the variance in the data is maximized [
47,
48]. The first principal component captures the highest variance in the dataset, while subsequent components capture progressively lower variance, subject to orthogonality constraints. This ensures that each principal component is independent of the others.
This study applied PCA to identify underlying patterns in the dataset and reduce redundancy among variables. The principal components that explained at least 70% of the observed variability were retained for further analysis [
49]. These components were then used as regressors in linear regression models, where different dependent variables (Y) extracted from the data matrix were analyzed. By incorporating these transformed variables, the models aimed to improve interpretability and reduce collinearity issues that often arise in multi-variate regression analysis.
In the final stage, the models with the best
R2 fit were selected, ensuring they contributed to explaining the relationships between observed drinking water consumption in the Chol-Chol River basin and the rest of the variables. Additionally, the complete set of variables before and after transformation was visualized through figures, facilitating a clearer understanding of the impact of PCA on data structure. The mathematical equations used for the PCA transformation, including the eigenvalue decomposition and normalization process, are presented to enhance transparency and reproducibility.
Data analysis was performed using R [
50] ensuring robust statistical computations and visualization.
2.3. Field Activities
In 2018 and 2019, information was collected in the field through visits to different basin areas. Then, twelve semi-structured qualitative in-person interviews were conducted ([
51,
52]; ). The outline topics were grouped into worldview, forms of water use, causality and processes, adaptive mechanisms, and land and water resources management. The interviews were recorded with prior informed consent of the interviewees. Once the material had been transcribed and coded into categories, a qualitative content analysis was performed [
53,
54]. Data extraction, summarization, and reduction were carried out using Schreier’s interpretive approach [
55]. In addition, a specific questionnaire was applied to APR administrators and operators, 34 in total, providing information with which technical datasheets on each project were created. The ethical standards of interviewee confidentiality and anonymity were upheld.
.
Description of the interviews conducted in terms of position/category, commune, and coding.
| Position/Category |
Number of Interviews |
Commune/Zone |
Code |
| Managers of drinking water distribution with tanker trucks, municipal officials (Directorate of Municipal Works, Directorate of the Environment, and Directorate of Social Development) |
8 |
Traiguén, north
Chol-Chol, south
Nueva Imperial, south
Victoria, east
Perquenco, east
Lautaro, south-north
Lumaco, north
Purén, north
|
E3-Tr, 2017
E5-CH, 2017
E7-NI, 2017
E8-V, 2017
E9-P, 2017
E10-L, 2017
E11-Lu, 2017
E12-Pu, 2017
|
| Public service professional in charge of APR design and monitoring (Hydraulic Works Directorate, (DOH, for its acronym in s), MOP). |
1 |
Temuco (1) |
E2-T, 2017 |
| Lonkos of Mapuche communities of the south and north Chol-Chol River basin. |
3 |
Galvarino, south
Traiguén, north
Chol-Chol, south
|
E1-G, 2017
E4-Tr, 2017
E6-CH, 2017
|
3. Results
3.1. Models and Principal Components (PCs)
One of the models with a poor observed fit is CONADI land (). This algorithm is associated, in terms of statistical significance, with principal components 2 and 3, particularly the variables “land demanded by Mapuche communities” and “forestry plantations”. This relationship suggests that CONADI acquired part of the Mapuche land in the basin and that this land had forestry plantations when it was acquired, between 1997 and 2013. It can also be inferred that these purchases have been in areas with low arable land availability. The lack of quality farmland and its market value has obligated CONADI to acquire properties with smaller surface areas for agricultural use and greater surface areas suitable for forestry.
The arable Mapuche land model is linked to two statistically significant components (). One of them is associated with the decrease in secondary native vegetation in various parts of the basin between 1997 and 2003, a process that has allowed land to be made available for agricultural production. This model also reflects the decreased forestry plantations in various parts of the basin. This algorithm is associated with components 1 and 2.
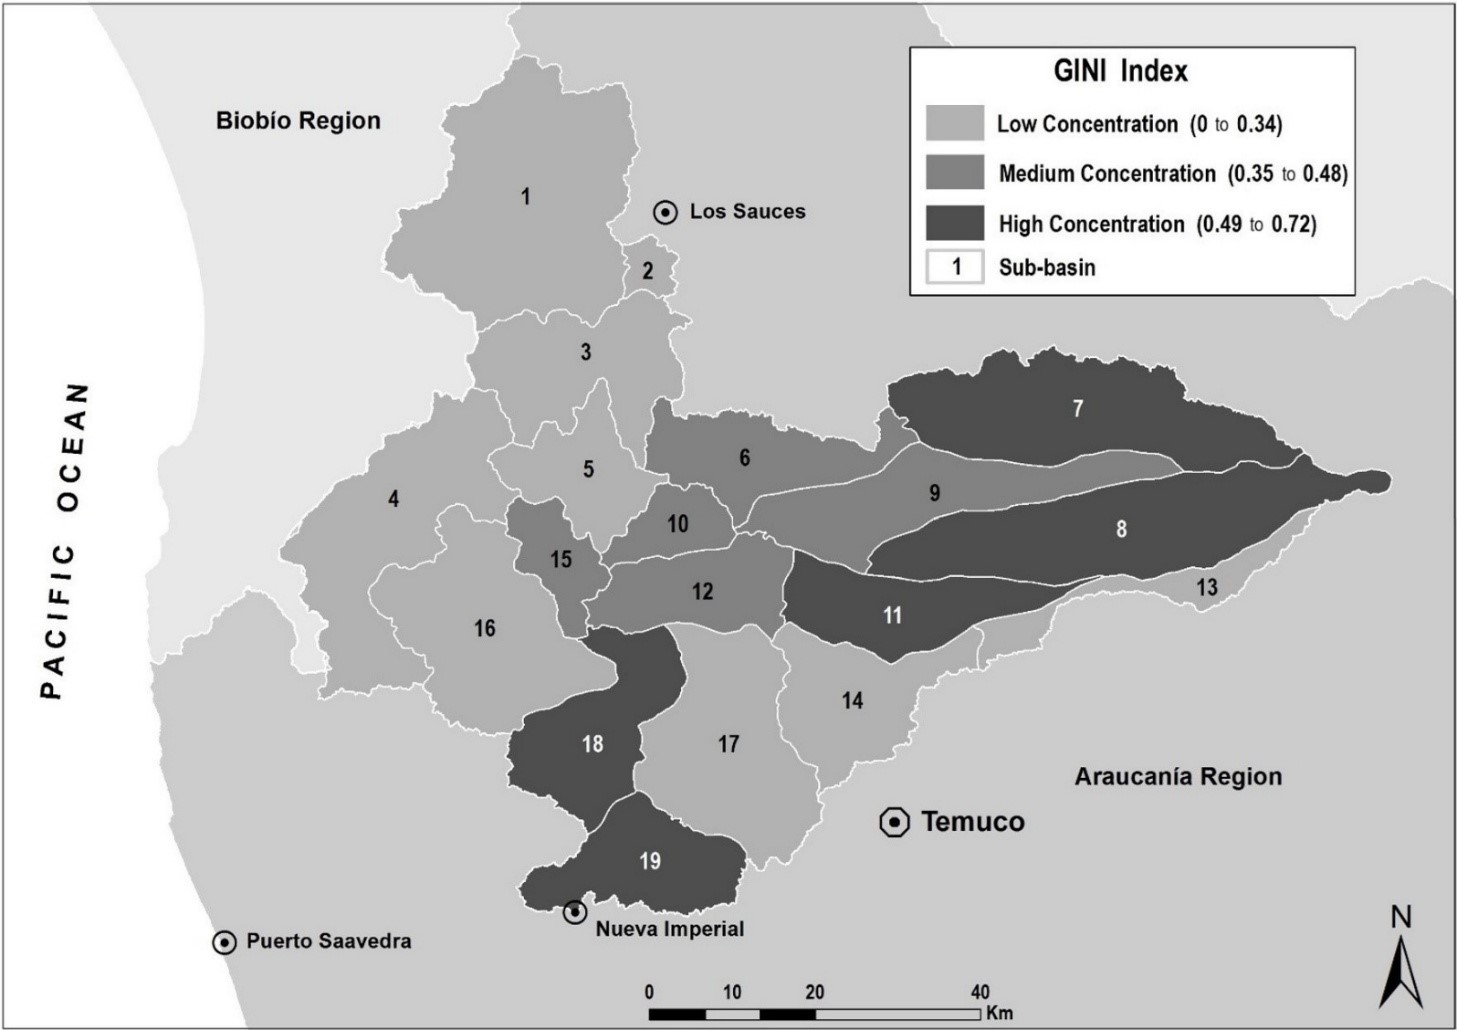
The main relationship is that fewer water rights have been legally established in areas with a greater concentration of indigenous land. Water in the basin is concentrated among non-Mapuche agricultural and forestry operations located on the best agricultural land toward the west of the basin (). However, a water rights concentration is also observed within Mapuche land, especially in agricultural areas and those with arable land located near the cities of Nueva Imperial, Chol-Chol, and Temuco. This model shows that Mapuche land has more soil dedicated to crops compared to other uses such as native vegetation or forestry plantations. Basically, but not exclusively, the Mapuche land in the basin is used for agriculture.
The total population model is explained by components 1, 2, and 4. The relationships of interest: as the concentration of the Mapuche and non-Mapuche population increases, the farmland area of the properties increases, as does the intensity of land-use changes from non-agricultural to agricultural uses between 1997 and 2013. The model positively associates population with greater land-use pressure. Inversely, it links population and land-use changes with a decrease in native vegetation, especially secondary vegetation. The clearing of native vegetation to prepare land for agriculture or livestock is a possible explanation.
This model also associates the “population” variable with water rights granted; in areas of the basin with a greater Mapuche population, more water rights (number of petitions and flows) have been granted to non-indigenous people, including mid-size and large farmers, as well as forestry companies. This demonstrates a strong process of water resources concentration, especially in the west and south of the Chol-Chol River basin (). presents the results of the regression model.
.
Linear regression models associated with land and population, significance (p-value) of the principal components (PCs) in the model, and correlation (r) of PCs with original variables ($$X_{ij}$$).
| Linear Model |
Component (PC) and Significance Value |
Explanatory Variable
($$\bm{X}_{\bm{i} \bm{j}}$$) |
R |
CONADI land = 29.79 − 2.12CP1 − 7.34CP2 − 5.45CP3 + 0.02CP4
R2 Aj = 0.70
where:
CONADI land: CONADI land purchases, expressed as a percentage by sub-basin and CP1, CP2, CP3 and CP4: principal components regression coefficients
|
CP1(0.1865) |
Agro2013 |
0.84 |
| Camagro |
0.80 |
| Agro1997 |
0.77 |
| DeAnoMap |
0.77 |
| T_Mapupor |
0.74 |
| Renob_2013 |
−0.70 |
| CP2(0.0032) |
TieDMap |
0.81 |
| For1997 |
0.74 |
| CP3(0.0277) |
APR_P |
0.87 |
| APR_F |
0.86 |
| CP4(0.9949) |
Shape_Area |
0.78 |
| TieAMap |
0.67 |
Total Mapuche population = 5284.17 + 1436.46CP1 − 1391.41CP2 + 489.76CP3 + 1796.25CP4
R2 Aj = 0.71
where:
Total Mapuche population: Estimated total Mapuche population by sub-basin and CP1, CP2, CP3 and CP4: principal components regression coefficients.
|
CP1(0.0096) |
Agro2013 |
0.87 |
| Camagro |
0.82 |
| Agro1997 |
0.81 |
| DeAnoMap |
0.80 |
| T_Mapupor |
0.70 |
| CP2(0.0171) |
Arab_Tot |
0.72 |
| Ara_percap |
0.70 |
| TieDMap |
−0.78 |
| CP3(0.3899) |
APR_P |
0.85 |
| APR_F |
0.85 |
| CP4(0.0304) |
ShA |
0.73 |
| TieAMap |
0.69 |
Arable Mapuche land = 4799.89 + 719.42CP1 + 113.49CP2 + 315.99CP3 + 1506.19CP4
R2 Aj = 0.71
where:
Arable Mapuche land: Total arable Mapuche land by sub-basin, expressed in hectares and CP1, CP2, CP3 and CP4: principal components regression coefficients
|
CP1(0.0109) |
TieMap% |
0.81 |
| Agro2013 |
0.77 |
| Camagro |
0.72 |
| Agro1997 |
0.71 |
| Num_person |
0.70 |
| Renob_1997 |
−0.79 |
| Renob_2013 |
−0.81 |
| CP2(0.6334) |
TieCONADI |
0.77 |
| Arab_Tot |
0.74 |
| Ara_percap |
0.71 |
| For1997 |
−0.73 |
| TieDMap |
−0.75 |
| CP3(0.2911) |
APR_P |
0.85 |
| APR_F |
0.85 |
| CP4(0.0041) |
ShA |
0.70 |
Mapuche land = 35.56 + 5.85CP1 − 6.40CP2 + 0.22CP3 − 0.15CP4
R2 Aj = 0.71
where:
Mapuche land: Percentage Mapuche land by sub-basin and CP1, CP2, CP3 and CP4: principal components regression coefficients
|
CP1(0.0053) |
Agro2013 |
0.89 |
| Camagro |
0.85 |
| Agro1997 |
0.82 |
| DeAnoMap |
0.79 |
| For2013 |
−0.74 |
| CP2(0.0054) |
TieCONADI |
0.84 |
| Ara_percap |
0.71 |
| TieDMap |
−0.73 |
| CP3(0.9124) |
APR_P |
0.86 |
| APR_F |
0.85 |
| CP4(0.9499) |
ShA |
0.78 |
| TieAMap |
0.67 |
Total population = 7279.42 + 1300.37CP1 − 1174.5CP2 + 669.72CP3 + 2439.6CP4
R2 Aj = 0.73
where:
Total population: Total population by sub-basin and CP1, CP2, CP3 and CP4: principal components regression coefficients
|
CP1(0.0133) |
Agro2013 |
0.85 |
| Camagro |
0.80 |
| Agro1997 |
0.79 |
| DeAnoMap |
0.79 |
| TieMap% |
0.73 |
| Renob_1997 |
−0.70 |
| Renob_2013 |
−0.71 |
| CP2(0.0307) |
TieCONADI |
0.81 |
| Arab_Tot |
0.73 |
| TieDMap |
−0.78 |
| CP3(0.2413) |
APR_P |
0.85 |
| APR_F |
0.85 |
| CP4(0.0079) |
ShA |
0.71 |
| TieAMap |
0.70 |
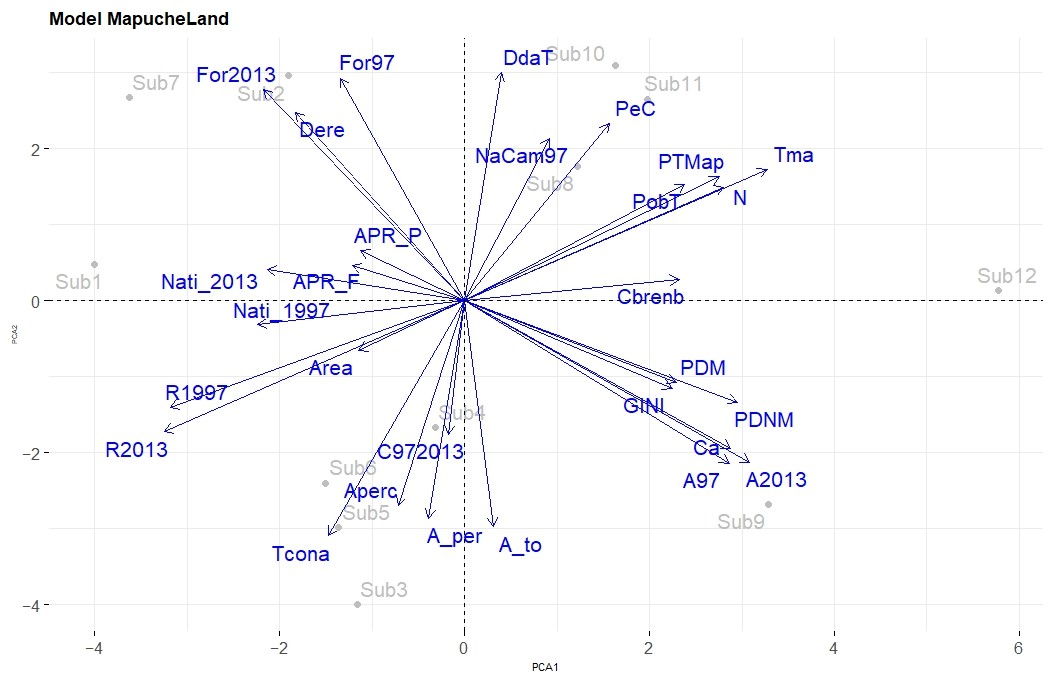
, as an example, shows the original variables and the values of the coefficients of the PCA 1 and 2 of the Mapuche Land model (Mapuche Land = 35.56 + 5.85CP1 − 6.40CP2 + 0.22CP3 − 0.15CP4).
.
Original variables and the values of the coefficients of the PCA 1 and 2 of the Mapuche Land model (Mapuche Land = 35.56 + 5.85CP1 − 6.40CP2 + 0.22CP3 − 0.15CP4).
| Variable |
PCA 1 |
PCA 2 |
| ShA |
−0.2853 |
0.1636 |
| GINI |
0.5586 |
0.2871 |
| Nper |
0.6980 |
−0.3720 |
| PerC |
0.3891 |
−0.5803 |
| PobT |
0.5935 |
−0.3793 |
| DerA |
−0.4553 |
−0.6173 |
| TieAper |
−0.0969 |
0.7132 |
| TieATot |
0.0781 |
0.7416 |
| PobTMapu |
0.6854 |
−0.4054 |
| TieAper |
−0.1791 |
0.6731 |
| DeApMapu |
0.5704 |
0.2680 |
| DeAnoMap |
0.7349 |
0.3327 |
| T_Mapupor |
0.8150 |
−0.4300 |
| TieDMap |
0.0983 |
−0.7472 |
| TieCONADI |
−0.3675 |
0.7714 |
| For1997 |
−0.3347 |
−0.7291 |
| For2013 |
−0.5415 |
−0.6912 |
| Cam97_2013 |
−0.0436 |
0.4389 |
| Nati_1997 |
−0.5572 |
0.0784 |
| Nati_2013 |
−0.5308 |
−0.1014 |
| NatiCamb97 |
0.2275 |
−0.5316 |
| Renob_1997 |
−0.7939 |
0.3511 |
| Renob_2013 |
−0.8095 |
0.4303 |
| Cambrenob |
0.5777 |
−0.0702 |
| Agro1997 |
0.7131 |
0.5329 |
| Agro2013 |
0.7681 |
0.5298 |
| Camagro |
0.7174 |
0.4837 |
| APR_P |
−0.2797 |
−0.1643 |
| APR_F |
−0.3034 |
−0.1147 |
In , component 1 is represented on the ordinate axis and component 2 on the abscissa axis, with the percentage of explained variance. Both components explain more than 50% of the observed variability. The longer vectors provide greater weight in the explanation. The red points show the spatial relationship of the sub-basins with the original variables and allow them to be grouped.
. Water rights concentration in Chol-Chol River basin (GINI index).
. Representation of the main components 1 and 2 of the Mapuche Lands model (Mapuche land = 35.56 + 5.85CP1 − 6.40CP2 + 0.22CP3 − 0.15CP4) and the grouping relationship with the subbasins that are part of the Chol-Chol watershed.
It bears mentioning that in the Chol-Chol River basin, there are 25,311 Mapuche farms, of which only 442 have registered water rights (1.7%), with a theoretical availability of 2.8 L/s [
21]. In Chile, only 2.2% of water is being used by indigenous populations under the current legal regime of water use ([
35]; Water Code, 1981).
On average, each Mapuche in the Chol-Chol River basin has 2.8 L per second, while a non-Mapuche has 31.2 L per second, an amount that allows production based on traditional annual crops, as well as market garden products and even conversion to other more profitable uses such as small orchards. In the northern zone, most Mapuche farms do not have water rights, a situation that prevents them from applying for government subsidies such as irrigation projects or Rural Drinking Water (APR) projects.
Many of the water rights granted to non-indigenous people (forestry companies) are not used by their owners, generating a speculative process associated with the “
water market” in the Chol-Chol watershed. Therefore, it is paradoxical that water is distributed using tanker trucks in areas with established rights. Water rights continue to be established and concentrated among mid-sized agricultural properties and forestry companies, increasingly limiting access by Mapuche people and communities [
56].
In order to access water a strategy has been observed. An
ecclesiastical institution in the Araucanía Region that has registered rights to water in the Chol-Chol river, was “
visionary and protected, so to speak, this area by registering water rights”, adding that this organization “
cedes rights to indigenous committees and communities for APRs. It’s an important actor for building APRs, I mean they start looking for all those committees that have water, that take water from the Chol, its practically all of them” (E2-T, 2017). His opinion is categorical: “
they are important, they extract 2000 and 3000 liters per second over there at one point in the river, they’re giving it for free, they’re giving it to the communities, for irrigation, to the APRs”.
However, the government still has a significant water reserve in the Chol-Chol River watershed, which has been estimated at more than 11,000 L of water per second [
21]. These resources could be redistributed among Mapuche people and communities in the northern part of the watershed, thereby reversing the major water concentration process observed and allowing productive development based on land and water as primary sociocultural axes. However, assuming that there will be a more equitable future water distribution as a public policy standard, it asks if Mapuche communities have appropriate land, arable land, for more intensive irrigation.
It should be noted that the demand for water has been constantly increasing in the Chol-Chol watershed [
41], especially since the 1980s. This is reflected in a continuous increase in requests for rights and the amount of water granted, which peaked in 2016 with more than 500 requests and 440,000 L/s delivered. Only from 2018 onwards has a decrease with 36 requests and 112.2 L/s granted by the DGA.
3.2. Modeling and Water Scarcity
Of the set of analyzed variables and defined principal components, a group of three models with the best goodness of fit, statistically significant with
R2ajust values over 0.85 (
), was selected.
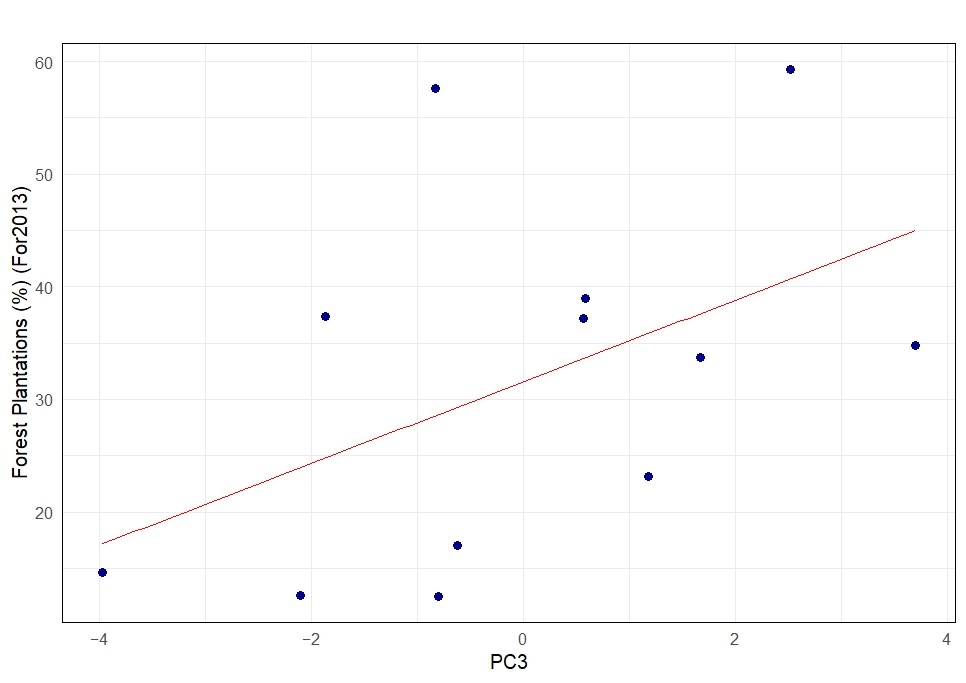
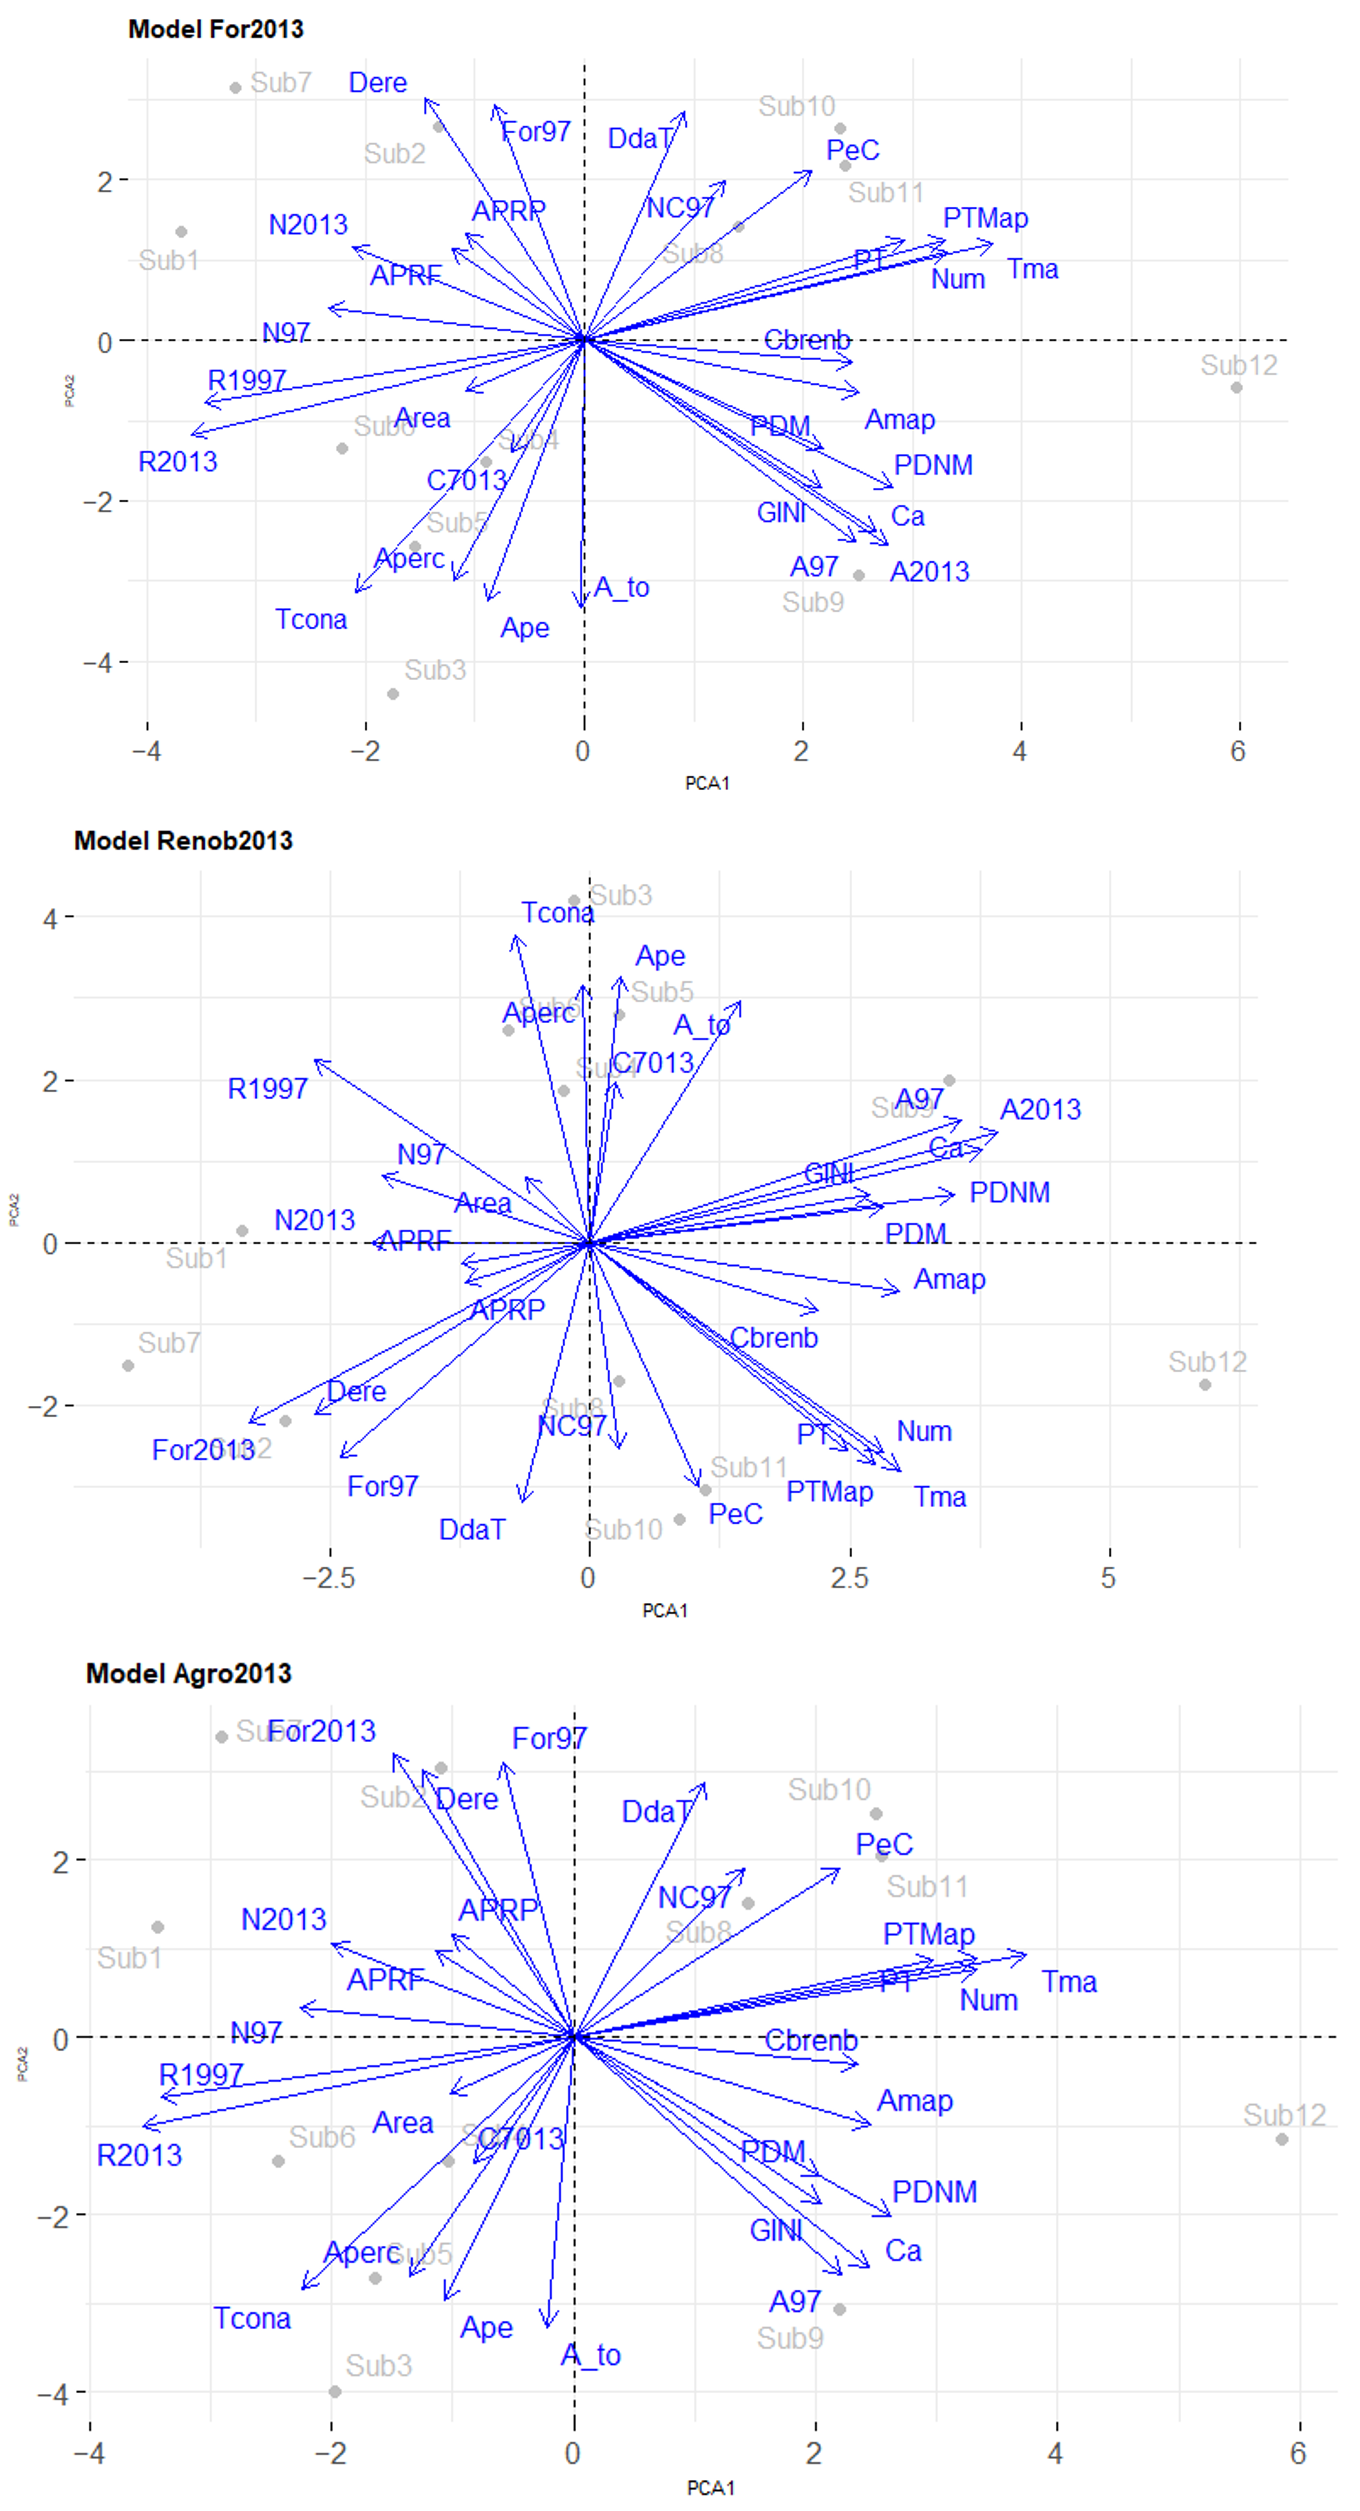
shows the relationship between principal component 3 and the “forestry plantations” response variable for the For2013 regression model, and
shows the principal components of the model For2013, Renob2013, and Agro 2013.
.
Linear regression models associated with water scarcity, significance (p-value) of the principal components (PCs) in the model, and correlation (r) of PCs with original variables ($$X_{i j}$$).
| Linear Model |
Component (PC) and Significance Value |
Explanatory Variable
($$\bm{X}_{\bm{i} \bm{j}}$$) |
R |
For2013 = 31.58 − 2.31CP1 − 4.47CP2 − 3.62CP3 − 1.02CP4
R2 Aj = 0.86
where:
For2013: Forestry plantations in 2013, expressed as a percentage by sub-basin and CP1, CP2, CP3 and CP4: principal components regression coefficients.
|
CP1(0.0088) |
TieAMap% |
0.88 |
| PobTMap |
0.78 |
| Num_person |
0.78 |
| Renob_1997 |
−0.82 |
| Renob_2013 |
−0.85 |
| CP2(0.0005) |
Arab_Tot |
0.79 |
| Ara_percap |
0.77 |
| TieCONADI |
0.74 |
| Arapercama |
0.70 |
| Derecho |
−0.71 |
| CP3(0.0041) |
APR_P |
0.82 |
| APR_F |
0.82 |
| CP4(0.3570) |
ShA |
0.77 |
| TieAMap |
0.69 |
Renob_2013 = 9.03 − 1.96CP1 + 1.37CP2 + 0.38CP3 + 1.62CP4
R2 Aj = 0.93
where:
Renob_2013: Secondary native forest percentage 2013, and CP1, CP2, CP3 and CP4: principal components regression coefficients.
|
CP1(0.0001) |
Agro2013 |
0.88 |
| Camagro |
0.85 |
| Agro1997 |
0.80 |
| DeAnoMap |
0.79 |
| For2013 |
−0.74 |
| CP2(0.0001) |
TieCONADI |
0.85 |
| TieApermap |
0.73 |
| TieAper |
0.71 |
| TieAMap |
−0.72 |
| CP3p = 0.1224 |
APR_P |
0.86 |
| APR_F |
0.86 |
| CP4p = 0.0006 |
ShA |
0.79 |
| TieAMap |
0.64 |
Agro2013 = 54.07 + 4.15CP1 + 5.05CP2 + 2.80CP3 − 1.45CP4
R2 Aj = 0.87
where:
Agro_2013: Agricultural use percentage 2013, and CP1, CP2, CP3 and CP4: principal components regression coefficients
|
CP1(0.0009) |
TieMap% |
0.90 |
| Num_person |
0.80 |
| PobTMapu |
0.80 |
| Pob_Total |
0.71 |
| Renob_1997 |
−0.82 |
| Renob_2013 |
−0.86 |
| CP2(0.0005) |
TieAtot |
0.79 |
| TieAMap |
0.71 |
| Derecho |
−0.72 |
| For1997 |
−0.74 |
| For2013 |
−0.77 |
| CP3(0.0247) |
APR_P |
0.83 |
| APR_F |
0.83 |
| CP4(0.2597) |
ShA |
0.78 |
| TieAMap |
0.65 |
. Representation of the relationship between principal component 3 (PC3) and the “forestry plantations” response variable for the For2013 regression model.
. Representation of the main components (PCA1 and PCA2) of the model For2013, Renob2013 and Agro 2013.
The forestry plantations model is explained by the first 3 components. Component 1 is inversely related to the presence of secondary native forest (1997 and 2013) and directly related to the number of people supplied with drinking water by tanker trucks, the total Mapuche population, and Mapuche land (
). The second component presents a direct relationship with the “Mapuche land acquired by CONADI” variable and an inverse relationship with water rights granted to Mapuche. The interpretation of these relationships indicates a replacement of native vegetation with fast-growing introduced species, mainly pine and eucalyptus. These are forestry plantations of large companies and small areas of Mapuche community members (
).
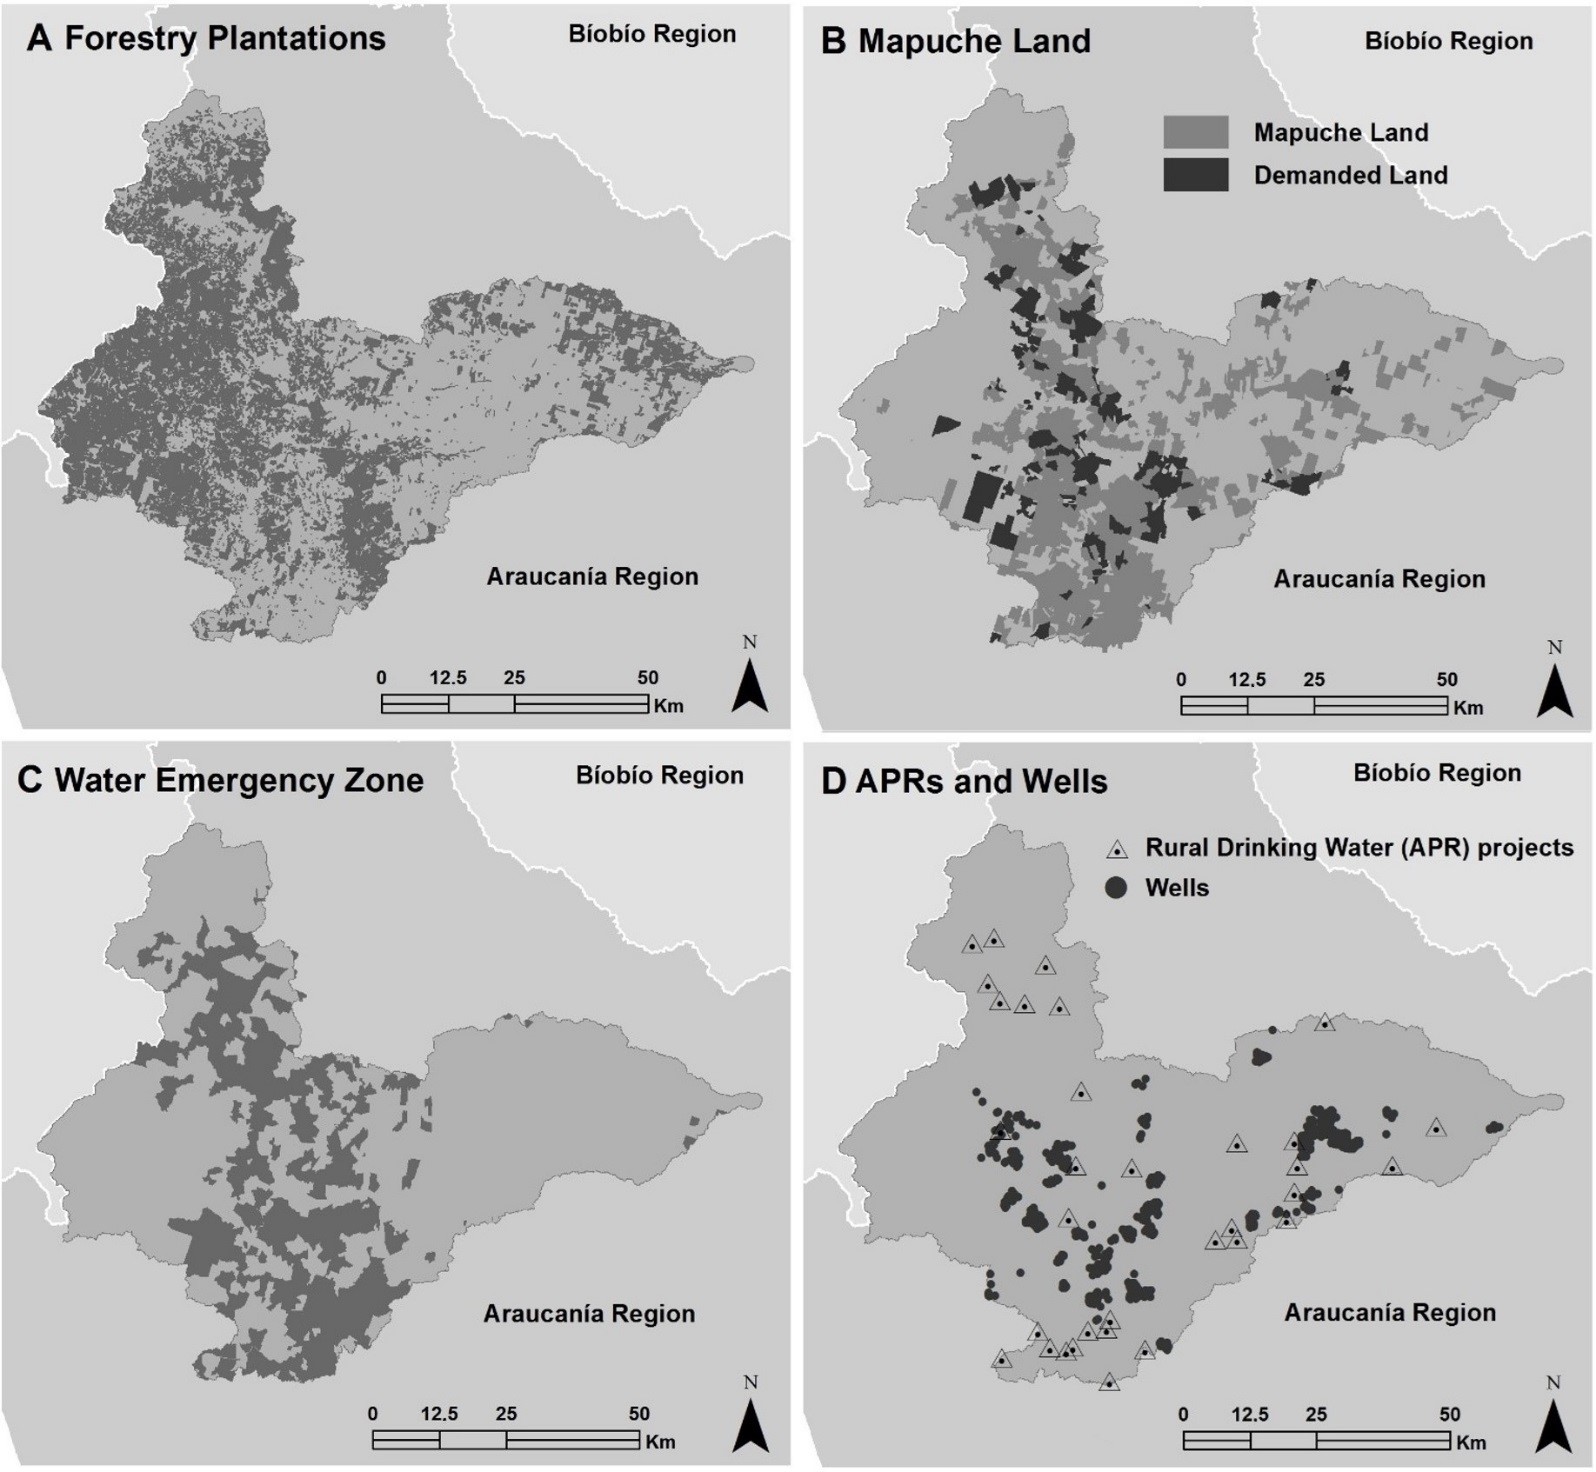
Other relationships indicate that the properties acquired by CONADI present significant forested areas in zones of the basin where few water rights have been granted to Mapuche, especially in the drier northern part, where there is less availability of arable land and a geographical configuration of low ridges and hills with steep slopes (
). According to a Traiguén municipal professional, the problem is also related to land purchases. In his judgment, CONADI “
buys land and just tosses it there”, referring to Mapuche communities that benefit from government subsidies, adding that: “
they should have bought some with water rights, for irrigation at least, they just sold them land” (E3-Tr, 2017).
. Forestry plantations and Mapuche land in area under a water emergency declaration, Chol-Chol River basin, La Araucanía Region.
Native vegetation dynamics were measured via the secondary native forests 2013 variable and are explained by all the components. They are related to land used for agriculture (1997 and 2013), land-use changes between agriculture and other uses, and water rights granted to the non-Mapuche population. Between 1997 and 2013, land with secondary native forests in the basin increased in area due to a succession of land-use changes related, in the first stage, to the cleaning of primary or secondary native forests to prepare land for farming or agriculture. Then this land enters a fallow stage, allowing the recovery of native shrub or tree cover.
The third component relates the presence of secondary native forests to the locations of Rural Drinking Water (APR) projects. In areas with greater secondary native forest cover, consumption of drinking water provided by APRs is greater compared to consumption from APRs located in zones with other land uses such as agriculture or forestry plantations. Corroborating this aspect, a municipal official of Traiguén, a commune located in the northern part of the basin, states,
“that part, that part where the Rehue River rises there and has a lot of native forest, that area doesn’t have water problems” (E3-Tr, 2017).
The Agro2013 model indicates relationships among the presence of secondary native forest, the population supplied with drinking water by tanker trucks, the total Mapuche population, and Mapuche land. Other important variables are arable land per capita, consumption of drinking water by the population supplied by APRs, and arable Mapuche land. The most significant relationship is the increase in farmland associated with the decrease in primary and secondary native forests in different parts of the basin. Meanwhile, the increase in farmland in the Chol-Chol and Nueva Imperial communes is associated with the “total population supplied by tanker trucks” variable; that is, there is more water delivery in homes located in agricultural areas, especially in agricultural areas where Mapuche communities predominate. This model also links lower native vegetation cover in the southeastern part of the basin to agricultural uses on arable land, which is of higher quality than that located in the north, and to lower drinking water consumption.
shows the original variables and the models with the greatest explanatory weight in the different sub-basins of the Chol-Chol watershed.
.
Original variables, model and sub-basin.
| Original Variable |
Model |
Sub-Basin |
TieMap
PobTMapu
Num_person
Renob_1997
Renob_2013
|
Agro2013 = 54.07 + 4.15CP1 + 5.05CP2 + 2.80CP3 − 1.45CP4 |
Sub 1
Sub 6
Sub12
|
TieMap%
Num_person
PobTMapu
Pob_Total
Renob_1997
Renob_2013
|
For2013 = 31.58 − 2.31CP1 − 4.47CP2 − 3.62CP3 − 1.02CP4 |
Sub 1
Sub 6
Sub12
|
Agro2013
Camagro
Agro1997
DeAnoMap
For2013
|
Renob_2013 = 9.03 − 1.96CP1 + 1.37CP2 + 0.38CP3 + 1.62CP4 |
Sub1
Sub 7
Sub12
|
In sub-basins with larger areas subjected to land-use change, a greater decrease in secondary native forest cover and, in some cases, elimination of primary native forest fragments or remnants located in ravines is observed. In the case of Mapuche farms, especially in the northern area, the native vegetation on the properties was replaced by forestry plantations, decreasing the amount of arable land used for crops. This dynamic has caused better-quality land in the communities to become increasingly scarce, a historical process that has been exacerbated by the lack of water in recent decades.
3.3. The Mapuche Lonko Perception
A lonko from a Galvarino community states that climate variations also explain the lack of water: “
nature in Chile has changed a lot, because that has also affected the communities a lot”. He remembers the climate events of the past and relates them to the geographic conditions of the area: “
it has changed a lot because before the experience I had between now and 20 years ago, man, it rained a for week, 15 days, and today the most it rains in a year, about 20 days, multiplying by 5 days for one month, 5 for another month, it could be less, it’s a failure, also, that has harmed practically in these highland areas, like this one” (E1-G, 2017).
A lonko from Traiguén explained another: “
gradually, in some places, especially where people planted pine and eucalyptus trees, around there the water problem began”. He adds: “
because many times, here they thought up, you see eucalyptus here, one hectare, two hectares, but it was CONAF that came with the big lie, saying, in 12 years you’re going to be, man, almost a millionaire” (E4-Tr, 2017).
For this interviewee, whose lonko led an important process of territorial recovery of more than 3000 hectares, a large part of which were planted with radiata pine: “
there are certain spaces that we will not be able to touch because they have another meaning for us, a meaning beyond that, a spiritual meaning, because I cannot exploit them there, because there are lawenes there, remedies that serve us for the Machi” (E4-Tr, 2017).
He acknowledges that plantations affect the availability of water and that: “
if there is no water, we will not have any, we will not be able to produce our traditional crops, for example, today you cannot grow a vegetable garden because, with that amount of water they give you, you cannot produce a vegetable garden”. In his opinion, “
the fight against forestry companies begins because spaces begin to shrink, families begin to grow and the land does not grow any further”.
In many communities, forestation was carried out with government support to generate medium-term earnings, without considering the effects these plantations could have on future water availability. This situation is acknowledged by a lonko of Galvarino, who states: “
there was an error here, a human, personal error, and also by the professionals we have, who were aware, it was known that in the future this would be detrimental to the communities” (E1-G, 2017), adding that: “
Now it is extremely dry and that has also affected, I think because of the system of Law 701 that I think the Chilean government, to be able to forest private and non-private land…that has made us lose the groundwater of the menoko [waterhole, spring, or swampy site with abundant vegetation; preferred Mapuche space for the collection of medicinal plants and ceremonies]” (E1-G, 2017).
The interviewee justifies the Mapuche territorial recovery processes by pointing out that: “
So, I want to go in there to recover to feed ourselves, the only mission we have is to work a little on the agricultural part, work on wheat and oats, pasture because we cannot do part of the vegetables because there is no water” (E1-G, 2017). He also recognizes the need for the State to build hydraulic works, such as rainwater accumulation dams and APRs.
For the lonkos, the breakup of the menokos is occurring in the watershed [
31] This is an event in which a micro-watershed and the native vegetation remnants that protect them are dried out as a result of the extraction of water by exotic plants, such as pine and eucalyptus trees.
Their territory is suffering a disease; it is
kutrhan (“sick” in Mapudungung, the Mapuche language
). Water and land scarcity, sustained migration, cultural resistance, increasing precariousness of life, forced adaptation, and uprooting are some of the symptoms.
3.4. The Forestry Companies Arguments
The forestry companies attribute the lack of water to climate change and the megadrought [
57,
58,
59]. On this topic, CORMA (Chilean Wood Corporation) has expressed that “
although plantations use water to grow and produce wood, they are not the cause of the reduction in river and stream levels. The main cause is the precipitation deficit due to climate change, as well as the increase in water demand for other uses” [
58]. Meanwhile, the drying up of wells for human consumption is due to the fact that “
higher average temperatures in the mountains produce less snow accumulation on the high peaks, affecting aquifer recharge in the spring and summer months” [
59]. Lower precipitation due to the long drought (cf. Center for Climate and Resilience Research, 2015) and greater water demand for agricultural uses are the main explanatory factors [
58].
Forestry corporations present their arguments and evidence that extenuate or disavow their responsibility for the water and territorial crisis. They use scientific information to justify their policies and actions in the court of public opinion [
57,
58,
59].
3.5. The Perspective of the Municipalities
According to a Chol-Chol official, the lack of water is associated with the advance of forestry plantations and the decrease in native vegetation: “
if you talk with an adult, the adult tells you, man, before when I went out to work, I went out with a jug and a little flour and went out to work in the countryside, you found water everywhere, you can’t do that now”. As a time reference for the forestation process the official states that “
we’re talking many years ago, more than 30, well the previous settlers arrived many years before, but the forestry company got here like 30, 40 years, yeah 40, about 40 years ago they got here, then they planted and near the trayenko [waterfall, water that emerges from the earth, or place where two or more streams meet, where prayer ceremonies are held; the vegetation includes herbaceous plants, shrubs and ferns],
which is what we call it” (E5-CH, 2017). The accounts report a decrease in native forest over the years; however, remnants remain in ravines and along stream and river banks, located on forestry company and Mapuche properties.
The advance of forestry plantations, including over land suitable for agriculture, has been an important factor, as he states: “
they surrounded us and the flat parts that had all been planted with wheat. Now all forestry” (E8-V, 2017). Providing more background, he mentions that, years ago, “
water was at 2 meters, but now they dug the latest wells for water for human consumption in a community, they reached 27 meters in deep wells”. He also says that geological characteristics can have an influence, as “
with the earthquake more droughts occurred, the groundwater escaped” (E8-V, 2017).
The overexploitation of APRs is another reason for the lack of water, due to new household connections for families that acquire land or are resettled in the area as a result of CONADI purchases. Water demand in some areas (
mainly in the north of the watershed) has exceeded the supply, and “
the well they have isn’t able to supply its own users, there will come a moment they won’t be enough for the current user because the share has been decreasing” (E9-P, 2017). In this case, he states, the drinking water committee that manages the APR has taken some measures: “
now they’re buying 5 liters per second, from an irrigation canal”.
According to an official from the municipality of Temuco, the greater demand for water and APR projects is due to the fact that “
I don’t know if it is so, so effective, but they’ve bought a lot of land in this area and CONADI has brought Mapuche communities from other areas”, adding an interesting perspective, already expressed by other interviewees: “
one look there, and the committees are always there, I mean, the communities always, it’s something that they always have unconsciously now, the forestry companies are the ones stealing the water”.
In this person’s opinion, it is not only a physical lack of water or technical problems associated with prospecting for it, but also that Mapuche people and communities do not have registered rights; that is, they do not have ownership of it and control of its use.
The geographic configuration has been a factor that has influenced public policy results in terms of drinking water provision in the Traiguén Commune, explaining: “
there are lots of families who don’t see its geographic use, I mean they build a house on a hill where they are never going to get water…we, because, because of the geography we have more trucks, because of the geographic aspect ONEMI (National Emergency Office) gave us more trucks”.
Some professionals interviewed hold forestry companies 100% responsible for the lack of water “
before 1100 fell here and now I think 800, 700 millimeters of water fall”. For this official, there are other social impacts more important that the lack of water, related to land sales to forestry companies: “
people came to town, bought pick-up trucks, they hauled freight, the truck broke down two years later, they begin to ask for welfare benefits, they live on a lot”. Furthermore, he adds that there are older people who have not been able to adapt to a new way of life: “
there are farmers who have committed suicide because they leave about 20 hectares that they lived on, to a 10-by-20-meter lot, the whole system changes on them” (E7-NI, 2017).
His knowledge and experience with Mapuche communities allow him to assert that “
I think that where there is a problem is when there is a community, let’s say, there are a thousand hectares of communities against ten thousand of plantations around them, they’re surrounded, that happens in Lumaco, in other areas, but here fortunately not”.
4. Discussion
Between 2007 and 2013, forestry plantations primarily replaced native vegetation rather than agricultural land. Sub-basins with extensive forested areas had fewer water rights and lower allocated flows, suggesting groundwater depletion due to forestry water demand and changing climate conditions [
10,
11]. Mapuche community and lonkos leaders attribute the water crisis to both climate variability and the expansion of forestry plantations, particularly pine and eucalyptus, which consume more water than native forests [
60,
61,
62].
Forestry monocultures are large consumers of water in the Chol-Chol watershed. Plantations established in old-growth native forests, grasslands, or scrublands consume more water than the native vegetation baseline, reducing water production, flows, and surface runoff [
60,
61,
62,
63,
64]. Meanwhile, species such as Monterrey pine and eucalyptus present greater evapotranspiration rates compared to areas in which native forests have been maintained [
33,
62,
65,
66,
67]. In contrast, the forestry industry attributes water scarcity to climate change and prolonged drought [
58,
59].
Recent research confirms that forestry expansion reduces streamflow, particularly in smaller basins (<50,000 hectares) [
68]. Additionally, overexploitation of groundwater has been identified as a critical anthropogenic threat on a global scale [
69]. This could be observed in the study area, especially in the southern zone, as it is related to more intensive agricultural land use. Local reports made for the municipalities indicate that rural drinking water infrastructure (APRs) is overwhelmed by growing demand, exacerbated by land acquisitions through CONADI, which relocate communities to water-scarce areas.
The study reveals that water consumption from tanker trucks is higher in areas with fewer registered water rights, highlighting an unequal distribution of water resources in the Chol-Chol watershed. Despite concentrated water rights in agricultural valleys, these areas still require external water supply, indicating inefficiencies in water allocation. Water scarcity in the Chol-Chol watershed is driven by a combination of climate variability, land use changes, forestry expansion, unequal water rights distribution, and the application of public policies that have negatively impacted rural communities. A good example has been CONADI’s land purchases.
More recent data indicate that the trends towards decreasing precipitation, streamflows and land use change continue in the Araucanía region and the Chol-Chol River basin. In the last 70 years, there have been decreases of up to 300 mm of precipitation compared to previous decades. In fact, in the period 1931–1960, 1308.4 mm were recorded; in the period 1961–1990: 1157.4 mm; and in the period 1991–2020: 1080.8 mm. From 2019 to 2023, rainfall averages 800 mm per year in the southern sector of the Chol-Chol watershed [
70,
71]).
These findings must be aligned with the necessity to incorporate long-range hydrological dependencies in regional planning and local policies [
69].
In recent years, the rate of forestation with exotic plantations has been reduced in the Chol-Chol river basin, basically for two reasons: the erosion of soils with forest aptitude (the business of planting is no longer “
profitable” in soils with low fertility and without government subsidies), in sectors with three or more plantation rotations, and the increase in forest fires in the watershed. Both factors, especially fires, have affected biodiversity in fragments or remnants of native forest or new growth that still exist in the basin. When native or introduced vegetation cover disappears, wind and rain accelerate erosive processes, increasing surface runoff and decreasing water infiltration, which is key to recharging underground aquifers [
70,
71,
72].
Between 2018 and 2020, 24,246 ha of forest plantations and 17,753 ha of native forest were burned in the Araucanía region. More severe events occurred between 2021 and 2023, with 83,092 and 66,799 hectares, respectively [
71]. Some of these fires occurred in the Chol-Chol River basin. It should be noted that the annual forestation rate in the Araucanía region has been decreasing, from 20,396 hectares in 2011 to 632 hectares in 2021 [
71,
73,
74,
75].
The origin of the problem is complex, and one of the main factors has been the application of various governmental policies and laws over time that have allowed ancient Mapuche territories to be totally or partially transferred and fragmented. The military occupation of the Araucanía, settling on reservations, the division of the
Títulos de Merced, the privatization of water resources through the Water Code and the enactment of Decree Law 701 on forestry development are factors that explain these processes [
21].
The answer to the initial research question: What are the main variables related to the lack of water in Mapuche territory?, confronts us with historical facts and trends that, especially in recent decades, have marked the lives of thousands of Mapuche people in the study area and the Araucanía Region. There is less land to work and a lack of water for domestic, productive, and sociocultural use. In this sense, Bengoa states that during the last 100 years, the Mapuche population that lives in agriculture has remained constant. The land (
water) limitations and various modernization processes have led the surplus population to migrate. In the countryside, the number that has remained is relatively stable [
12]. The current processes in the Chol-Chol River watershed confirm the assessment of this author: land and water do not allow the demographic productive and sociocultural dynamics of the Mapuche people to be sustained.
Mapuche speaks of resistance to the onslaughts of neoliberalism, and many of their actions are based on a popular environmentalist approach, traditional knowledge, and scientific arguments, particularly those related to the impacts that forestry plantations have on their land. This knowledge is also used by the government and interested groups, which extract arguments from it to back their actions and continuous development processes, particularly those related to the sustainability of the forestry sector [
76,
77].
5. Conclusions
A group of three models with the best goodness of fit (
statistically significant) was identified (For2013; Renob2013 and Agro2013). These models are related to replacing native forests with forest plantation (
monoculture) and overexploitation of groundwater for irrigation.
A series of relationships and models suggest that water scarcity depends on land-use changes, with the latter linked to agriculture and forestry monocultures. According to the analyzed data, field observations, and interviews, in sub-watersheds with larger areas that underwent land-use changes between 2007 and 2013, there was a greater decrease of young native forest cover. In these zones, it is common that when clearing land for forestation, native vegetation is eliminated, the first process in the land-use change sequence. Thus, the vegetation on a farm is replaced by forestry plantations, decreasing the amount of arable land for agriculture in sectors with a significant Mapuche population.
The lack of water in the Chol-Chol River basin, especially in the northern part, is chronic, and the water emergency conditions are ongoing. The consumption levels of the population are beneath WHO standards. Emergency decrees have been declared in areas with chronic water shortages, like the Chol-Chol watershed, with measures such as drinking water distribution by tanker trucks, for over fifteen years. At the same time, water rights continue to be established and concentrated among mid-sized agricultural properties and forestry companies, increasingly limiting access by Mapuche people and communities, all under the Chilean Constitution of 1980 and the Water Code of 1981 [
56].
Faced with critical, changing, and uncertain scenarios, the inhabitants of the Cho-Chol River basin have readjusted their strategies, modifying practices and their ways of life, including secure access to water in their demands [
78] and migration towards the sector of the basin that have water sources, such as the APRs. Empirical knowledge of the basin, formalized through statistical and ethnographic analysis, suggests that the forcings are climatic and related to public policies and water, land, and forest overexploitation [
79].
The accounts and testimonies are an important primary source of information that complements the numerical results and orientation for future hypotheses and work scales. The perceptions arise from the realities and experiences of the different actors, revealing elements of identity that give them shape and content, especially for the Mapuche, with forest, life, water, menoko, and trayenko being some of the categories mentioned. The perceptions of the different ngenko, the spiritual guardians or owners of water, are part of the accounts of the interviewed lonkos, as has been reported in other research [
80].
The results of this study contribute to the current debate on territorial and socioecological processes that, at different scales and in diverse economic and cultural contexts, shape the lives and survival strategies of millions of people and communities. From this perspective, a challenge is the formulation of more specific research hypotheses, as well as the selection of variables that include the territorial diversity of the studied problems, considering in their formulation scientific methods and local knowledge acquired through the customs and daily practices of people and communities.
An important innovation of this work has been the realization and discussion of the interviewees’ perceptions, showing different perspectives on a common problem; water scarcity. Statistical analysis helps formalize perceptions based on real-life situations experienced by the interviewees, which originate in cultural aspects that identify them (Mapuche lonkos), technical aspects (local planners), and economic aspects (forestry companies).
The perceptions of the interviewees are clearly different. We believe the opinions of the interviewees differ because they reflect diverse life experiences based on different worldviews. The solution to the problem is not only technical but primarily cultural. Planning and management of “
water scarcity” in the Chol-Chol River basin must integrate these perspectives and consider that water is not just a consumer economic good or a raw material; it is a human right and a basic element in the worldview of an indigenous people. A group of 21 Mapuche communities has recently been formed in the basin to develop a water management plan with local, technical, and scientific support. This document will be presented to local and regional authorities.
Author Contributions
Conceptualization, G.D.A. and R.T.; Methodology, R.G. and N.F.V.; Software, N.F.V.; Validation, G.D.A. and R.G.; Formal analysis, G.D.A.; Investigation, G.D.A.; Resources, G.D.A.; Data curation, R.G. and N.F.V.; Writing—original draft preparation, G.D.A.; Writing—review & editing, G.D.A., N.F.V.; Visualization, R.G. and N.F.V.; Supervision, G.D.A.; Project administration, G.D.A.; Funding acquisition, G.D.A.
Ethics Statement
Not applicable for studies that do not involve humans or animals.
Informed Consent Statement
Informed consent was obtained from all participants in the study.
Data Availability Statement
https://udeconce-my.sharepoint.com/:t:/g/personal/navalderrama_udec_cl/EZfl-B5gItpKvPTURfwSBcYBkzUcX9JU775Hh9svg-WIMA?e=nX3hBb.
Funding
This research has been partially funded by the University of Concepción project number 1995 (Research Direction, University of Concepción) called “Interculturalidad y valoración de saberes locales para responder a desafíos territoriales complejos: Gestión del agua en Sitios de Significación Cultural (SSC) Mapuche, valle de Elicura, Provincia de Arauco”.
Declaration of Competing Interest
The authors declare that they have no known financial conflicts of interest or personal relationships that could have influenced the work presented in this article.
References
1.
Gosling SN, Arnell NW. A global assessment of the impact of climate change on water scarcity.
Clim. Chang. 2016,
134, 371–385.
[Google Scholar]
2.
Budds J. La demanda, evaluación y asignación del agua en el contexto de escasez: Un análisis del ciclo hidrosocial del valle del río La Ligua, Chile.
Revista de Geografía Norte Grande 2012,
52, 167–184.
[Google Scholar]
3.
Larraín S. Human rights and market rules in Chile’s water conflicts: A call for structural changes in water policy.
Environ. Justice 2012,
5, 82–88.
[Google Scholar]
4.
Romero H, Méndez M, Smith P. Mining development and environmental injustice in the Atacama Desert of Northern Chile.
Environ. Justice 2012,
5, 70–77.
[Google Scholar]
5.
Torres R, Azócar G, Gallardo R, Mendoza J. Water extractivism and decolonial struggles in Mapuche territory, Chile.
Water Altern. 2022,
15, 150–174.
[Google Scholar]
6.
Aguayo M, Stehr A, Link O. Respuesta hidrológica de una cuenca de meso escala frente a futuros escenarios de expansión forestal.
Revista de Geografía Norte Grande 2016,
65, 197–214.
[Google Scholar]
7.
UNDP. Human Development Report 2006 beyond Scarcity: Power, Poverty and the Global Water Crisis; United Nations Development Programme. 1 UN Plaza: New York, NY, USA, 2006; p. 41.
8.
Greenhalgh S, Samarasinghe O. Sustainably managing freshwater resources.
Ecol. Soc. 2018,
23, 44.
[Google Scholar]
9.
Hurst HE. Long-term storage capacity of reservoirs.
Trans. Am. Soc. Civ. Eng. 1951,
116, 770–799.
[Google Scholar]
10.
Dimitriadis P, Koutsoyiannis D, Iliopoulou T, Papanicolaou P. A global-scale investigation of stochastic similarities in the marginal distribution and dependence structure of key hydrological cycle processes.
Hydrology 2021,
8, 59. doi:10.3390/hydrology8020059.
[Google Scholar]
11.
Pizarro A, Acuña P, Dimitriadis P, Iliopoulou T, Koutsoyiannis D. Past, present, and future of Hurst-Kolmogorov dynamics in stochastics: A bibliometric analysis of the last 50 years in water resources.
J. Hydrol. 2024,
643, 132008. doi:10.1016/j.jhydrol.2024.132008.
[Google Scholar]
12.
Bengoa J. Mapuche, colonos y el Estado Nacional; Editorial Catalonia: Santiago, Chile, 2014; pp. 98–114.
13.
Ñanculef J. Tayiñ mapuche kimün: Epistomología Mapuche-Sabiduría y conocimientos; Universidad de Chile: Santiago, Chile, 2016; pp. 41–83.
14.
Viveiros De Castro E. Perspectival Anthropology and the Method of Controlled Equivocation.
J. Soc. Anthropol. Lowl. S. Am. 2004,
2, 1–30.
[Google Scholar]
15.
Cajigas-Rotundo J. Ontoepistemologías Indígenas.
Tabula Rasa 2017,
26, 125–139.
[Google Scholar]
16.
Aigo JD, Skewes JC, Bañales-Seguel C, Riquelme Maulén W, Molares S, Morales D, et al. Waterscapes in Wallmapu: Lessons from Mapuche perspectives.
Geogr. Rev. 2020,
112, 622–640. doi:10.1080/00167428.2020.1800410.
[Google Scholar]
17.
Burkhart BY. Be as Strong as the Land that Made You: An Indigenous Philosophy of Well-Being through the Land.
Sci. Relig. Cult. 2019,
6, 26–33.
[Google Scholar]
18.
Toledo VM, Barrera-Bassols N. La Memoria Biocultural. La Importancia Ecológica de Las Sabidurías Tradicionales; Icaria: Barcelona, Spain, 2008.
19.
Ibarra Eliessetch MI, Riquelme Maulén W. Sentipensar mapuche con las aguas del Huenehue: Hacia una ecología política y una antropología por demanda.
Polis Rev. Latinoam. 2019,
18, 56–74.
[Google Scholar]
20.
Tsing A. Friction. In An Ethnography of Global Connection; Princeton University Press: Princeton, NJ, USA, 2005.
21.
Azócar García GA, Torres R, Gallardo R, Félez J. Pueblo Mapuche y Crisis Hídrica: Cuenca Hidrográfica del río Chol-Chol, Región de la Araucanía, Chile. In América Latina en las últimas Décadas, Procesos y Retos; Ediciones de la Universidad de Castilla-La Mancha: Cuenca, España, 2018; pp. 945–964.
22.
Zunino HM, Matossian B, Hidalgo R. Poblamiento y Desarrollo de Enclaves Turísticos en la Norpatagonia Chileno-Argentina: Migración y Frontera en un Espacio Binacional.
Revista de Geografía Norte Grande 2012,
53, 137–158.
[Google Scholar]
23.
Núñez A, Aliste E, Bello Á. El discurso del desarrollo en Patagonia-Aysén: La conservación y la protección de la naturaleza como dispositivos de una renovada colonización. Scripta Nova. Revista Electrónica de Geografía y Ciencias Sociales. 2014. Volume 18. Available online: https://raco.cat/index.php/ScriptaNova/article/view/290035. (accessed on 15 October 2022).
24.
Bengoa J. Los Mapuche: historia, cultura y conflicto.
Cahiers des Amériques Latines 2012,
68, 89–107.
[Google Scholar]
25.
Sepulveda O, Vela F. Cultura y Hábito Residencial: El Caso Mapuche.
Rev. INVI 2015,
83, 149–180.
[Google Scholar]
26.
Rodríguez A. El 26% de las comunidades mapuche mantiene relaciones de colaboración o prestación de servicios con empresas forestales; CIPER Chile: Santiago, Chile. 2021. Available online: https://www.ciperchile.cl/2021/08/06/el-26-de-las-comunidades-mapuche-mantiene-relaciones-de-colaboracion-o-prestacion-de-servicios-con-empresas-forestales/ (accessed on 12 December 2023).
27.
Altieri MA. The Sociocultural and Food Security Impacts of Genetic Pollution via Transgenic Crops of Traditional Varieties in Latin American Centers of Peasant Agriculture.
Bull. Sci. Technol. Soc. 2003,
23, 350–359. doi:10.1177/0270467603259774.
[Google Scholar]
28.
Marvier MA. Improving risk assessment safety of transgenic crops.
Ecol. Appl. 2002,
12, 1119–1124.
[Google Scholar]
29.
Pérez I. Ecosistemas Mapuche: Diálogo Intercultural para la Restauración Ambiental en la Región de La Araucanía. Master´s Thesis, Mention Education, Faculty of Education, Universidad de La Frontera, Temuco, Chile, 2004.
30.
Mackinnon P, McFall S. Pueblo Mapuche, Expansión Forestal y Poder Local. Programa Mapu-Territorialidad. In Municipio y Participación (o exclusión) Mapuche; Documento inédito Centro de Documentación del Instituto de Estudios Indígenas, Universidad de La Frontera: Temuco, Chile, 2000.
31.
Neira Ceballos Z, M Alarcón A, Jelves I, Ovalle P, Conejeros AM, Verdugo V. Espacios ecológico-culturales en un territorio Mapuche de la Región de La Araucanía en Chile.
Chungará 2012,
44, 313–323.
[Google Scholar]
32.
Bengoa J. Historia de un conflicto: El Estado y los Mapuches en el siglo XX; Planeta/Ariel: Santiago, Chile, 1999; pp. 64–77.
33.
Huber A, Iroumé A, Mohr C, Frêne C. Efecto de las plantaciones de Pinus radiata y Eucalyptus globulus sobre el recurso agua en la Cordillera de la Costa de la región del BíoBío, Chile.
Bosque 2010,
31, 219–230.
[Google Scholar]
34.
Klubock T. La Frontera. In Forest and Ecological Conflict in Chile’s Frontier Territory; Duke University Press: Durham, NC, USA, 2014.
35.
Yáñez N, Molina R. Las aguas indígenas en Chile; Lom. Ediciones: Santiago, Chile, 2011; 275p. ISBN 978-956-00-0265-5.
36.
Dirección General de Aeronáutica Civil—Chile (DGAC). Anuarios Climatológicos; Dirección Meteorológica de Chile, Sub-departamento de Climatología y Meteorología Aplicada: Santiago, Chile, 2018.
37.
Dirección General de Aeronáutica Civil—Chile (DGAC). Anuarios Climatológicos; Dirección Meteorológica de Chile, Sub-departamento de Climatología y Meteorología Aplicada: Santiago, Chile, 2019.
38.
Biblioteca Del Congreso Nacional—Chile (BCN). Clima y Vegetación de la Región de la Araucanía, Información Territorial. Valparaíso-Chile. 2020. Available online: https://www.bcn.cl/ (accessed on 10 December 2021).
39.
Dirección General De Aeronáutica Civil—Chile (DGAC). Anuarios Climatológicos; Dirección Meteorológica de Chile, Sub-departamento de Climatología y Meteorología Aplicada: Santiago, Chile, 2020.
40.
Torres R, Azócar G, Rojas J, Montecinos A, Paredes P. Vulnerability and resistance to neoliberal environmental changes: An assessment of agriculture and forestry in the Biobio region of Chile.
Geoforum 2015,
60, 107–122.
[Google Scholar]
41.
Dirección General De Aguas De Chile (DGA). Derechos de Aprovechamiento de Aguas Registradas en DGA; Dirección General de Aguas: Santiago, Chile, 2021. Available online: https://dga.mopp.gob.cl/productosyservicios/derechos_historicos/Paginas/default.aspx (accessed on 10 December 2024).
42.
Dirección General De Aguas De Chile (DGA). Inscripciones de Derechos de Aprovechamiento de Aguas en Conservadores de Bienes Raíces; Dirección General de Aguas: Santiago, Chile, 2021. Available online: https://snia.mopp.gob.cl/ciudadaniacbr/ (accessed on 11 November 2024).
43.
Corporación Nacional Desarrollo Indígena (CONADI). Varias coberturas, obtenidas desde repositorio Sistema de Información Territorial Indígena. 2016. Available online: http://siic.conadi.cl/ (accessed on 11 November 2024).
44.
Centro de Ciencias Ambientales EULA-Chile. Catastro de Tierras, Aguas y Riego, Etapa I; Secretaría General de La Presidencia, SEGPRES, CONADI: Santiago, Chile, 2010.
45.
CONAF. Monitoreo de Cambios, Corrección Cartográfica y Actualización del Catastro de los Recursos Vegetacionales Nativos de la Región de La Araucanía. Periodo 2007–2013; CONAF: Santiago, Chile. 2014.
46.
CIREN. Actualización y homogeneización de estudios de suelos de la IX Región. Fichas descriptivas de series, asociaciones y suelos de tipos de series, asociaciones y suelos misceláneos. 2011. Available online: https://bibliotecadigital.ciren.cl/server/api/core/bitstreams/799ab8e8-b0c7-4900-a3d9-643492bcbd92/content (accessed on 11 November 2023).
47.
Jolliffe IT. Principal Component Analysis, 2nd ed.; Springer: New York, NY, USA, 2002. doi:10.1007/b98835.
48.
Jolliffe IT, Cadima J. Principal component analysis: A review and recent developments.
Philos. Trans. R. Soc. A Math. Phys. Eng. Sci. 2022,
380, 20210227. doi:10.1098/rsta.2021.0227.
[Google Scholar]
49.
Ogwang T. The Gini Index for a Quadratic Pen’s Parade; Working Papers 1006; Brock University, Department of Economics: St. Catharines, ON, Canada, 2010.
50.
R Core Team. R: A Language and Environment for Statistical Computing; R Foundation for Statistical Computing: Vienna, Austria. 2023. Available online: https://www.R-project.org/ (accessed on 12 April 2023)
51.
Mayer H. Interview und schriftliche Befragung. Grundlagen und Methoden empirischer Sozialforschung, 6th ed.; Oldenbourg Verlag: München, Germany, 2012.
52.
Hohnke J. Multinationals and Security Governance in the Community: Participation, Discipline and Indirect Rule.
J. Interv. Statebuilding 2012,
6, 57–73.
[Google Scholar]
53.
Bogner A, Littig B, Menz W. Interviews mit Experten. Eine praxisorientierte Einführung; Springer: Wiesbaden, Germany, 2014; pp. 17–22.
54.
Kuckartz U. Qualitative Inhaltsanalyse. In Methoden, Praxis, Computerunterstützung, 3rd ed.; Beltz Juventa: Weinheim, Germany; Basel, Switzerland, 2016.
55.
Schreier M. Qualitative Content Analysis. In The SAGE Handbook of Qualitative Data Analysis; SAGE Publications Ltd. 1 Oliver’s Yard 55 City Road: London, UK, 2014; pp. 170–183.
56.
Bauer C. Water Conflicts and Entrenched Governance Problems in Chile’s Market Model.
Water Altern. 2015,
8, 147–172.
[Google Scholar]
57.
ARAUCO. Forestal Arauco y su Manejo Forestal, El Proceso, sus Impactos y Medidas de Mitigación. Boletín Informativo. 2012. Available online: https://arauco.com/wp-content/uploads/2024/05/Triptico-Manejo-forestal.pdf (accessed on 11 November 2023)
58.
CORMA. Preguntas y Respuestas: Experiencias sobre Agua y Plantaciones Forestales. Concepción. 2014. Available online: http://www.corma.cl/_file/material/preguntas-y-respuestas-experiencias-sobre-agua-y-plantaciones-forestales.pdf (accessed on 11 November 2023).
59.
CORMA. El agua y las Plantaciones Forestales; Concepción, Chile. 2015. Available online: https://www.corma.cl/wp-content/uploads/2020/01/El-agua-y-las-plantaciones-forestales.pdf (accessed on 11 November 2023).
60.
Scott D. Forestry and Water Resources: Correct Figures.
S. Afr. For. J. 1998,
181, 51–52.
[Google Scholar]
61.
Albaugh JM, Dye PJ, King JS. Eucalyptus and water use in South Africa.
Int. J. For. Res. 2013,
2013, 852540. doi:10.1155/2013/852540.
[Google Scholar]
62.
CONAF. Antecedentes de la Relación Masa Forestal y Disponibilidad Hídrica en Chile Central; Corporación Nacional Forestal, Ministerio de Agricultura, Gobierno de Chile: Santiago, Chile, 2017.
63.
Smakthin V. Low flow hydrology: A review.
J. Hydrol. 2001,
240, 147–186. doi:10.1016/S0022-1694(00)00340-1.
[Google Scholar]
64.
Shi Z, Xu D, Yang X, Jia Z, Guo H, Zhang N. Ecohydrological impacts of eucalypt plantations: A review.
J. Food Agric. Environ. 2012,
10, 1419–1426.
[Google Scholar]
65.
Granados D, López G. Fitogeografía y Ecología del Género Eucalyptus.
Chapingo 2007,
13, 143–156.
[Google Scholar]
66.
Gayoso J, Iroumé A. Impacto del manejo de plantaciones sobre el ambiente físico.
Bosque 1995,
16, 3–12.
[Google Scholar]
67.
Echeverría C, Huber A, Taberlet F. Estudio comparativo de los componentes del balance hídrico en un bosque nativo y una pradera en el sur de Chile.
Bosque 2007,
28, 271–280.
[Google Scholar]
68.
Alvarez-Garreton C, Lara A, Boisier JP, Galleguillos M. The Impacts of Native Forest and Forest Plantations on Water Supply in Chile.
Forests 2019,
10, 473.
[Google Scholar]
69.
Koutsoyiannis D. Revisiting the global hydrological cycle: is it intensifying?
Hydrol. Earth Syst. Sci. 2020,
24, 3899–3932. doi:10.5194/hess-24-3899-2020.
[Google Scholar]
70.
Instituto Nacional De Estadísticas (INE). Anuario Medioambiental, Región de la Araucanía; Gobierno de Chile: Santiago, Chile, 2024.
71.
Instituto Forestal (INFOR). Anuario Forestal, Boletín Estadístico 199; Gobierno de Chile: Santiago, Chile, 2024
72.
Instituto Nacional De Estadísticas (INE). Anuario Medioambiental, Región de la Araucanía; Gobierno de Chile: Santiago, Chile, 2023.
73.
Mundo Forestal. Revista de Medio Ambiente, Bosque y Madera; Colegio de Ingeniero Forestales de Chile: Santiago, Chile, 2023.
74.
Instituto Forestal (INFOR). Anuario Forestal, Boletín Estadístico 187; Gobierno de Chile: Santiago, Chile, 2022.
75.
Instituto Forestal (INFOR). Anuario Forestal, Boletín Estadístico 192; Gobierno de Chile: Santiago, Chile, 2023.
76.
Forsyth T. Ecología Política críTica: Ecología políTica críTica: La políTica de la Ciencia Ambiental, 2(2ª ed.); Routledge: London, UK, 2019.
77.
Jasanoff S. allá de la epistemología: Más allá de la epistemología: relativismo y compromiso con la política de la ciencia.Estudios Sociales de la Ciencia.
Estudios Sociales de la Ciencia 1996,
26, 393–418. doi:10.1177/030631296026002011.
[Google Scholar]
78.
Gómez-Baggethun E, Corbera E, Reyes-García V. Traditional Ecological Knowledge and Global Environmental Change: Research Findings and Policy Implications.
Ecol. Soc. 2013,
18, 72. doi:10.5751/ES-06288-180472.
[Google Scholar]
79.
Fernández-Llamazares Á, Díaz-Reviriego I, Luz AC, Cabeza M, Pyhälä A, Reyes-García V. Rapid Ecosystem Change Challenges the Adaptive Capacity of Local Environmental Knowledge.
Glob. Environ. Chang. 2015,
31, 272–284.
[Google Scholar]
80.
Aigo J, Ladio A. Traditional Mapuche ecological knowledge in Patagonia, Argentina: Fishes and other living beings inhabiting continental waters, as a reflection of processes of change.
J. Ethnobiol. Ethnomed. 2016,
12, 56. doi:10.1186/s13002-016-0130-y.
[Google Scholar]