1. Introduction
Grassland resources not only constitute a significant terrestrial ecosystem but also are a vital natural asset in China, forming the foundation for all production in grassland-rich pastoral areas. Animal husbandry, as herdsmen’s primary income source, critically impacts lives and livelihoods in these areas [
1,
2]. China’s natural grasslands span approximately 400 million hectares; the grassland areas of Xizang, Inner Mongolia, Xinjiang, Qinghai, Gansu, and Sichuan comprise three-quarters of this total [
3]. Despite this relative abundance, grasslands have long faced natural threats like climate change and anthropogenic disturbances such as overgrazing, leading to varying levels of degradation and desertification. These shifts, in turn, have caused a steady decline in the nation’s grassland ecological environment [
4]. The weakening of grassland functions poses serious challenges to China’s ecological security, the sustainability of animal husbandry, and the continued development of farmers’ and herdsmen’s livelihoods [
5].
Globally, the protection of grassland resources and their sustainable use have become important issues. Many countries and regions face similar problems, such as extreme weather events caused by climate change, ecological degradation due to overgrazing, and the loss of biodiversity. These challenges not only threaten local ecosystems but also affect human societies that rely on grasslands for survival. For instance, prolonged overgrazing and climate change in Mongolia has led to a rapid reduction in grassland area, severely impacting nomadic herders lifestyle [
6]. In the Sahel region of Africa, grassland degradation has exacerbated food crises and poverty, forcing large numbers of people to migrate to cities in search of employment opportunities [
7].
To address the grassland degradation problem, China introduced the Grassland Ecological Protection Subsidy and Incentive Policy in core pastoral areas in 2011. This policy, implemented in three stages (2011–2014, 2016–2020, and 2021–2025), covers 13 provinces as well as the Xinjiang Production and Construction Corps (Urumqi, Xinjiang) and Beidahuang Agricultural Reclamation Group Co., Ltd (Harbin, Heilongjiang). The policy is acknowledged as having paramount importance considering the critical role grasslands play in maintaining national border stability, promoting ethnic unity across the Chinese nation, ensuring income for farmers and herdsmen, and gaining common prosperity in pastoral areas [
8].
The primary goal of the grassland ecological compensation policy is to protect the ecological environment, not directly to support herdsmen’s incomes [
9]. However, while the policy focuses on ecological protection, it indeed affects the livelihoods of herdsmen, given the inherent conflict between the conservation of grassland resources and their economic needs [
9]. Some studies have found that such policies contribute to steady growth in herdsmen’s incomes, particularly in terms of income changes before and after implementation [
10,
11]. This effect may be especially pronounced in low-income pastoral households [
12]. Other studies, according to the incentive compatibility theory, have suggested that grassland ecological reward policies have not effectively aligned with income growth for herdsmen [
13]; the subsidies or bonuses provided are insufficient to offset the costs incurred by increased conservation activities and fail to meet herders’ actual needs [
14]. Further, slow income growth may be attributed to low levels of government subsidies [
15]. A comprehensive and systematic understanding of the factors influencing herdsmen’s incomes under these compensation policies may provide valuable insights for improving grassland ecological compensation measures.
Based on the existing literature, most empirical studies on the factors influencing herdsmen’s incomes have been limited to specific, localized regions, which has restricted the applicability of research findings to broader pastoral areas across China. To address this, the present study uses meta-analysis to explore the factors affecting herdsmen’s incomes within the context of current grassland ecological compensation policies. The findings may provide a valuable reference for improving and better implementing these policies.
Meta-analysis is a quantitative method that integrates observations from numerous independent studies to gain a more comprehensive understanding of their results [
16]. Through this approach, the present study seeks to answer the question: What factors significantly affect herdsmen’s incomes when accounting for heterogeneity? Additionally, what are the moderating effects of various research-level variables on these influencing factors and their relationship to herdsmen’s incomes?
2. Materials and Methods
2.1. Data Collection
The data used in this study were sourced from publicly available research papers. The Chinese databases utilized include CNKI, Wanfang, and VIP, while English databases include the Web of Science, Springer Link, and Science Direct. The search terms included “grassland ecological protection subsidy incentive mechanism”, “grassland ecological compensation policy”, “grassland ecological compensation”, “income”, “livelihood”, “livelihood capital”, “influence”, “effect”, “affect”, “influence factor”, “China”, “Chinese” and combinations thereof; the search cutoff date was 15 May 2024. The inclusion criteria were: (1) Source language of Chinese or English; (2) a research area within China and clearly demarcated; (3) subjects being herdsmen and including a quantitative analysis of the relationship between different influencing factors and their incomes; (4) statistical analysis results providing sufficient information to directly calculate or transform effect values (e.g.,
t-values,
r-values, regression coefficients, and their standard errors) with specified sample size; (5) studies with more comprehensive information selected from multiple papers based on the same sample group by the same or different authors. This screening process is illustrated in
Figure S1.
The 27 articles included in the meta-analysis were coded, and details such as the first author’s name, literature type, publication year, publication source, research area, statistical methods, sample size, research timeframe, and statistical indicators of each influencing factor were extracted (
Table S1). The research areas include Xinjiang, Gansu, Qinghai, Ningxia, and Inner Mongolia, with a total effective sample size of 5838.
2.2. Variable Selection
As per the 27 studies included in this review, and following the empirical rule that the number of effect values should not be fewer than 5, a total of 18 variables were classified into four categories: Individual characteristics of herdsmen, household characteristics of herdsmen, economic characteristics of herdsmen, and ecological/geographic characteristics. Descriptions of these variables are given in
.
Data were first compiled using Excel 2016, and statistical analysis and plotting were performed in R (v.4.3.3). Significance was tested at the 0.05 level.
.
Descriptions of influencing variables.
| Dimension |
Variable |
Variable Definition |
| Individual characteristics of herdsmen |
Gender |
Male or female: Categorical variable |
| Age |
Age of herdsmen: Continuous or categorical variable |
| Ethnicity |
Ethnic groups of herdsmen: Categorical variables |
| Educational level |
Cultural level of herdsmen: Continuous or categorical variable |
| Characteristics of pastoral households |
Number of household members |
Actual number of people in one pastoral household: Continuous or categorical variable |
| Labor force quantity |
Actual number of people engaged in labor: Continuous or categorical variable |
| Housing status |
Housing structure or number of rooms: Continuous or categorical variable |
| Cooperative |
Participation or non-participation in a cooperative: Categorical variable |
| Characteristics of pastoral economy |
Subsidy amount |
Amount of grassland ecological compensation received by herdsmen: Continuous or categorical variable |
| Number of livestock |
Number of livestock in pastoral household: Continuous or categorical variable |
| Living expenses |
Household living expenses: Continuous variable |
| Production expenses |
Productive expenditure of herdsmen: Continuous or categorical variable |
| Fixed assets |
Productive and livelihood assets owned by pastoral households: Continuous or categorical variables |
| Loan situation |
Household loan situation of herdsmen: Continuous or categorical variable |
| Ecological geographic features |
Grassland area |
Grassland area contracted by pastoral households: Continuous variable |
| Per capita grassland area |
Grassland area contracted by pastoral households/total household population: Continuous variable |
| Grassland quality |
Grassland degradation: Categorical variable |
| Location |
Distance from county town, township, bus stop, market, or main road: Continuous variable |
2.3. Data Analysis
The first step in analyzing the data is to convert the collected test value data into
r-values with the same dimension, making it easier for all data to be analyzed uniformly. Next, each
r-value is converted into Fisher’s Z. Then, the comprehensive effect size is calculated based on Fisher’s Z. The comprehensive effect size is the core content of this study. It can express the importance of the indicators in this study. Then, a heterogeneity test is conducted to examine whether there is heterogeneity in the comprehensive effect size calculation results. If heterogeneity exists, possible influencing factors will be introduced for meta-regression analysis to analyze the results further. Finally, a test for publication bias is performed to examine whether the calculated data has been affected by publication bias.
2.3.1. Extraction and Conversion of Effect Values
There are inherent differences between research in economics versus the natural sciences. In natural science research, studies typically include experimental and control groups, whereas economics studies tend to focus on the relationship between pairs of variables [
17]. Fisher’s Z was chosen as the effect size measure for the present study [
18], with conversions made based on the extracted raw data. First,
t-values were converted to
r-values as follows:
where
t represents the value obtained from
t-test on the data in the original literature included in the analysis,
df is the degree of freedom,
N is the number of samples.
The effect value Fisher’s Z (
yi) and the variance of the effect value (
vi) were determined based on the
r-values:
Next, the comprehensive effect value ($$\overset{-}{y}$$) of fixed effects and the weight (
wi) of individual studies were determined as follows:
The comprehensive effect value ($$\overset{-}{y}$$) of random effects and the weight (
wi) of individual studies were calculated as follows:
where $$\tau^{2}$$ represents the inter-study variance. A fixed-effects model is denoted by $$\tau^{2} $$ = 0 (
Equation (4) and
Equation (5)) and a random-effects model as $$\tau^{2} $$ ≠ 0.
2.3.2. Model Selection and Heterogeneity Testing
When consolidating data during meta-analysis, heterogeneity tests must be performed on each effect value. In this study,
Qt and
I2 were selected for heterogeneity testing [
19]. If the effect value data is homogeneous,
Qt should follow a chi-square distribution with
k − 1 degrees of freedom, and no explanatory variables need to be introduced. If
Qt does not follow a chi-square distribution with k − 1 degrees of freedom, an explanatory variable must be introduced. That is, a larger
Qt and
p < 0.05 indicate greater overall heterogeneity among effect values, and the analysis needs an explanatory variable [
20].
I2 > 50% indicates significant heterogeneity, while
I2 > 75% suggests high heterogeneity [
21]. If the
Qt results are significant or
I2 suggests significant heterogeneity, a random-effects model is appropriate; otherwise, a fixed-effects model should be used.
2.3.3. Publication Bias Testing and Correction
An inverted funnel plot can be employed to assess the publication bias among collected data. A more asymmetrical funnel shape indicates greater publication bias and less-reliable conclusions [
22]. A quantitative test for funnel symmetry was conducted here using Egger’s regression test. If
p > 0.05, then the funnel shape is symmetrical, and the results are not significantly affected by publication bias. If bias occurs, the trim-and-fill method can be applied to correct it [
22].
2.3.4. Sensitivity Analysis
When merging effect values, significant differences between individual research results and others may arise, leading to bias in the overall model estimation. The “leave one out” method [
23] was employed to address this, removing each effect value from the analysis one at a time before merging the remaining effect values to test for outliers and determine the stability of the overall results.
2.3.5. Meta-Regression Analysis
Heterogeneity across different studies may arise due to variations in research areas, variable types (e.g., continuous or categorical), data points (most recent research time), statistical methods, publication years, and literature types (journal papers, Master’s theses). Moderating variables were introduced into the regression to account for this. The overall heterogeneity
Qt can be decomposed as follows:
where
Qm is the heterogeneity caused by a known factor (
i.e., explanatory variable);
Qe denotes unexplained residual heterogeneity (unknown factors). The multivariate meta-analysis model was used to determine the impact of explanatory variables on the effect value, where
Qm can be calculated as follows:
In this formula,
p represents each influencing factor;
k is the number of data sets for a single influencing factor;
yji is the effect value of the
i-th set of data for the
j-th variable;
vji is the variance of the effect value of the
i-th set of data for the
j-th variable;
wji is the weight of the
i-th set of data for the
j-th variable; $$\tau^{2}$$ denotes the variance between data sets.
The significant moderating variables verified above were grouped, and a subgroup analysis was performed to identify more detailed heterogeneous information.
3. Results
3.1. Publication Bias Test Evaluation and Main Effect Test
3.1.1. Heterogeneity Test
As shown in
, variables with $$\tau^{2} $$= 0, a significant
Qt test, and
I2 of zero or less included age, ethnicity, number of household members, housing status, cooperative membership, fixed assets, loan situation, and location. Therefore, a fixed-effects model was chosen to continue the analysis. The other 10 variables were estimated using a random-effects model. According to the
Qt significance test and
I2 > 75% rule, there was high heterogeneity in subsidy amount, livestock quantity, and grassland area. The
Qt significance test and
I2 > 50% rule indicated significant heterogeneity in labor force quantity, production expenditure, and per capita grassland area. Heterogeneity was relatively low among gender, education level, living expenses, and grassland quality variables.
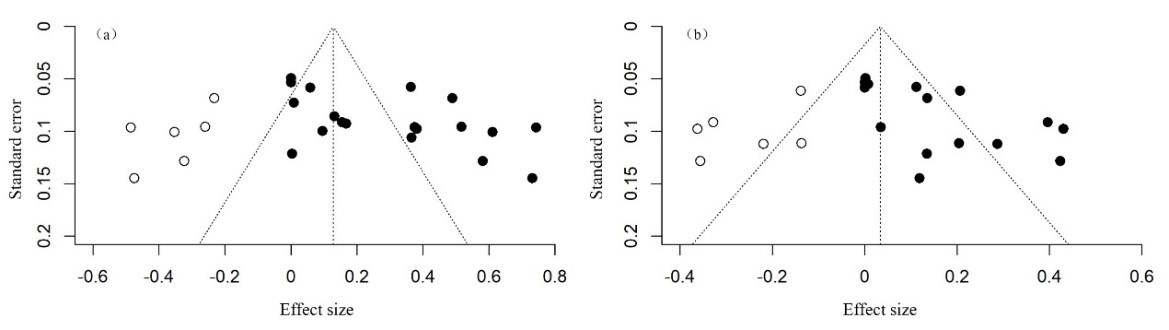
3.1.2. Publication Bias Evaluation
Among the 18 variables examined in this study, livestock quantity (
p = 0.0108) and grassland area (
p = 0.0006) displayed publication bias, while the rest did not (
). After adjusting for variables using the trim-and-fill method, six studies were added to the left side of the variable livestock quantity funnel plot (
a), with another six added to the left side of the variable grassland area funnel plot (
b), eliminating the publication bias.
. Publication bias correction funnel plot. Note: (<b>a</b>) is a funnel plot after adjusting the number of livestock, (<b>b</b>) is a funnel plot after adjusting grassland area. Solid circles represent true values, and hollow circles mark missing documents filled in.
3.1.3. Comprehensive Effect Values
Individual Characteristics of Herdsmen
Gender, age, ethnicity, and education level all passed the significance test (
). Education level exerts a significant positive effect on herdsmen’s income; higher levels of education lead to more diverse income sources and a greater likelihood of earning a relatively high income [
24,
25]. There is also a positive correlation between age and income. Older herders tend to have more life and production experience, positively influencing their incomes [
26]. Gender also positively affects income, potentially reflecting the physical demands of herding work, which may favor men in certain labor-intensive roles. Regarding ethnicity, although the five effect values in the original data did not pass the significance test, this review suggests that ethnicity positively affects income. Surveys have typically assigned values based on the local ethnic group (Han Chinese) or “other”. By integrating more comprehensive effect values, the study area expands; a more precise definition of ethnicity has a certain positive impact on herdsmen’s income.
Characteristics of Pastoral Households
The number of household members, labor force size, and cooperative membership all exhibit significant positive effects on herdsmen’s incomes, while housing status shows no such impact. A larger household labor force is associated with higher household income, as more working family members may translate directly into a larger source of income. Joining cooperatives also plays a positive role, as it helps mitigate risks related to climate change and policy adjustments, thereby providing a level of income security for herdsmen. Thus, increased cooperative membership is a key factor driving income growth among this population.
Characteristics of Pastoral Economy
The amount of grassland ecological subsidies has a significant positive effect on herdsmen’s incomes. Research has shown that when herders receive these subsidies, they tend to invest the funds into production and thereby directly increase their income [
27]. As a result, both production expenses and the number of livestock likewise significantly positively impact household incomes. Additionally, living expenses and fixed assets positively influence herdsmen’s incomes to some extent; however, the impact of loans on these incomes is not significant.
Ecological Geographical Features
Grassland area and per capita grassland area have significant positive effects on the incomes of herdsmen. Larger grassland areas lead to higher incomes. Higher-quality grasslands are conducive to healthy animal husbandry development and raise herdsmen’s income levels. Closer distance between herder families and county townships, larger towns, bus stations, markets, or main roads make it easier for herdsmen to find diverse sources of work, increasing their incomes to some extent.
.
Comprehensive effect sizes and correlation test results.
| Variable |
n |
N |
E |
SEE |
Z |
p |
Confidence Interval |
Qt |
PQ |
I2(%) |
$$\bm{\tau}^{2}$$ |
ZE |
PE |
| Lower |
Upper |
| Gender |
6 |
1755 |
0.0704 |
0.0278 |
2.5325 |
0.0113 |
0.0159 |
0.1248 |
6.6075 |
0.2515 |
25.01 |
0.0012 |
−0.2430 |
0.8080 |
| Age |
21 |
4219 |
0.0766 |
0.0155 |
4.9355 |
<0.0001 |
0.0462 |
0.1070 |
14.3763 |
0.8109 |
0.00 |
0.0000 |
1.7027 |
0.0886 |
| Ethnicity |
5 |
1224 |
0.0607 |
0.0288 |
2.1104 |
0.0348 |
0.0043 |
0.1171 |
1.0152 |
0.9075 |
0.00 |
0.0000 |
−0.1498 |
0.8809 |
| Educational level |
21 |
4514 |
0.0977 |
0.0172 |
5.6836 |
<0.0001 |
0.0640 |
0.1314 |
21.3246 |
0.3783 |
19.96 |
0.0012 |
0.7006 |
0.4836 |
| Number of household members |
6 |
1153 |
0.0705 |
0.0297 |
2.3750 |
0.0175 |
0.0123 |
0.1287 |
3.0800 |
0.6877 |
0.00 |
0.0000 |
0.4707 |
0.6379 |
| Labor force quantity |
20 |
3751 |
0.1277 |
0.0248 |
5.1471 |
<0.0001 |
0.0790 |
0.1763 |
38.7893 |
0.0047 |
50.90 |
0.0057 |
0.1991 |
0.8422 |
| Housing status |
5 |
1265 |
0.0232 |
0.0283 |
0.8198 |
0.4123 |
−0.0323 |
0.0786 |
3.8634 |
0.4248 |
0.04 |
0.0000 |
1.3889 |
0.1649 |
| Cooperative membership |
5 |
1184 |
0.0684 |
0.0292 |
2.3386 |
0.0194 |
0.0111 |
0.1257 |
2.5398 |
0.6375 |
0.00 |
0.0000 |
0.5316 |
0.5950 |
| Subsidy amount |
20 |
3965 |
0.1729 |
0.0520 |
3.3214 |
0.0009 |
0.0709 |
0.2749 |
143.6888 |
<0.0001 |
90.09 |
0.0473 |
0.4863 |
0.6267 |
| Number of livestock |
19 |
3096 |
0.2949 |
0.0578 |
5.1020 |
<0.0001 |
0.1816 |
0.4081 |
163.6382 |
<0.0001 |
89.58 |
0.0550 |
2.5488 |
0.0108 |
| Living expenses |
6 |
1402 |
0.1609 |
0.0405 |
3.9751 |
<0.0001 |
0.0816 |
0.2402 |
10.7607 |
0.0563 |
53.45 |
0.0051 |
0.8515 |
0.3945 |
| Production expenses |
14 |
1641 |
0.1642 |
0.0398 |
4.1272 |
<0.0001 |
0.0862 |
0.2421 |
29.1574 |
0.0062 |
56.89 |
0.0119 |
0.5421 |
0.5878 |
| Fixed assets |
5 |
1352 |
0.0630 |
0.0273 |
2.3046 |
0.0212 |
0.0094 |
0.1166 |
2.7921 |
0.5932 |
0.00 |
0.0000 |
1.3402 |
0.1802 |
| Loan situation |
10 |
2838 |
0.0320 |
0.0189 |
1.6955 |
0.0900 |
−0.0050 |
0.0690 |
7.5194 |
0.5832 |
0.12 |
0.0000 |
1.9596 |
0.0500 |
| Grassland area |
16 |
3281 |
0.1371 |
0.0376 |
3.6416 |
0.0003 |
0.0633 |
0.2109 |
52.7720 |
<0.0001 |
75.59 |
0.0157 |
3.4287 |
0.0006 |
| Per capita grassland area |
9 |
1084 |
0.2013 |
0.0487 |
4.1334 |
<0.0001 |
0.1058 |
0.2967 |
19.2185 |
0.0137 |
55.55 |
0.0112 |
1.3067 |
0.1913 |
| Grassland quality |
7 |
2299 |
0.0622 |
0.0261 |
2.3793 |
0.0173 |
0.0110 |
0.1135 |
9.1776 |
0.1638 |
35.14 |
0.0017 |
0.4991 |
0.6177 |
| Location |
8 |
2189 |
0.0842 |
0.0215 |
3.9194 |
<0.0001 |
0.0421 |
0.1264 |
6.0464 |
0.5343 |
0.00 |
0.0000 |
0.3665 |
0.7140 |
3.2. Sensitivity Analysis
To avoid bias from individual extreme values affecting the research results, the robustness of the findings was tested using the “leave one out” method before conducting a sensitivity analysis on the variables. Due to the large number of results, the effect values of one significant factor (per capita grassland area) and one insignificant factor (loan situation) in relation to herdsmen’s incomes are described here as an example (
Table S2). The removal of a single study from either set had minimal impact on their significance, effect values, confidence intervals, or heterogeneity, suggesting that the statistical results presented in
are robust.
3.3. Analysis of Regulatory Effects
3.3.1. Meta-Regression Analysis
Three variables demonstrated high heterogeneity (
I2 > 75% and
Qt significance less than 0.05) among different studies in the meta-analysis: Subsidy amount, livestock quantity, and grassland area. To further explore this heterogeneity, variables with significant heterogeneity (
I2 > 50%, and
Qt significance less than 0.05) were introduced: Labor force quantity, production expenses, and per capita grassland area. The six moderating variables introduced in this analysis are literature type, publication year, research area, statistical method, data point, and variable type. The heterogeneity (
Qm) caused by a certain moderating variable was calculated as well.
Among variables with high heterogeneity, the subsidy amount is influenced by statistical methods, which can explain 31.01% of the overall heterogeneity in this variable (
). The other five moderating variables show no significant impact on the subsidy amount. Literature type can explain 23.22% of the variation in the effect value of livestock quantity, while the remaining five moderating variables have no significant impact. Grassland area is also affected by statistical methods, which can explain 39.27% of the variation in this variable (
). The statistical method exhibits significant heterogeneity for both subsidy amounts and grassland areas, highlighting the importance of selecting appropriate statistical methods in the analysis of raw data. Different statistical approaches may introduce certain biases in the results; thus, further subgroup analyses are necessary.
Among the three variables with significant heterogeneity, the six moderating variables have no significant impact on labor force quantity and production expenses; the research area can explain all the heterogeneity caused by the per capita grassland area. The introduced moderating variables did not exert a significant moderating effect on any variable, suggesting the existence of other moderating variables that may be addressed in future research.
.
Meta-regression analysis.
| Adjusting Variables |
Subsidy Amount |
Number of Livestock |
Grassland Area |
Labor Force Quantity |
Production Expenses |
Per Capita Grassland Area |
| Qm |
p |
R2(%) |
Qm |
p |
R2(%) |
Qm |
p |
R2(%) |
Qm |
p |
R2(%) |
Qm |
p |
R2(%) |
Qm |
p |
R2(%) |
| Literature type |
0.3995 |
0.5274 |
0.00 |
5.3841 |
0.0203 |
23.22 |
0.2364 |
0.6268 |
0.00 |
1.1661 |
0.2802 |
10.27 |
1.9812 |
0.1593 |
19.18 |
0.0863 |
0.7689 |
0.00 |
| Publication year |
0.0809 |
0.7761 |
0.00 |
0.8479 |
0.3572 |
0.00 |
2.3999 |
0.1213 |
12.38 |
0.1268 |
0.7218 |
0.00 |
0.0038 |
0.9506 |
0.00 |
0.7452 |
0.3880 |
0.00 |
| Research area |
5.3210 |
0.3780 |
1.16 |
6.6712 |
0.1543 |
15.36 |
6.7586 |
0.1492 |
20.60 |
3.9775 |
0.5527 |
0.00 |
1.3786 |
0.7105 |
0.00 |
15.6066 |
0.0004 |
100 |
| Statistical method |
11.0200 |
0.0263 |
31.01 |
6.8744 |
0.1427 |
15.83 |
7.7763 |
0.0205 |
39.27 |
5.5791 |
0.1340 |
31.04 |
2.0280 |
0.5666 |
0.00 |
3.4994 |
0.0614 |
43.26 |
| Data nodes |
1.0405 |
0.3077 |
0.00 |
0.2047 |
0.6509 |
0.00 |
4.5489 |
0.0529 |
27.51 |
1.1954 |
0.2742 |
0.00 |
0.3009 |
0.5833 |
0.00 |
0.3243 |
0.5690 |
0.00 |
| Variable type |
0.0010 |
0.9745 |
0.00 |
1.6267 |
0.2022 |
3.44 |
- |
- |
- |
0.3564 |
0.5505 |
0.00 |
0.0761 |
0.7826 |
0.00 |
- |
- |
- |
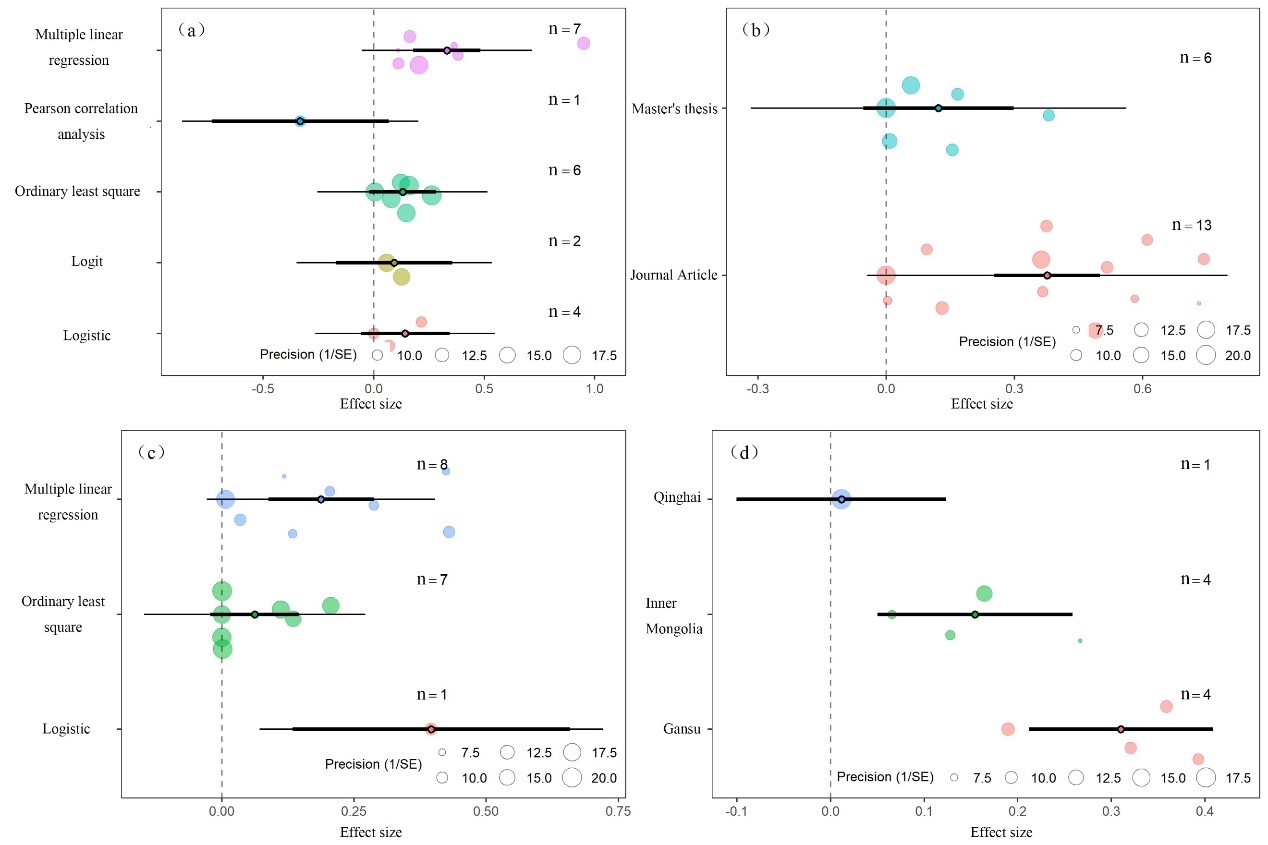
3.3.2. Subgroup Analysis
Building on the results of the meta-analysis, the specific effects of moderating variables on four key variables (subsidy amount, livestock quantity, grassland area, and per capita grassland area) were further investigated. According to the subgroup analysis results of the statistical method for subsidy amount (
a), only multiple linear regression exhibits a significant positive effect on herdsmen’s incomes. Pearson’s correlation analysis, ordinary least squares, logit, and logistic regression methods show no significant impact. In the literature type subgroup analysis of livestock quantity (
b), Master’s theses demonstrate no significant impact on herdsmen’s incomes, while journal articles show a significant positive impact. The Master’s thesis may have employed relatively simplified statistical models or smaller sample sizes, which could limit its ability to capture the subtle mechanisms underlying changes in herder income. In contrast, journal articles are typically subject to rigorous peer review. They may be based on larger datasets or more complex econometric models, thereby enabling them to reveal more significant positive effects. While Master’s theses might focus on descriptive analysis or preliminary exploration, journal articles tend to delve deeper into potential mechanisms (such as technological support and policy interventions), thus identifying notable positive impacts.
Furthermore, the subgroup analysis of statistical methods for grassland areas (
c) indicates that multiple linear and logistic regression positively affect herdsmen’s incomes. However, there is no such significant impact in cases of ordinary least square analysis. As per the subgroup analysis of per capita grassland area among study areas (
d), Qinghai shows no significant effect on herdsmen’s incomes, whereas Inner Mongolia and Gansu exhibit positive effects on herdsmen’s incomes.
. Subgroup analysis chart. Note: (<b>a</b>) is a subgroup of statistical methods for subsidy amounts; (<b>b</b>) is a subgroup of literature types for livestock quantity; (<b>c</b>) is a subgroup of statistical methods for grassland areas; (<b>d</b>) is a study area subgroup for per capita grassland area. Black circles represent the mean effect value, thick black lines represent confidence intervals, and thin black lines represent predicted intervals.
4. Discussion
In terms of herdsmen’s individual characteristics, gender, age, ethnicity, and education level all exhibit a significant positive effect on income. This contrasts with Guan et al.’s [
28] study, which showed that age did not have a significant effect, the present study’s larger number of effect values may provide a more comprehensive analysis and, thus, greater accuracy. Among demographic variables, access to information, learning abilities, and other competencies may improve herdsmen’s capacity for increased income. In pastoral areas where education levels are generally low, individuals with higher education levels tend to have significant advantages in terms of livelihood [
29]. It is worth noting that international comparisons, such as those between China and Mongolia or Ethiopia—countries with large herding populations—indicate that similar trends exist across different cultural contexts. For instance, higher education levels in Mongolia are also associated with better livelihood outcomes for herders [
30].
Regarding household characteristics, the number of workers in the home has the largest effect value and a significant positive impact. This may be because, once the household’s animal husbandry needs are met, surplus labor can transition to non-pastoral work and create a shift towards part-time farming with more diverse sources of income. Consequently, the role of diversified labor in boosting household income is significant [
12]. Similar patterns have been observed in Ethiopia, where household size and labor allocation play critical roles in determining household wealth and income [
31].
Among economic characteristics, livestock quantity appears to have the strongest effect on herdsmen’s incomes. Livestock has traditionally been the most critical asset for herder families. There has been recent growth in the animal husbandry sector, with livestock product prices remaining high and stable, ensuring lucrative returns for farmers and herdsmen. Government support for animal husbandry has been robust, allowing more advanced breeding technologies to be widely adopted as breeding cooperatives proliferate. Output has steadily increased as breeding techniques have improved and input costs have declined [
32]. Comparatively, in countries like Mongolia, government incentives for modernizing livestock production have also contributed to income growth among herders [
33].
In terms of ecological and geographic features, per capita grassland area has the highest effect value. Adequate grassland resources are essential for herdsmen to establish animal husbandry practices and sustain their livelihoods successfully. In recent years, grassland desertification and degradation have become serious issues; grassland availability is currently a critical factor limiting herdsmen’s incomes. International comparisons suggest that, despite differences in governance approaches, the challenge of grassland degradation is a global concern. For example, overgrazing and land-use conflicts in Ethiopia have led to similar issues, though solutions differ due to local socio-economic contexts [
34].
In this study, among the 18 variables influencing herdsmen’s incomes, only housing status and loan conditions did not show a significant impact; the other 16 variables all exhibited positive effects. This suggests that the factors affecting herdsmen’s incomes are quite diverse. Although grassland compensation policies are primarily ecological in focus, they must also address the livelihoods of pastoral families. Policies like the grazing ban and grass-livestock balance imperatives often result in economic losses for herders, with the grazing ban exerting a particularly pronounced impact. The ban was designed to transition grasslands from traditional grazing to other uses, depriving herders of potential benefits. Grass-livestock balance policies mandate the recovery of grasslands from overgrazed states to sustainable carrying capacities, the costs of which are borne by herdsmen in the form of reduced livestock quantities. Without adequate compensation mechanisms, herders may be reluctant to accept these policies and turn to illegal grazing and continued overstocking.
This study examined the factors influencing herdsmen’s incomes within the context of current grassland ecological compensation policies. Compensation or subsidy amounts significantly positively affect herdsmen’s incomes, as per the results of this analysis. However, previous studies have shown that these policies have a more pronounced impact on increasing income for low-income herders while the impact on high-income households is minimal [
12,
15]. This may be because low-income herders tend to rely on singular income sources, with policy subsidies comprising a substantial portion of their total household income. In contrast, high-income households tend to have more diverse income streams, making subsidies less impactful for them. While subsidy quantities significantly affect herdsmen’s incomes, they primarily benefit low-income households that are more reliant on these policies [
35]. Therefore, it is crucial to sustain the implementation of these policies while broadening the sources of income available to economically disadvantaged families.
This study conducted a meta-analysis to synthesize empirical studies on the factors influencing herders’ income under a single grassland ecological subsidy policy, thereby extending research from a single region to a broader scope and providing a more comprehensive understanding of the impact of China’s grassland ecological subsidy policy on herders’ income. In line with the analysis process of the meta-analysis, apart from discussing publication bias, pooled effect size, heterogeneity, and regression analysis, the selection of variables that may influence the research results at the study level is made more closely aligned with the literature sources themselves.
5. Conclusions
This study conducted a meta-analysis to comprehensively examine publicly available empirical research on the impact of grassland ecological compensation policies on herdsmen’s incomes in China. The findings can be summarized as follows.
- (1)
-
While accounting for heterogeneity, 16 influencing factors, including gender, age, ethnicity, education level, number of household members, labor force quantity, cooperative membership, subsidy amount, livestock quantity, living expenses, production expenses, fixed assets, grassland area, per capita grassland area, grassland geological quantity, and location all have significant positive effects on herdsmen’s incomes.
- (2)
-
Among the various factors affecting herdsmen’s incomes, livestock quantity, subsidy amount, and per capita grassland area appear to have the most significant impact.
- (3)
-
The factors affecting herdsmen’s incomes are not entirely homogeneous, as evidenced by the significant heterogeneity across different studies on this subject. Subsidy amount, livestock quantity, grassland area, labor quantity, production expenditure, and per capita, grassland area variables exhibit particularly noteworthy heterogeneity. The heterogeneity in subsidy amount and grassland area can be attributed to differences in statistical methods. Concerning livestock quantity, heterogeneity stems from differences in literature type, while the heterogeneity in per capita grassland area is due to geographical differences in study areas.
This study has certain limitations: the number of included studies is limited, which results in smaller sample sizes for some variables and lower statistical power; among the moderator variables selected for subgroup analysis, some do not have significant effects, and there may be other moderator variables. More comprehensive moderator variables can be chosen in the future to make the overall analysis more convincing.
Based on the analysis and conclusions of this study, the following recommendations are proposed:
- (1)
-
Given the positive impact of compensation amounts on herder income revealed in this research, it is suggested to gradually increase the standards of ecological compensation to ensure that herders receive reasonable economic returns due to ecological conservation. Moreover, differentiated compensation standards should be formulated based on different regions’ ecological sensitivity and economic development levels, avoiding a “one-size-fits-all” approach.
- (2)
-
Encourage herders to develop diversified livelihoods, such as eco-tourism, speciality agricultural product cultivation and sales, etc., to reduce reliance on single livestock farming income.
- (3)
-
Through establishing a mechanism for shared benefits, involve herders more actively in ecological conservation projects, ensuring they benefit from these activities.
- (4)
-
Establish and improve monitoring and evaluation systems for ecological compensation projects, regularly assess the implementation effects of these projects, and promptly adjust and refine policies and measures.
- (5)
-
Deeply carry out environmental awareness education campaigns to enhance herders’ understanding of the importance of ecological conservation and stimulate their proactive participation in conservation efforts.
Supplementary Materials
The following supporting information can be found at: https://www.sciepublish.com/article/pii/505, Figure S1: The process of selecting literature; Table S1: Research samples and encoding; Table S2: Variable sensitivity analysis.
Acknowledgments
The authors are grateful to several researchers whose published articles were used for this meta-analysis.
Author Contributions
All authors contributed to the study’s conception and design. Material preparation, data collection and analysis were performed by S.L. The first draft of the manuscript was written by S.L. and all authors commented on previous versions of the manuscript. All authors have read and approved the final manuscript.
Ethics Statement
Not applicable.
Informed Consent Statement
Not applicable.
Data Availability Statement
The raw data supporting the conclusions of this article will be made available by the authors on request.
Funding
No funding was received for conducting this study.
Declaration of Competing Interest
The authors declare that they have no known competing financial interests or personal relationships that could have appeared to influence the work reported in this paper.
References
1.
Yang C, Zhu ZY, Han Z. The production behaviors of herdsmen in Shanxi and Xinjiang in related to the grassland ecological protection and complement policies.
J. Arid. Land Resour. Environ. 2018,
32, 27–32.
[Google Scholar]
2.
Ding WQ, Li P, Yin YT, Hou XY. Vulnerability of herder households under the framework of sustainable livelihoods in the grassland of Northern China.
Acta Pratacult. Sin. 2017,
26, 1–11.
[Google Scholar]
3.
Ye H, Fang J, Zhu LZ, Qu JL, Han F. The study on the construction of grassland ecological compensation mechanism in China’s pastoral areas.
Chin. J. Agric. Resour. Reg. Plan. 2020,
41, 202–209.
[Google Scholar]
4.
Wang Q, Chen MM, Li P. Hotspots and frontier analysis of grassland policy research in China in the past three decades.
Chin. J. Grassl. 2023,
45, 92–101.
[Google Scholar]
5.
Zhou SQ, Ding WQ, Sun PF, Zhao K. Dynamic evaluation of livelihood resilience of farmers and herdsmen in the areas implementing grassland ecological compensation policy and analysis of the obstacle factors.
J. Arid. Land Resour. Environ. 2024,
38, 41–50.
[Google Scholar]
6.
Batkhishig O, Erdenebat T. Challenges Facing Mongolian Steppe Ecosystems: Climate Change and Overgrazing.
Mong. J. Geogr. Nat. Resour. 2018,
12, 102–115.
[Google Scholar]
7.
Mortimore M, Harris F. Addressing Land Degradation and Poverty in the Sahel Region.
Glob. Environ. Chang. 2018,
50, 1–12.
[Google Scholar]
8.
Dong SK, Tang FL, Ping XY, Yang XC, Yang Z, Lin CC, et al. Zoning and functions of China’s grassland in the New Era of ecological civilization.
J. Nat. Resour. 2022,
37, 568–581.
[Google Scholar]
9.
Jin LS, Hu ZT. Grassland ecological compensation policy and chooses of the herdsmen.
Reform 2014,
11, 100–107.
[Google Scholar]
10.
Kagombe JK, Cheboiwo J, Gichu A, Handa C, Wamboi J. Payment for environmental services: status and opportunities in Kenya.
J. Resour. Dev. Manag. 2018,
40, 1–13.
[Google Scholar]
11.
Jiang YW, Bai WL, Hu FW, Luo TX. Evaluation of the benefit produced by the policy about ecological protection subsidy incentives for natural grassland.
J. Anim. Sci. Vet. Med. 2016,
35, 95–97.
[Google Scholar]
12.
Zhi R, Chen MM, Yan M, Li P. Research on the influence of herdsmen’s family income under the grassland subsidy policy——take Xilingol league, Inner Mongolia as an example.
Acta Agrestia Sin. 2022,
30, 3392–3401.
[Google Scholar]
13.
Ding WQ, Jimoh SO, Hou XY, Su XH, Dong HB, Bolormaa D, et al. Grassland ecological subsidy policy and livestock reduction behavior: A case study of herdsmen in northern China.
Rangel. Ecol. Manag. 2022,
81, 78–85.
[Google Scholar]
14.
Zhang J, Brown C, Qiao G, Zhang B. Effect of eco-compensation schemes on household income structures and herder satisfaction: lessons from the grassland ecosystem subsidy and award scheme in Inner Mongolia.
Ecol. Econ. 2019,
159, 46–53.
[Google Scholar]
15.
Ma YF, Li M, Yao L, Ji H, Yu ZN. Evaluating the effects of grassland ecological compensation on herders’ income and policy credibility.
Chin. J. Grassl. 2024,
46, 101–110.
[Google Scholar]
16.
Xu SL, Lv ZH. Study on the application paradigm of Meta-analysis in economics.
J. Stat. Inf. 2019,
34, 34–41.
[Google Scholar]
17.
Li H, Li SP, Nan L. Influencing factors of farmers’ willingness to transfer land in China: A meta-analysis based on 29 literatures.
J. Agrotech. Econ. 2017, 78–93.
[Google Scholar]
18.
Koricheva J, Gurevitch J, Mengersen K. Handbook of Meta-Analysis in Ecology and Evolution; Princeton University Press: Princeton, NJ, USA, 2013; pp. 72–86.
19.
Wang RQ, Qin CY. The improvement of testing methods for heterogeneity in Meta analysis.
Sci. Technol. Eng. 2012,
12, 2256–2259.
[Google Scholar]
20.
Benitez-lopez A, Alkemade R, Schipper AM, Ingram DJ, Verweij PA, Eikelboom JAJ, et al. The impact of hunting on tropical mammal and bird populations.
Science 2017,
356, 180–183.
[Google Scholar]
21.
Higgins JP, Thompson SG, Deeks JJ, Altman DG. Measuring inconsistency in meta-analyses.
Br. Med. J. 2003,
327, 557–560.
[Google Scholar]
22.
Egger M, Smith GD, Schneider M, Minder C. Bias in meta-analysis detected by a simple, graphical test.
Br. Med. J. 1997,
315, 629–634.
[Google Scholar]
23.
Borenstein M, Hedges LV, Higgins JP, Rothstein HR. Introduction to Meta-Analysis; John Wiley & Sons: Hoboken, NJ, USA, 2021; pp. 107–125.
24.
Dong X, Dai G, Ulgiati S, Na RS, Zhang XS, Kang MY, et al. On the relationship between economic development, environmental integrity and well-being: The point of view of herdsmen in northern China grassland.
PLoS ONE 2015,
10, e0134786.
[Google Scholar]
25.
Han F, Zhu LZ. Study on herdsman’s livelihood under grassland ecological management—Based on survey of Gannan grassland.
J. Huazhong Agric. Univ. (Soc. Sci.Ed.) 2017,
2, 37–44.
[Google Scholar]
26.
Ma XP, En H. Impact of grassland ecological protection and subsidy policy on herdsmen’s income.
Agric. Outlook 2017,
13, 24–28.
[Google Scholar]
27.
Liu YC, Zhang XL. Effect of grassland ecological protection subsidy policy on households’ income.
J. Arid. Land Resour. Environ. 2019,
33, 60–67.
[Google Scholar]
28.
Guan SQ, Li HW, Tang Z. Key factors affecting herder’s income: A Meta-analysis and cumulative Meta-analysis.
Acta Pratacult. Sin. 2021,
30, 1–15.
[Google Scholar]
29.
Liu LJ, Chen HB, Shao L. Q. Do grassland subsidy and reward promote herdsmen’s income and income source diversification? —An empirical study in Qinghai province.
J. Arid. Land Resour. Environ. 2023,
37, 42–47.
[Google Scholar]
30.
Batkhuyag B, Enkh-Amgalan T, Purevjav N, Davaasuren B. Comparative Analysis of Herder Income in Mongolia.
Mong. J. Agric. 2021,
25, 56–67.
[Google Scholar]
31.
Gebrehiwot TT, Van der Hoek W, Sietz D. Household Wealth Determinants in Ethiopian Pastoral Areas.
Afr. J. Agric. Res. 2020,
15, 1845–1854.
[Google Scholar]
32.
Cui XJ, Yang JY, Du YH, Wu Q, Chen QQ. An empirical study on livelihood strategy choice and influencing factors of farmers and herdsmen in the agro-pastoral ecotone: Tianzhu Tibetan Autonomous County.
Pratacult. Sci. 2022,
39, 829–840.
[Google Scholar]
33.
Erdenebat E, Boldbaatar B, Batjargal Y, Davaakhuu B, Tuvshintugs N, Purevtseren B, et al. Modernization of Livestock Production in Mongolia.
J. Anim. Sci. 2022,
98, 234–245.
[Google Scholar]
34.
Abebe G, Bewket W, Tadesse T, Mamo G. Land Use Conflicts and Degradation in Ethiopian Pastoral Regions.
Glob. Environ. Chang. 2021,
72, 102–113.
[Google Scholar]
35.
Ji CT, Lin HL. Effect of grassland ecological compensation policy on household income of farmers and herdsmen on the northern slope of Qilian Mountains.
Chin. J. Grassl. 2020,
42, 118–126.
[Google Scholar]