1. Introduction
With the global population continuously expanding, the importance of prioritizing renewable energy and energy-saving technologies has become paramount. Currently, domestic water usage represents 10% of the world’s total water consumption, and projections suggest a 20% increase in the next decade [
1]. Within residential buildings, water heating stands as the second-largest energy consumer, accounting for approximately 20% of a home’s overall energy consumption [
2]. In Canada, the average daily hot water usage per person is 75 liters, with water heaters responsible for 17.2% of residential energy use [
3]. To address this issue and reduce water heating energy consumption, drain water heat recovery (DWHR) systems have emerged as a promising solution. These systems leverage heat exchangers to preheat incoming cold water using outgoing warm greywater, resulting in potential energy savings of up to 25% in water heating [
4,
5]. The investment required for a typical DWHR system is typically recovered within its operational lifespan [
6,
7]. Vertical installation of DWHR systems has proven to be more effective in heat recovery compared to horizontal configurations [
8]. Regardless of climatic conditions, households can experience significant cost savings on their electricity bills by adopting DWHR devices [
9]. Moreover, DWHR systems have the potential to be implemented on a larger scale within sewer networks, offering enhanced environmental sustainability compared to individual residential units, which primarily provide economic sustainability [
10,
11].
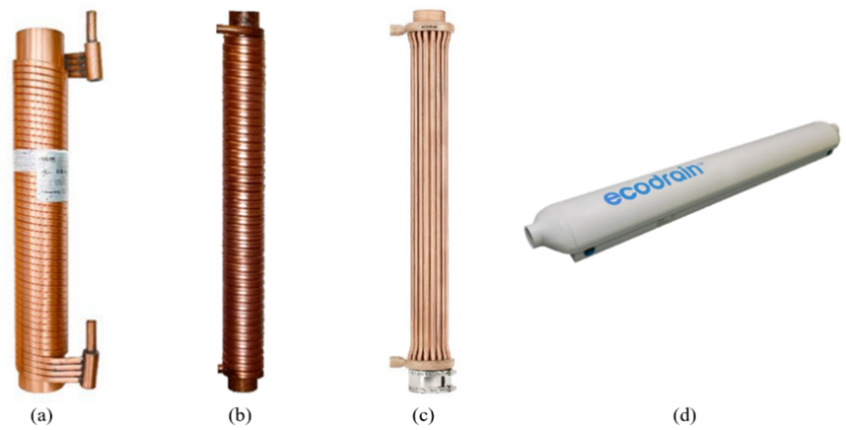
A DWHR system reduces energy consumption by transferring heat between two fluids. The two fluids in residential use are warm grey water and cold freshwater. Excess thermal energy in grey water is transferred to preheat fresh cold water before it reaches the water heater. This reduces the home’s water heating energy consumption. A DWHR device can be designed and installed in various orientations, sizes, and locations within a building. Vertical units recover more heat but may require more space, while horizontal units may be more suitable for homes with limited space or no basement. Vertical devices typically use a copper helix wrapped around a central copper drainpipe, either in a single or quadruple pass. shows different vertical and horizontal DWHR device designs.
. (
a) is a vertical DWHR device with a quadruple copper helix [
12], (
b) is a vertical device with a single copper helix [
13], (
c) is a vertical device with straight cold water pathways [
14], (
d) horizontal design [
14].
Typical DWHR performance is evaluated under steady-state condition using the effectiveness method to predict thermal performance. Under clean and steady-state conditions, the effectiveness of DWHR devices typically falls within the range of 20–50%. This effectiveness is constrained by the contact resistance between the hot and cold pipes, as well as the thermal resistance of the drain hot water [
15]. During operation, the effectiveness of the system is optimal when drain water fully wets the heat transfer surface, but significantly decreases under partially wet conditions [
15]. Many research studies have examined DWHR devices under different configurations and operating conditions in steady-state. Zaloum et al. [
7] tested eight DWHR devices using the effectiveness method and found that the best performing device has a quadruple helical pass for the cold-water flow. Economic analysis showed the payback period for the best device to be under six years. Manouchehri and Collins [
16] created a model to accurately predict the performance of installed DWHR devices, validated through experimental testing. Beentjes et al. [
17] found an inverse relationship between effectiveness and flow rate in falling-film DWHR devices and observed unpredictable effectiveness at low flow rates due to uneven surface wetting. Salama and Sharqawy [
15] explained that DWHR systems operating under partially wet conditions can see a 28.5% reduction in effectiveness, with uniform film of drain water needed for high effectiveness.
The dynamic behavior of a heat exchanger can significantly differ from its steady-state performance under transient conditions. Zaloum et al. [
7] observed minimal variation between transient and steady-state data when testing a residential DWHR unit, while Askar et al. [
18] identified an increase in response time correlated with the magnitude of a step change in mass flow rate for a crossflow heat exchanger. Gao et al. [
19] revealed complex thermal performances during transient periods, resulting in decreased energy efficiency. They found that the duration of temperature changes, rather than initial conditions, influenced the transient response of a heat exchanger.
The existing literature displays a limited focus on the dynamic performance of residential DWHR systems, with most studies concentrating solely on steady-state conditions. However, as heat recovery in residential systems inherently involves dynamic processes, this study investigates the transient performance of a DWHR system through experimental measurements conducted on a typical residential DWHR installation. We capture the temporal variations of hot and cold-water temperatures under step heat input, analyzing the system’s time response, effectiveness, and economic implications during transient operation. The aim is to ascertain the impact of operating conditions on the system’s response time and identify economic weaknesses associated with transient operating conditions.
2. Experimental Setup
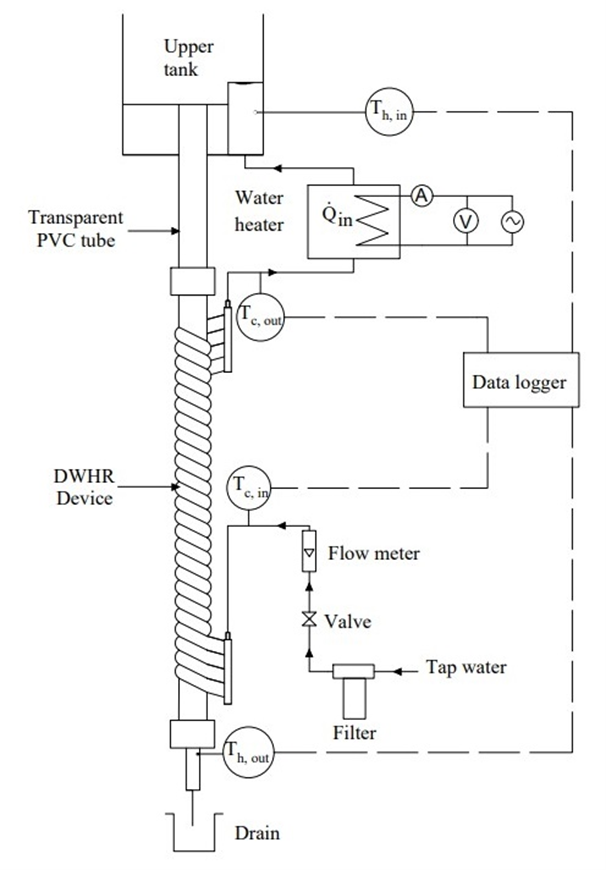
illustrates the setup employed to measure the dynamic performance of the DWHR device. The setup includes a DWHR unit connected to an open water circuit designed to mimic a real residential system installation. The experiments were conducted using tap water. However, in real installations, grey water is typically used as the hot water source. The DWHR device comprises a 3-inch nominal copper drainpipe, where hot water forms a film on its inner surface. The DWHR device comprises a 3-inch nominal copper drainpipe, where grey water forms a film on its inner surface. Four parallel copper helical coils carry cold water are wrapped around the drainpipe, which is heated by the hot grey water. Prior to the cold inlet, a flow meter and inline cartridge filter are installed. The temperature of the cold inlet is measured using a K-type thermocouple, while another thermocouple records the cold outlet temperature. An electric tankless water heater, equipped with two 3-kW heating elements and a power input range of 1–6 kW, is used to elevate the flow temperature. The heated water enters a partition in the upper tank, ensuring steady laminar flow and reducing turbulence as it enters the central drainpipe. A transparent PVC tube allows for visual observation of the hot water flowing into the DWHR hot inlet. Thermocouples are employed to measure the hot inlet and outlet temperatures, and a data logger records temperature readings.
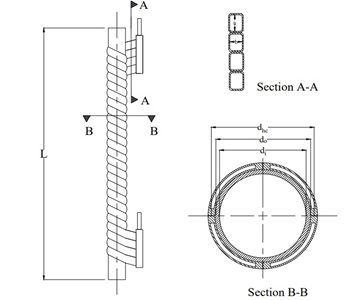
displays the major dimensions of the tested DWHR device, with corresponding values listed in Table 1. Prior to each experimental run, cold tap water was circulated through the device for 15 min until a thermal balance was achieved within the system. The electric water heater was then activated at a constant flow rate, and temperature measurements were recorded every 1 second for a duration of 25 min, until a steady-state condition was reached, indicated by no further temperature changes. The collected temperature data of the hot and cold fluids were analyzed to evaluate the dynamic performance of the DWHR device.
. Schematic of the experimental setup.
. DWHR device drawing with cross-sectional views.
. DWHR device dimensions.
3. Data Reduction and Analysis
The thermal performance of the DWHR device is assessed by analyzing its effectiveness. The rates of heat transfer from the hot water and to the cold water are calculated through energy balances using the following equations.
where $${\dot{Q}}_h$$ and $${\dot{Q}}_c$$ are the rate of heat transfer from the hot and cold water respectively, $${\dot{m}}_h$$ and $${\dot{m}}_c$$ are the mass flow rates of the hot and cold water respectively, and
ch and
cc are the specific heats of the hot and cold water respectively.
It is important to emphasize that during the transient operation, $${\dot{Q}}_h$$ will be larger than $${\dot{Q}}_c$$. Upon reaching steady state, $${\dot{Q}}_h$$ and $${\dot{Q}}_c$$ are equal. The effectiveness (
ε) of a heat exchanger is defined as the ratio of the actual heat transfer to the maximum possible heat transfer, as expressed by the following equation:
where $$\left(\dot{m}c\right)_{\text{min}}$$ is the lower value of the heat capacity rate for one of the two water streams (i.e., the hot and cold). For the current DWHR device, both water streams have the same mass flow rate since it operates in an open circuit. However, the cold water has slightly lower specific heat (
c) than the hot water because specific heat value increases with temperature. Therefore, the cold water has the minimum heat capacity rate in this analysis, hence the instantaneous effectiveness of the current DWHR device can be expressed as:
During the transient operating period, the effectiveness increases to approach the steady state value. The actual effectiveness considers the temperature variation from the beginning of the transient period and is therefore less than the instantaneous effectiveness. The actual effectiveness can be calculated by integrating the rate of heat transfer over the time from the starting of the heat transfer process as follows:
4. Results and Discussion
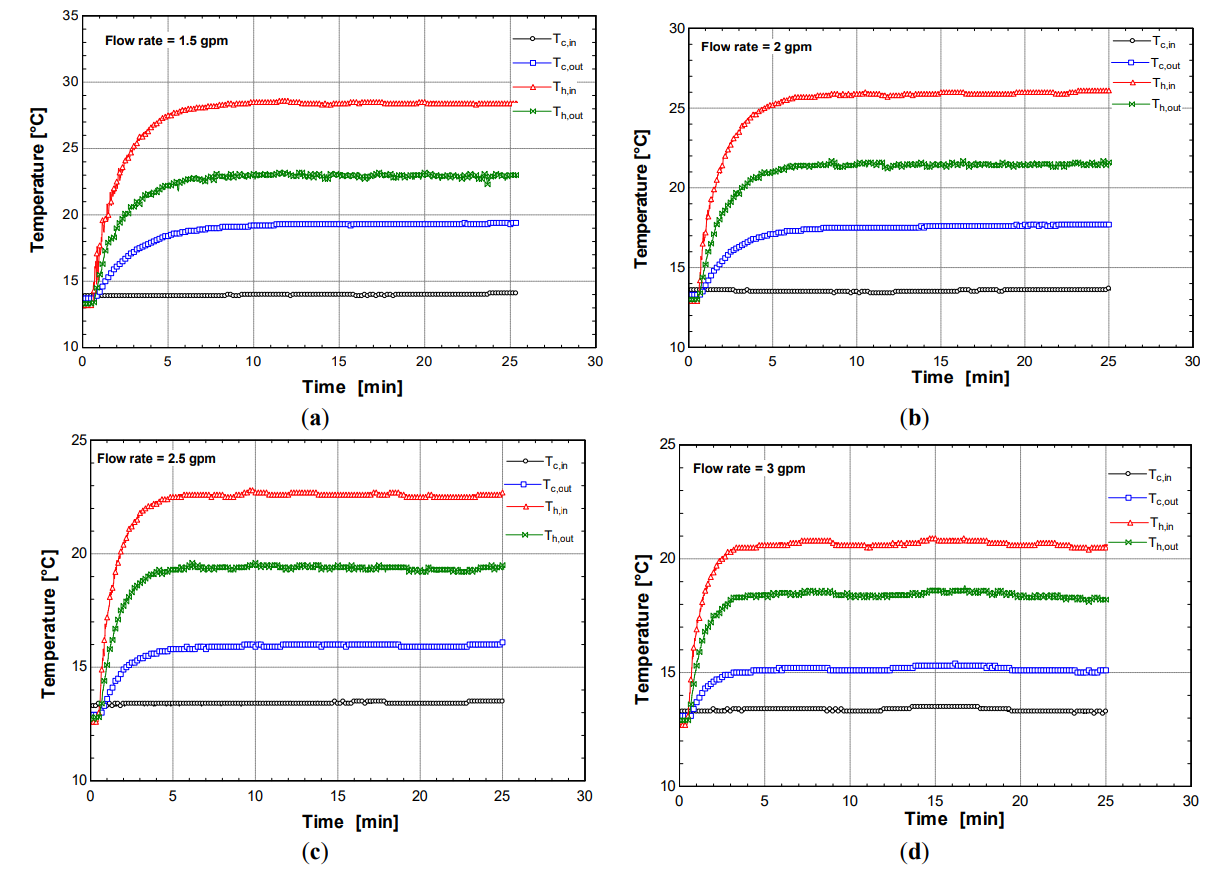
The collected temperature-time data, along with the water flow rate and heat input, were utilized to assess the transient performance of the DWHR device. Using the analysis discussed earlier, both the instantaneous and actual effectiveness were calculated. illustrates the temperature-time variations at flow rates of (a) 1.5 gpm, (b) 2 gpm, (c) 2.5 gpm, and (d) 3 gpm. As depicted in the figure, the outlet temperatures do not respond instantaneously to the heat input, and the response time differs based on the flow rate. The heat supply is positioned just before the inlet hot temperature, resulting in a sudden temperature increase. However, the cold-water outlet temperature gradually increases until reaching a steady state due to the thermal inertia of the device. At higher flow rates, the steady-state temperature of the outlet hot water is lower due to the increased heat transfer rate between the hot and cold fluids.
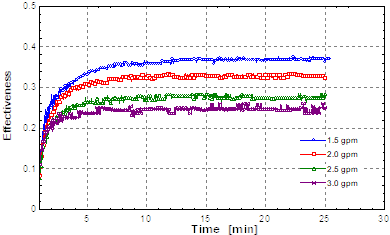
The thermal performance is represented by the experimental instantaneous effectiveness, as shown in . The instantaneous effectiveness steadily increases until reaching a steady state and is inversely related to the flow rate, indicating that more heat is transferred between the fluids at lower flow rates. The effectiveness of a heat exchanger can exhibit changes with time due to transient behavior, which is often overlooked in many heat exchanger analyses that predominantly focus on steady-state performance. As illustrated in , the heat exchanger’s transient performance reveals that initially, the effectiveness is considerably low and gradually increases over time until it reaches its final steady-state value. This phenomenon is referred to as the “thermal response time” and is dependent on factors such as flow rate and heat exchanger size. Understanding and accounting for this transient performance is crucial when accurately calculating the benefits of heat recovery from devices that operate for short periods. Neglecting the transient behavior may lead to inaccurate assessments of the heat exchanger’s efficiency and performance, especially when dealing with applications where the heat exchanger operates intermittently or experiences varying thermal loads. Considering the time-dependent effectiveness ensures a more comprehensive analysis and aids in making informed decisions when optimizing heat exchanger designs and evaluating their actual performance in real-world applications.
The response time (or simply response time) is a crucial metric for transient response performance, defined as the time taken for a system to reach 98.2% of the steady-state value after a disturbance. summarize the response time values for tested DWHR device at each flow rate obtained from the experimental measurements. The response time is commonly considered to be four times the time constant, which is the time required for the system to reach 63.2% of the steady-state value. The results shown here in are in terms of the response time which was determined from the experimental data by finding the time corresponding to 98.2% of the steady state hot-water outlet temperature.
. Temperature response at a flow rate of (a) 1.5 gpm, (b) 2 gpm, (c) 2.5 gpm, and (d) 3 gpm.
. Transient experimental effectiveness data at different flow rates.
Table 2. Response time calculated from the temperature response at each tested flow rate.
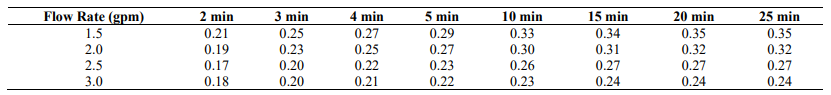
presents the actual or accumulated effectiveness values at different time intervals, calculated using Eq. (5). These effectiveness values are particularly valuable for analyzing the total energy recovered during short durations and transient operation. These time-dependent effectiveness values are of particular significance when analyzing the performance of the heat exchanger in applications where it operates intermittently or experiences varying thermal loads. Furthermore, these accumulated effectiveness values play a crucial role in the economic analysis conducted in Section 5. By incorporating the time response data from , we are able to assess the amount of energy recovered for each specific appliance that rejects warm water, such as sinks and showers, which have different operating times. Understanding the energy recovery for individual appliances is essential in evaluating the overall cost-benefit analysis of the heat exchanger system, as it enables us to identify and optimize the energy savings potential for various hot water applications. Thus, the data presented in significantly contributes to a comprehensive understanding of the heat exchanger’s performance and its economic implications in real-world settings.
It is important to mention that the uncertainty of the results is calculated by considering the uncertainty of each measured variable provided by the manufacturer of the instruments. The thermocouples have an uncertainty of ±0.1 °C and the flowmeters have an uncertainty of ±2%. The Vernier caliper used to gather measurement of the thickness and diameter of pipes and tubes have an uncertainty of 0.01 mm. The uncertainty analysis was conducted using the Engineering Equation Solver Software (EES). The effectiveness has an average and maximum calculated error of ±2.4% and ±7.5% respectively.
Table 3. Actual effectiveness at different time intervals calculated using Equation (5).
5. Economic Analysis
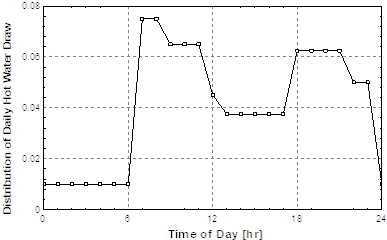
In this section, an economic analysis is conducted based on the average hot water consumption of a three-occupant house, using data provided by the National Renewable Energy Laboratory [
20]. illustrates the probability distribution of hot water draws throughout a 24-hour period, while presents the characteristics of domestic hot water events for a three-occupant household. The objective of this analysis is to accurately estimate the annual savings achieved by considering both the transient and steady-state performance of the DWHR device. Based on the data in , it is observed that the shower has an average usage time that exceeds the response time of the DWHR device at the corresponding flow rate. This implies that a portion of the device operation occurs in steady state, allowing for the full benefits of the DWHR device to be realized. It is important to note that heat recovery requires simultaneous water flow on both sides of the DWHR device. However, certain appliances such as dishwashers and washing machines do not meet this condition and will be disregarded in this analysis. Therefore, the economic analysis focuses on sink and shower usage during both steady-state and transient operating conditions. The analysis is conducted based on the following assumptions.
• Water heater input temperature
Tc,in = 13 °C
• Water heater output temperature
Tc,out = 50 °C
• DWHR inlet drain water temperature
Th,in = 30 °C
• Electricity cost is 0.130 $/kWh
• Natural gas cost is 0.304 $/m
3
(assuming 1 m
3 natural gas = 10.78 kWh leads to 0.028 $/kWh [
21])
. Fraction distribution of hot water draws over 24 h.
. Domestic hot water event characteristics for a three-occupant house [
22].
To determine the annual savings, we begin by calculating the steady-state and transient heat recovery rates as follows:
where $${\dot{Q}}$$
ss and $${\dot{Q}}$$
tr are the rate of heat transfer under steady state and transient condition respectively. Similarly,
εss and
εtr are the effectiveness at steady state and during transient condition respectively.
Next, we calculate the annual energy savings achieved by the DWHR device. It is important to note that the cost of energy will vary depending on the type of water heater being used, whether it is electric or natural gas.
displays the effectiveness, energy recovery rate, and annual savings achieved by the DWHR device in both steady-state and transient conditions. Assuming an electric water heater, under fully steady-state conditions, the device yields an annual savings of $75.53. However, considering the likelihood of the device operating in the transient state, the annual savings decrease to $47.55, resulting in a reduction of 37% in annual savings. It is worth noting that these results are based on a three-occupant house, and the annual savings are expected to increase with a greater number of occupants.
. DWHR effectiveness, energy recovery rate, and annual savings for steady state and transient conditions.
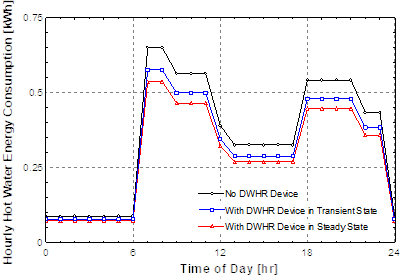
presents the hourly energy consumption of a high-efficiency electric water heater, comparing the scenarios with and without a DWHR device under both transient and steady-state conditions, considering the combined usage of the sink and shower. It is evident from the figure that the inclusion of a DWHR device leads to a reduction in energy consumption.
. Comparison of hourly energy consumption profiles for a water heater with and without a DWHR device.
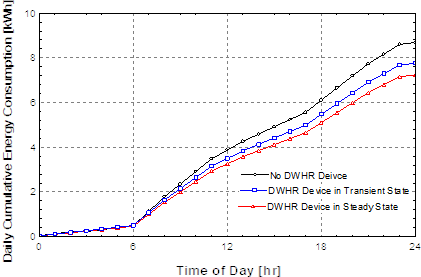
highlights that the highest potential for energy savings occurs during peak times when there is a greater frequency of hot water usage. Conversely, during hours with sparse hot water use, the energy savings are limited. The disparity in daily energy consumption between transient and steady state conditions is only 0.4 kWh. However, with a DWHR system operating under transient conditions, there is a daily energy savings of 1.2 kWh. This amounts to an annual savings of 438 kWh of energy.
. Cumulative daily energy consumption comparison of a water heater with and without a DWHR device under steady and transient operations.
6. Conclusions
In this study, experimental measurements were conducted to explore the transient characteristics of a DWHR device. The findings revealed that the response time of the device decreases as the flow rate increases. Additionally, the transient effectiveness during the initial 5 min at various flow rates was observed to be lower than the steady state effectiveness. An economic analysis demonstrated a significant reduction of 37% in annual savings, with the sink and shower experiencing the greatest decrease in savings. However, it should be noted that the DWHR device recovers more heat as the operating time increases. To further enhance the transient effectiveness of the DWHR device, future research endeavors could focus on minimizing thermal resistances within the device. By addressing these thermal resistances, the device’s performance during transient conditions can be improved.
Author Contributions
Conceptualization, M.H.S.; Methodology, M.H.S.; Formal Analysis, E.O. and M.H.S.; Investigation, E.O.; Resources, E.O.; Data Curation, E.O.; Writing – Original Draft Preparation, E.O.; Writing – Review & Editing, M.H.S.; Visualization, E.O.; Supervision, M.H.S.; Project Administration, M.H.S.; Funding Acquisition, M.H.S.
Ethics Statement
Not applicable.
Informed Consent Statement
Not applicable.
Funding
This research was funded by the Natural Sciences and Engineering Research Council of Canada (NSERC) grant number 401366.
Declaration of Competing Interest
The authors declare that they have no known competing financial interests or personal relationships that could have appeared to influence the work reported in this paper.
Nomenclature
a length of the helical coil tube cross-sectional, m
b width of the helical coil tube cross-sectional, m
c specific heat capacity, J/kg K
di drainpipe inner diameter, m
do drainpipe outer diameter, m
dhc helical coil diameter, m
dhd helical tube hydraulic diameter, m
L heat exchanger length, m
$$\dot{m}$$ mass flow rate, kg/s
$$\dot{Q}$$ heat transfer rate, W
T temperature, °C
Greek symbols
ε effectiveness
Subscripts
c cold water side
in inlet
max maximum
out outlet
ss steady state
tr transient
References
1.
Boretti A, Rosa L. Reassessing the projection of the World Water Development Report.
njp Clean Water 2019,
2, 15.
[Google Scholar]
5.
Wallin J, Claesson J. Investigating the efficiency of a vertical inline drain water heat recovery heat exchanger in a system boosted with a heat pump.
Energy Build. 2014,
80, 7–16.
[Google Scholar]
6.
Kordana S, Slys D. Analysis of profitability of using a heat recovery system from grey water discharged from the shower (case study of Poland).
ES3 Web Conf. 2017,
22, 85.
[Google Scholar]
7.
Zaloum C, Lafrance M, Gusdorf J. Drain Water Heat Recovery Characterization and Modeling; Sustainable Buildings and Communities Natural Resources Canada: Ottawa, ON, Canada, 2007.
8.
Aonghus M, Shields K. Efficient drain water heat recovery in horizontal domestic shower drains.
Energy Build. 2013,
59, 44–49.
[Google Scholar]
9.
Ravichandran A, Diaz-Elsayed N, Thomas S, Zhang Q. An assessment of the influence of local conditions on the economic and environmental sustainability of drain water heat recovery systems.
J. Clean. Prod. 2021,
279, 123589.
[Google Scholar]
10.
Spriet J, McNabola A. Decentralized Drain Water Heat Recovery: Interaction between Wastewater and Heating Flows on a Single Residence Scale.
Proceedings 2018,
2, 583.
[Google Scholar]
11.
Hadengue B, Joshi P, Figueroa A, Larsen TA, Blumensaat F. In-building heat recovery mitigates adverse temperature effects on biological wastewater treatment: A network-scale analysis of thermal-hydraulics in sewers.
Water Res. 2021,
204, 117552.
[Google Scholar]
15.
Salama M, Sharqawy MH. Experimental investigation of the performance of a falling-film drain water heat recovery system.
Appl. Therm. Eng. 2020,
179, 115712.
[Google Scholar]
16.
Manouchehri R, Collins MR. Investigating the Impact of Plumbing Configuration on Energy Savings for Falling-Film Drain Water Heat Recovery Systems.
Energies 2022,
15, 1141.
[Google Scholar]
17.
Beentjes I, Manouchehri R, Collins MR. An investigation of drain-side wetting on the performance of falling film drain water heat recovery systems.
Energy Build. 2014,
82, 660–667.
[Google Scholar]
18.
Askar S, Fotowat S, Fartaj A. Transient experimental investigation of airside heat transfer in a crossflow heat exchanger.
Appl. Therm. Eng. 2021,
199, 117516.
[Google Scholar]
19.
Gao T, Sammakia B, Geer J. Dynamic response and control analysis of cross flow heat exchangers under variable temperature and flow rate conditions.
Int. J. Heat Mass Transfer 2015,
81, 542–553.
[Google Scholar]
20.
Hendon R, Burch J. Development of Standardized Domestic Hot Water Event Schedules for Residential Buildings. In Proceedings of the Energy Sustainability 2007, Long Beach, CA, USA, 27–30 June 2007.
22.
ANSI/ASHRAE Standard. Section 8.9.4 Hourly Domestic Hot Water Fraction. In Energy Efficient Design of Low-Rise Residential Buildings; American Society of Heating, Refrigerating and Air Conditioning Engineers: Peachtree Corners, GA, USA, 1993; pp. 53–54.