1. Introduction
Since the early years of the emergence of the science of Remote Sensing, one of the main procedures of processing satellite images was image fusion, which is still studied today. Methodological image fusion procedures allow e.g., to improve the spatial resolution of multispectral (MS) images by exploiting the panchromatic (PAN) image of better spa-tial resolution while trying to preserve to a large extent the spectral information of the original MS image [
1,
2,
3,
4,
5,
6,
7,
8,
9,
10,
11,
12,
13,
14,
15,
16,
17,
18,
19] in the new fused image.
The main spatial resolution ratio in PAN and MS satellite images of the same satellite system is 1/4, i.e., for spatial resolution Am in the MS image the spatial resolution of the PAN image is A/4m. In the literature, one can find countless image fusion papers with these ratios [
9,
10,
11].
Secondarily, other image spatial resolution ratios are also exploited, for example, 1/3 and 1/60, mainly by fusing images from different satellite systems [
12,
13,
14].
In the case of cameras used in unmanned aerial vehicles (UAV), the spatial resolution ratios between the color (RGB) sensor (R: Red, G: Green, B: Blue) and the MS sensor (e.g., Parrot Sequoia+, Sentera Quad Multispectral Sensor, Sentera AGX710, Sentera 6X Multispectral Sensor, Slantrange 4P+, Sentek systems GEMS, MicaSense-RedEdge, etc) are mainly 1/4 and 1/3 (until a few months ago no UAV camera had a PAN sensor).
In a previous paper [
20], RGB and MS images of the same camera for UAV, the Sequoia+ (by Parrot), were fused in order to improve the spatial resolution of the MS image and thus improve the classification accuracy by exploiting the fused image. For the same reasons, in this paper, images from different cameras for UAV will be fused.
As in the previous paper [
20], the same question could be asked here: when the flight height of UAVs is so small (a few meters or tens of meters), therefore a very good spatial resolution is already available in the MS image, why is it necessary to improve the spatial resolution of the MS image? First of all, an answer can be given if one considers the shift of major manufacturers of multispectral cameras for UAVs, such as MicaSense (RedEdge-P camera with a high-resolution panchromatic band), towards the creation of new cameras for UAVs which have (in addition to the MS sensor) also a PAN sensor, and have as the main argument the possibility to improve the spatial resolution of the MS image.
However, before the above image fusion is performed, the horizontal and vertical accuracy of the generated products will be determined using Ground Control Points (GCPs) and Check Points (CPs), and the changes of these accuracies with a 50% increase (or decrease) of the UAV’s flight height will be determined. The cameras to be utilized are the Phantom 4’s 1/2.3" CMOS 12.4Mp RGB camera 1/2.3" and the MS+RBG camera Sequoia+ (by Parrot), while the study area is the Early Christian Basilica C of the Amphipolis archaeological site (Eastern Macedonia, Greece, ).
. Greece in Europe and the location of Ancient Amphipolis in the Greek territory.
2. Study Area
The Early Christian Basilica C is located in the acropolis of ancient Amphipolis ( and ), at an altitude of ~120 m, dating back to the 6th century AD and came to light after excavations carried out in the 1960s and 1970s. It con-sists of the main temple measuring ~28×18 m () and the three aisles, which were separated by two colonnades of six columns each. In the eastern part of the temple, there is a niche (semicircular arch) with a radius of ~6.5 m. In the western part of the temple and perpendicular to the aisles is the narthex, whose dimensions are ~16.5×4 m, while in the southern part of the temple there is the atrium. It is worth noting that magnificent mosaics were found on the floor of the narthex and in the three aisles. Roman buildings were discovered to the west and south of the temple, and it is suspect-ed that much of the western buildings lie beneath Basilica C [
21,
22,
23].
. On the left, the wider area of ancient Amphipolis: in light gray the contour curves (relief), in dark gray the modern road network, in black the walls of the ancient city and in red in the center of the left figure the position of Early Christian Basilica III. Right the MS orthophoto mosaic from Sequoia+ (bands: G, R, Near-infrared-NIR) of the Early Christian Basilica III and the adjacent Roman buildings.
. Panoramic photography of the study area. Location of the ground shot from the path in the eastern part of the right image of . Among other things, the elevation differences are also evident (relief).
3. Equipment
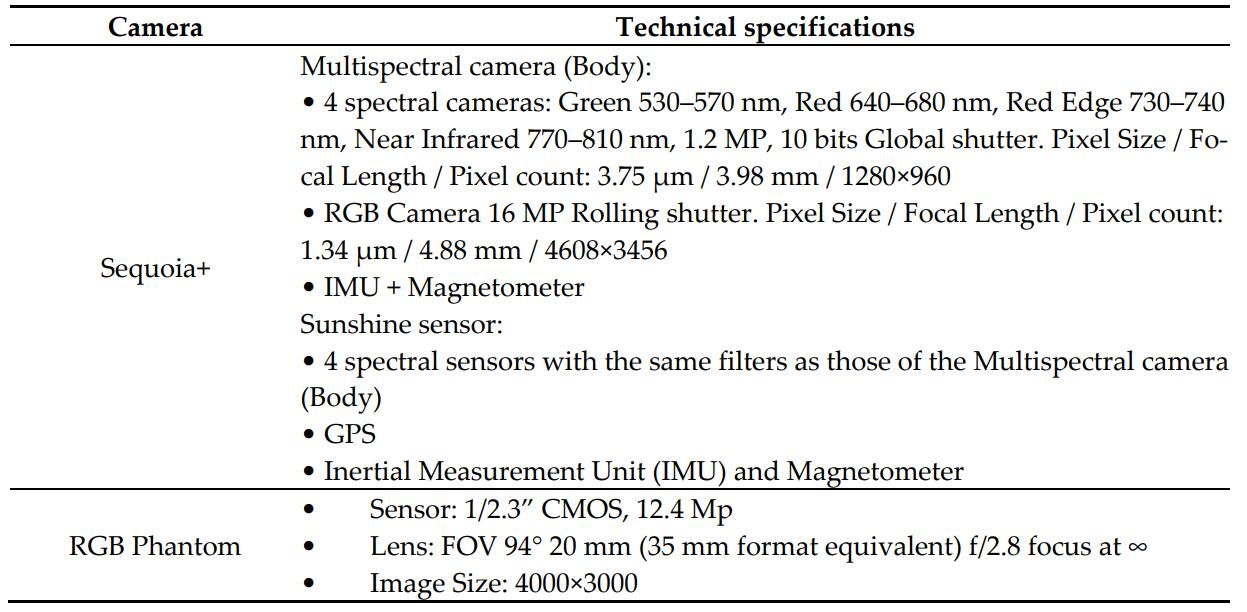
The Phantom 4 was used for mapping, which is equipped with the RGB camera 1/2.3" CMOS 12.4Mp (from now on the camera will be called RGB Phantom). The Sequoia+ camera (by Parrot) was also mounted on the UAV at the same time. The main characteristics of the two cameras are presented in .
. The characteristics of the cameras.
For the measurement of X, Y, Z on the Greek Geodetic Reference System 1987 (GGRS87) of 18 GCPs and 20 CPs (), paper targets () of 24×24 cm and the GPS Topcon Hiper SR (RTK: 10 mm horizontal accuracy and 15 mm vertical accuracy) were used.
. Distribution of GCPs (symbol: triangle) and CPs (symbol: circle) (Sequoia+ MS orthophoto mosaic background, bands: G, R, NIR).
. RGB Phantom image excerpt. On the left, the mosaic of the through of the temple, part of which will be depicted in the chapter of the production of the fused image. On the right, the paper targets of GCPs and CPs measuring 24×24 cm.
4. Flight Planning
The flight took place on 21/02/2022 from 11:00 am – 12:30 pm, with a ground temperature of 14oC and no cloud cover. Flight heights were 30 m and 45 m, and flight speed was the minimum (~2 m/s). The autopilot was set to cover a larger area than the study area to ensure no mapping gaps. From the set of strips and images captured by both cameras, specific information (less than the available information) was utilized, but it overlapped the study area. The images overlay ορίστηκαν 80% forward and 80% side for the RGB Phantom. For Sequoia+, 80% forward overlap was calculated and introduced with time laps in the camera software. As can be observed in , the images (RGB or MS) of Sequoia+ cover ~85% of the surface area of the RGB Phantom images. This results in a constant side overlay of 80% of the RGB Phantom images resulting in ~65% or ~80% side overlay on the Sequoia+ images (sufficiently good overlay rates for the processing of the Sequoia+ images). This is the reason why in the case of Sequoia+ and for a flight height of 45 m, an additional strip of images was exploited, so that the study area has no mapping gaps (the same is not true in the case of the 30 m flight height, where the same number of strips covered the study area without mapping gaps for both cameras). Thus, for 30 m flight height 5 strips with a total of 30 images were used for both RGB Phantom and Sequoia+ (RGB or MS), while at 45 m 2 strips with a total of 10 images were used for RGB Phantom and 3 strips with a total of 13 images (RGB or MS) for Sequoia+.
. Two images with flight directions from south to north. On the left, the RGB image of the RGB Phantom. In the yellow frame the surface covered by the images (RGB or MS) of Sequoia+. On the right, the Green band of the MS image of Sequoia+.
5. Image Processing
*5.1. Production and Control of Orthophoto Mosaics και DSMs*
The data radiometric quality of MS cameras for UAV is still uncertain and for that, it is necessary to calibrate spectral information with spectral targets. The reflectance response of the spectral targets is calculated in situ with a spectrometer [
24,
25,
26,
27,
28,
29,
30,
31,
32]. In this paper, a spectrometer was not available and therefore shortly before the end of the images, the suitable calibration target of the Sequoia was imaged [
26,
27,
28,
29,
30,
31,
32,
33]. Target was automatically detected by the Agisoft Metashepe
© and was calculated the reflectance values of the green, red, red-edge, and NIR spectral bands.
The Agisoft Metashape
© was utilized to produce the Digital Surface Models (DSMs) and orthophoto mosaics of both cameras, for both flight heights ( and ). The cameras used in this paper are column-parallel readout circuits, which operate with line memories that are produced by the simultaneous readout of all pixels in a row. The readout is conducted from top to bottom and row-by-row (rolling shutter). A setback of this process is that pixels in different rows are exposed to light at different times causing skew and other image problems, especially for moving objects, subsequently decreasing image quality [
34,
35,
36,
37,
38,
39]. Thus, to minimize these errors, during the above image processing, the “Enable rolling shutter compensation” option/command was enabled in the software. Using the 18 GCPs on all image blocks the results of the processing are presented in .
. (a) DSM and (b) RGB orthophoto mosaic of RGB Phantom, 30 m flight height; (c) DSM and (d) RGB orthophoto mosaic of RGB Phantom, 45m flight height; (e) DSM and (f) MS orthophoto mosaic (bands: G, R, NIR) of Sequoia+, 30m flight height).
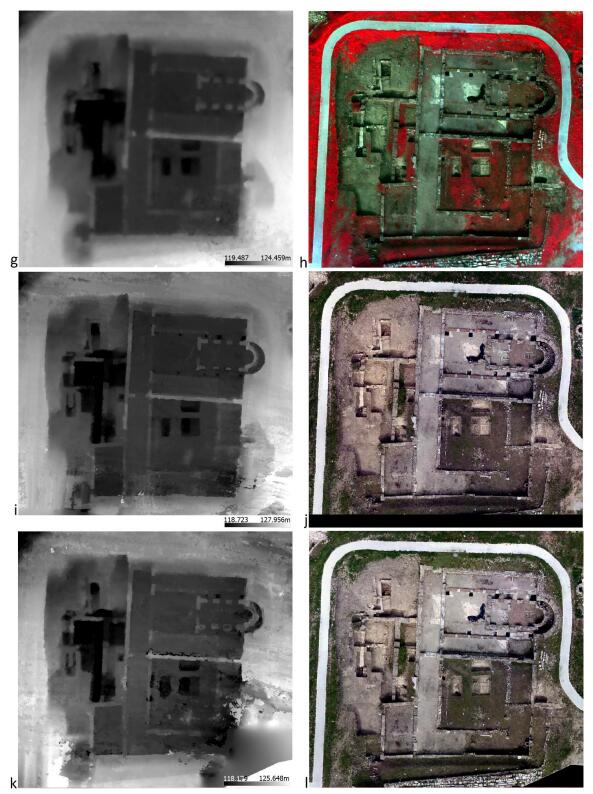
. (g) DSM and (h) MS orthophoto mosaic (bands: G, R, NIR) of Sequoia+, 45 m flight height; (i) DSM and (j) RGB ortho-photo mosaic of Sequoia+, 30 m flight height; (k) DSM and (l) RGB orthophoto mosaic of Sequoia+, 45 m flight height.
. Results of processing in Agisoft Metashape©.
The DSMs and the corresponding generated orthophoto mosaics for both flight heights were then exploited to manually (using ArcMap
©) extract the coordinates (X’, Y’, and Z’) of the CPs. This then allowed their comparison with the X, Y, and Z coordinate values of the corresponding CPs measured by GPS in the field. Thus, on the one hand, it was determined whether the final products were accompanied by systematic or random errors (–) and, on the other hand, the mean values and standard deviations of the differences ΔX, ΔY, and ΔZ ( and ) were calculated for both flight heights.
. ANOVA. Comparison of Χ and Χ’, Υ and Υ’, Ζ and Ζ’ of CPs for the RGB Phantom, flight height 30 m.
. ANOVA. Comparison of Χ and Χ’, Υ and Υ’, Ζ and Ζ’ of CPs for the RGB Phantom, flight height 45 m.
. ANOVA. Comparison of Χ and Χ’, Υ and Υ’, Ζ and Ζ’ of CPs MS Sequoia+, flight height 30 m.
. ANOVA. Comparison of Χ and Χ’, Υ and Υ’, Ζ and Ζ’ of CPs MS Sequoia+, flight height 45 m.
. ANOVA. Comparison of Χ and Χ’, Υ and Υ’, Ζ and Ζ’ of CPs RGB Sequoia+, flight height 30 m.
. ANOVA. Comparison of Χ and Χ’, Υ and Υ’, Ζ and Ζ’ of CPs RGB Sequoia+, flight height 45 m.
. Average values and Standard deviations των CPs for both flight heights.
. The graph of Average values and Standard deviations of the CPs for both flight heights.
*5.2. Production and Control Fused Image*
The Phantom 4 does not include a PAN sensor and for that following the satellite image processing procedures where the satellites are equipped with a PAN sensor and utilize it in image fusion realization, the RGB orthophoto mo-saic of the RGB Phantom (flight height 30 m) was transformed into a Pseudo-Panchromatic (PPAN) orthophoto mosaic ( and ) [
40,
41].
The transformation resulted in a black and white image where the intensity value of each pixel is the average value of the corresponding pixels’ intensities of the R, G and B bands. It is obvious that there are spectral differences between the PPAN image and the PAN image of a sensor, which is sensitive to the spectrum’s visible area. Until now, the human optimal visual perception of B/W images was the key in transformation techniques of RGB images into B/W images, in contrast to real PAN images’ spectral approach.
Subsequently, the histogram of the PPAN orthophoto mosaic was adjusted to the histogram of the MS orthophoto mosaic from Sequoia+ (flight height 30 m). The fused image ( and ) was created using Principal Component Analysis (PCA) technique. In terms of the output produced, any fused image B*h should be as identical as possible to the image Bh that the corresponding sensor would observe with the highest resolution h, if existent. So, the correlation table () of the original MS orthophoto mosaic with fused image revealed the retention rate of the original spectral information (which should be >90%, i.e., >+0.9) [
46,
47,
48,
49,
50] (other two techniques, Multiplacative and Brovey Transform, have also been used [
49,
50,
51,
52,
53], which did not give better results in the retention of spectral information, and therefore are not analyzed in the paper).
. Excerpt of the mosaic of the through of . (a) Excerpt of RGB Phantom's RGB orthophoto mosaic; (b) Excerpt of the PPAN image of RGB Phantom; (c) Excerpt of the MS orthophoto mosaic (bands: R, RedEdge, NIR) of Sequoia+; (d) Ex-cerpt of the fused image (PCA2: R, PCA3: RedEdge, PCA4: NIR).
. Mosaic excerpt of the nave. (a) Excerpt of RGB Phantom's RGB orthophoto mosaic; (b) Excerpt of the PPAN image of RGB Phantom; (c) Excerpt of the MS orthophoto mosaic (bands: R, RedEdge, NIR) of Sequoia+; (d) Excerpt of the fused image (PCA2: R, PCA3: RedEdge, PCA4: NIR).
6. Discussion
Starting with the comparison of d and d with the corresponding e and e, the need to improve the spatial resolution of the MS images of cameras for UAVs, collected even from a low flight height (e.g., 30 m), is evident. This is also in line with the current trend of major manufacturers of cameras for UAVs to proceed with the addition of PAN sensors to existing MS cameras, thus enabling the production of fused images.
According to the correlation table (), the original spectral information of the MS orthophoto mosaic is preserved in the fused image. Its spatial resolution (0.028 m) is improved twice in the fused image (0.012 m). By performing unsupervised classifications, I demonstrate not only the improvement of classification using the fused image (compared to the classification of the original MS orthophoto mosaic), by simply comparing b and b with d and d respectively, but also the ability to optimally observe and discern the thematic information contained in the fused images on the one hand and in their products on the other hand (e.g., classification images) (c,d and c,d).
. (a) Excerpt of MS orthophoto mosaic (bands: R, RedEdge, NIR) of Sequoia+ of the splint’s mosaic; (b) the classification image of (a); (c) excerpt of the fused image (PCA2: R, PCA3: RedEdge, PCA4: NIR); (d) the classification image (c).
. (a) Excerpt of MS orthophoto mosaic (bands: R, RedEdge, NIR) of Sequoia+ of the nave’s mosaic; (b) the classification image of (a); (c) excerpt of the fused image (PCA2: R, PCA3: RedEdge, PCA4: NIR); (d) the classification image (c).
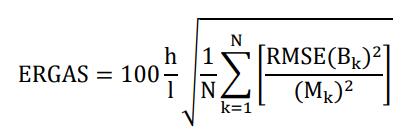
In addition, the ERGAS index (Erreur Relative Globale Adimensionnelle de Synthese or Relative Adimensional Global Error in Synthesis) was used to compare the fused with the MS image, as it can measure the spectral difference between two images [
54,
55].
Equation (1) of ERGAS is given as:
where «h» is the spatial resolution of the high-resolution (fused image) images, «I» is the spatial resolution of the low-resolution (MS) images, «N» denotes the number of spectral bands and «k» denotes the index of each band. The RMSE for the «k» band between the fused and the MS image is shown through RMSE (Bk). In the reference image, «Mk» represents the mean of the k-band.
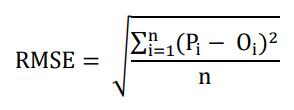
To begin with, values for each spectral band («Pi» for MS and «Oi» for fused images) were gathered after the selec-tion of random pixels (number of pixels: «n») at the same coordinates of images. This was followed by the calculation of RMSE for each spectral band, according to Equation (2).
Finally, the result of the ERGAS index is, in the case of (a and c), equal to 0.4 and in the case of (a and c) equal to 0.6, which proves that the fused images are of much better quality than the original MS images, as the total ERGAS error is quite small (generally it should be <3 and the bigger the ERGAS error, the worse the spectral quality of the image under study is).
Utilizing the same 18 GPPs across all image blocks, it was found for both RGB Phantom and MS Sequoia+ that the root means square error (RMSE) of the processing in Agisoft Metashepe
© is degraded by ~45% with a simultaneous increase of 50% in flight height (). In the case of RGB Sequoia+, the RMSE is degraded by ~130% with a 50% in-crease in flight height. Also, shows that the RMSE of RGB Sequoia+ is downgraded by ~450% relative to the RMSE of RGB Phantom at the corresponding heights. Finally, the improved RMSEs observed in MS Sequoia+ relative to RGB Phantom at the corresponding flight heights cannot be interpreted and therefore may be due to chance observation (as the spatial resolution of the RGB Phantom images is much better than the MS Sequoia+ images).
For the 20 CPs that have not taken part in the processing of the image blocks in Agisoft Metashepe
© and are exclu-sively exploited for the actual control of the final products (DSMs and orthophoto mosaics), their X’, Y’, and Z’ values in the final products were calculated and then compared with their actual X, Y and Z values measured in the field.
The Analysis of Variance AVONA applied, performs hypothesis testing to determine differences in the mean values of different data sets. In the paper, the null hypothesis H0 is that all samples come from two different data sets (X’ and X, Y’ and Y, Z’ and Z) with the same mean value. The alternative hypothesis HA is that at least their mean values are different. According to to , for all the datasets X and X’, Y and Y’, Z and Z’, the obtained P-values are much larger than 0.05, which means that the null hypothesis H0 is universally valid. Therefore, for a confidence level of 95%, there is no significant difference/systematic error between the mean values derived from the X’ (or Y’ or Z’) of the products and the actual mean values of X (or Y, or Z respectively) measured in the field. Thus, any differences between them are con-sidered negligible and are attributed to random errors. Also, the values of the test statistic F are less than the critical values (F crit) and therefore the standard deviations between the values of X’ (or Y’ or Z’) and X (or Y or Z respectively) do not differ significantly, so that the measurements (field and products) are accompanied only by random errors.
According to and , it can be seen that increasing the flight height by 50% has a little (negative) effect on the accuracy of the final products with respect to the X values, both in the case of the RGB Phantom and in the case of MS Sequoia+. However, the same is not the case for RGB Sequoia+, where increasing the flight height by 50% degrades the accuracy of the X values by ~20%.
As for the Y and Z values in the final products, increasing the flight height by 50% degrades their accuracy by ~40% in the case of either RBG Phantom or MS Sequoia+, and by ~80% in the case of RGB Sequoia+.
Finally, the best accuracies (on all 3 axes) are observed by far in the RBG Phantom products (compared to the RGB Sequoia+). For both the RBG Phantom and MS Sequoia+ products, the accuracies are better overall in the 30 m flight height case (compared to 45 m). For this reason, the RGB orthophoto mosaic of the RGB Phantom at 30 m was exploited to produce the PPAN image, and the MS Sequoia+ at 30 m was exploited to produce the fused image.
7. Conclusions
As the observations are not accompanied by systematic errors, some general conclusions are drawn. They remain to be confirmed in the future with additional observations and with flights that can be made at the same and/or higher altitudes. The accuracies of the final products are degraded by a percentage less than the percentage increase in flight height in the case of either the RGB Phantom or the MS Sequoia+. Specifically, a 50% increase in flight height results in a ~35% degradation in the horizontal and vertical accuracy of the products. In the case of RGB Sequoia+, a 50% increase in flight height results in a ~65% degradation of the horizontal and vertical accuracy of the products. Also, the vertical ac-curacy is degraded ~2 times compared to the horizontal accuracy, both in the case of the RGB Phantom products and in the case of the RGB Sequoia+ products, for both flight heights. The vertical accuracy is degraded ~3 times relative to the horizontal accuracy in the case of MS Sequoia+ products, for both flight heights.
The need for image fusion to improve the spatial resolution of the MS camera image used in UAVs is also con-firmed in this paper. This can be accomplished either by using the RGB image of the same camera that provides the MS image [
33], or by using the RGB image of a different camera than the one providing the MS image. The original spectral information can be preserved to a satisfactory degree, thus offering the possibility of optimal discrimination of thematic information in the fused image. Combined, therefore, high measurement and thematic content can be ensured.
Acknowledgments
Special thanks to the chief of the Ephorate of Antiquities of Serres, Mrs. D. Malamidou, for the permission granted to me to carry out the topographical measurements and take images in the archaeological site of Amphipolis.
Ethics Statement
Not applicable.
Informed Consent Statement
Not applicable.
Funding
This research received no external funding.
Declaration of Competing Interest
The author declares that he has no known competing financial interests or personal relationships that could have appeared to influence the work reported in this paper.
References
1.
Panda, C.B. Remote Sensing. Principles and Applications in Remote Sensing, 1st ed.; Publisher: Viva Books, New Delhi, India, 1995; pp. 234–267.
2.
Schowengerdt, R.A. Remote Sensing: Models and Methods for Image Processing, 2nd ed.; Publisher: Academic Press, Orlando, FL, USA, 1997.
3.
Bethune, S.; Muller, F.; Donnay, P.J. Fusion of multi-spectral and panchromatic images by local mean and variance matching filtering techniques. In Proceedings of the Second International Conference en Fusion of Earth Data, Nice, France, 28–30 January 1998; pp. 31–36.
4.
Wald, L. Some terms of reference in data fusion.
IEEE Trans. Geosci. Remote Sens. 1999,
37, 1190–1193.
[Google Scholar]
5.
Gonzalez, R.; Woods, R. Digital Image Processing, 2nd ed.; Publisher: Prentice Hall, Upper Saddle River, NJ, USA, 2002.
6.
Choodarathnakara, L.A.; Ashok Kumar, T.; Koliwad, S.; Patil, G.C. Assessment of different fusion methods applied to remote sensing imagery.
Int. J. Comput. Sci. Inf. Technol. 2012,
3, 5447–5453.
[Google Scholar]
7.
Fonseca, L.; Namikawa, L.; Castejon, E.; Carvalho, L.; Pinho, C.; Pagamisse, A. Image Fusion for Remote Sensing Applications. In Image Fusion and Its Applications, 1st ed.; Publisher: IntechOpen, Rijeka, Croatia, 2011; pp. 153–178.
8.
Shi, W.; Zhu, C.; Tian, Y.; Nichol, J. Wavelet-based image fusion and quality assessment.
Int. J. Appl. Earth Obs. Geoinf. 2005,
6, 241–251.
[Google Scholar]
9.
Zhang, H.K.; Huang, B. A new look at image fusion methods from a Bayesian perspective
Remote Sens. 2015,
7, 6828–6861.
[Google Scholar]
10.
Helmy, A.K.; El-Tawel, G.S. An integrated scheme to improve pan-sharpening visual quality of satellite images.
Egypt. Inf. J. 2015,
16, 121–131.
[Google Scholar]
11.
Jelének, J.; Kopacková, V.; Koucká, L.; Mišurec, J. Testing a modified PCA-based sharpening approach for image fusion.
Remote Sens. 2016,
8, 794.
[Google Scholar]
12.
Chavez, P.S.; Sides, S.C.; Anderson, J.A. Comparison of three different methods to merge multiresolution and multispectral data: Landsat TM and SPOT Panchromatic.
Photogramm. Eng. Remote Sens. 1991,
57, 295–303.
[Google Scholar]
13.
Fryskowska, A.; Wojtkowska, M.; Delis, P.; Grochala, A. Some Aspects of Satellite Imagery Integration from EROS B and LANDSAT 8. In Proceedings of the International Archives of the Photogrammetry, Remote Sensing and Spatial Information Sciences, Prague, Czech Republic, 12–19 July 2016; pp. 647–652.
14.
Grochala, A.; Kedzierski, M. A Method of Panchromatic Image Modification for Satellite Imagery Data Fusion.
Remote Sens. 2017,
9, 639.
[Google Scholar]
15.
Pohl, C.; Van Genderen, J.L. Multisensor image fusion in remote sensing: Concepts, methods and applications.
Int. J. Remote Sens. 1998,
19, 823–854.
[Google Scholar]
16.
Aiazzi, B.; Baronti, S.; Selva, M. Improving component substitution pansharpening through multivariate regression of MS + Pan data.
IEEE Trans. Geosci. Remote Sens. 2007,
45, 3230–3239.
[Google Scholar]
17.
Erdogan, M.; Maras, H.H.; Yilmaz, A.; Özerbil, T.Ö. Resolution merge of 1:35000 scale aerial photographs with Landsat 7 ETM imagery. In Proceedings of the International Archives of the Photogrammetry, Remote Sensing and Spatial Information Sciences, Beijing, China, 3–11 July 2008; Volume XXXVII, Part B7; pp. 1281–1286.
18.
Stabile, M.; Odeh, I.; McBratney, A. Fusion of high-resolution aerial orthophoto with Landsat TM image for improved object-based land-use classification. In Proceedings of the 30th Asian Conference on Remote Sensing 2009 (ACRS 2009), Beijing, China, 18–23 October 2009; pp. 114–119.
19.
Siok, K.; Jenerowicz, A.; Woroszkiewicz, M. Enhancement of spectral quality of archival aerial photographs using satellite imagery for detection of land cover.
J. Appl. Remote Sens. 2017,
11, 036001.
[Google Scholar]
20.
Kaimaris, D.; Kandylas, A. Small Multispectral UAV Sensor and Its Image Fusion Capability in Cultural Heritage Applications.
Heritage 2020,
3, 1046–1062.
[Google Scholar]
21.
Iliades, Y. The orientation of Byzantine Churches in eastern Macedonia and Thrace.
Mediterr. Archaeol. Archaeom. 2006,
6, 209–214.
[Google Scholar]
22.
Vakataris N.K. The architecture in Macedonia from the 4th to the 8th century. Master Thesis, School of Theology, Department of Pastoral and Social Theology, Aristotle University of Thessaloniki, 2010.
23.
Papaeconomou, C.E. Study-Restoration and enhancement proposal of the early Christian basilica of New Pella. Master Thesis, Protection Conservation Restoration of Cultural Monuments, Aristotle University of Thessaloniki, 2016.
24.
Aasen, H.; Honkavaara, E.; Lucieer, A.; Zarco-Tejada P.J. Quantitative remote sensing at ultra-high resolution with UAV spectroscopy: A review of sensor technology, measurement procedures, and data correction workflows.
Remote Sens. 2018,
10, 1091.
[Google Scholar]
25.
Borgogno, M.E.; Gajetti, M. Preliminary considerations about costs and potential market of remote sensing from UAV in the Italian viticulture context.
Eur. J. Remote Sens. 2017,
50, 310–319.
[Google Scholar]
26.
Franzini, M.; Ronchetti, G.; Sona, G.; Casella, V. Geometric and radiometric consistency of parrot sequoia multispectral imagery for precision agriculture applications.
Appl. Sci. 2019,
9, 3–24.
[Google Scholar]
27.
Ahmed, O.S.; Shemrock, A.; Chabot, D.; Dillon, C.; Williams, G.; Wasson, R.; Franklin, S.E. Hierar-chicalland cover and vegetation classification using multispectral data acquired from an unmanned aerial vehicle.
Remote Sens. 2017,
38, 2037–2052.
[Google Scholar]
28.
Miyoshi, G.T.; Imai, N.N.; Tommaselli, A.M.G.; Honkavaara, E.; Näsi, R.; Moriya, E.A.S. Radio-metric block adjustment of hyperspectral image blocks in the Brazilian environment.
Int. J. Remote Sens. 2018,
39, 4910–4930.
[Google Scholar]
29.
Guo, Y.; J. Senthilnath, W.; Wu, Zhang, X.; Zeng, Z.; Huang. H. Radiometric calibration for multi-spectral camera of different imaging conditions mounted on a UAV platform.
Sustainability 2019,
11, 978.
[Google Scholar]
30.
Mafanya, M.; Tsele, P.; Botai, J.O.; Manyama, P.; Chirima, G.J.; Monate, T. Radiometric calibration framework for ultra-high-resolution UAV-derived orthomosaics for large-scale mapping of invasive alien plants in semi-arid woodlands: Harrisia pomanensis as a case study.
Int. J. Remote Sens. 2018,
39, 5119–5140.
[Google Scholar]
31.
Johansen, K.; Raharjo, T. Multi-temporal assessment of lychee tree crop structure using multi-spec-tralRPAS imagery.
Int. Arch. Photogramm. Remote Sens. Spatial Inf. Sci. 2017,
42, 165–170.
[Google Scholar]
32.
Honkavaara, E.; Khoramshahi, E. Radiometric correction of close-range spectral image blocks captured using an unmanned aerial vehicle with a radiometric block adjustment.
Remote Sens. 2018,
10, 256.
[Google Scholar]
33.
Assmann, J.J., Kerby, T.J., Cunliffe, M.A.; Myers-Smith, H.I. Vegetation monitoring using multispectral sensors - best practices and lessons learned from high latitudes.
J. Unmanned Veh. Syst. 2019,
7, 54–75.
[Google Scholar]
34.
Fraser, B.T.; Congalton, R.G. Issues in Unmanned Aerial Systems (UAS) data collection of complex forest environments.
Remote Sens. 2018,
10, 1–21.
[Google Scholar]
35.
Jinwei, G.; Yasunobu, H. Coded rolling shutter photography: Flexible space-time sampling. In Proceedings of the IEEE International Conference on Computational Photography (ICCP), Cambridge, MA, USA, 29–30 March 2010; pp. 1–8.
36.
Zhihang, Z.; Yinqiang, Z.; Imari, S. Towards Rolling Shutter Correction and Deblurring in Dynamic Scenes. In Proceedings of the IEEE/CVF Conference on Computer Vision and Pattern Recognition (CVPR), Nashville, TN, USA, 20–25 June 2021; pp. 9219–9228.
37.
Bradley, D.; Atcheson, B.; Ihrke, I.; Heidrich, W. Synchronization and rolling shutter compensation for consumer video camera arrays. In Proceedings of the IEEE International Workshop on Projector-Camera Systems (PROCAMS), Miami, FL, USA, 20–25 June 2009
38.
Geyer, C.; Meingast, M.; Sastry, S. Geometric models of rollingshutter cameras. In Proceedings of the IEEE Workshop on Omnidirectional Vision Camera Networks and Non-Classical Cameras, Beijing, China, 21 October 2005; pp. 12–19.
39.
Liang, C.K.; Chang, L.W.; Chen, H.H. Analysis and compensation of rolling shutter effect.
IEEE Trans. Image Process. 2008,
17, 1323–1330.
[Google Scholar]
40.
González-Audícana, M.; Saleta, J.L.; Catalán, G.R.; García, R. Fusion of multispectral and panchromatic images using improved IHS and PCA mergers based on wavelet decomposition.
IEEE Trans. Geosci. Remote Sens. 2004,
42, 1291–1299.
[Google Scholar]
41.
Choi, J.; Yu, K.; Kim, Y. A new adaptive component-substitution-based satellite image fusion by using partial replacement.
IEEE Trans. Geosci. Remote Sens. 2011,
49, 295–309.
[Google Scholar]
42.
Kumar, T.; Verma, K. A theory based on conversion of RGB image to Gray image.
Int. J. Comput. Appl. 2010,
7, 7–10.
[Google Scholar]
43.
Pramod Kaler, P. Study of grayscale image in image processing.
Int. J. Recent Innov. Trends Comput. Commun. 2016,
4, 309–311.
[Google Scholar]
44.
Azzeh, A.L.J.; Alhatamleh, H.; Alqadi, A.Z.; Abuzalata, K.M. Creating a color map to be used to convert a gray image to color image.
Int. J. Comput. Appl. 2016,
153, 31–34.
[Google Scholar]
45.
Queiroz, L.R.; Braun, M.K. Color to gray and back: Color embedding into textured gray images.
IEEE Trans. Image Process. 2006,
15, 1464–1470.
[Google Scholar]
46.
Wald, L.; Ranchin, T.; Mangolini, M. Fusion of satellite images of different spatial resolutions: Assessing the quality of resulting images.
Photogramm. Eng. Remote Sens. 1997,
63, 691–699.
[Google Scholar]
47.
Ranchin, T.; Aiazzi, B.; Alparone, L.; Baronti, S.; Wald, L. Image fusion-The ARSIS concept and some successful implementation schemes.
ISPRS J. Photogramm. Remote Sens. 2003,
58, 4–18.
[Google Scholar]
48.
Otazu, X.; González-Audícana, M.; Fors, O.; Núñez, J. Introduction of sensor spectral response into image fusion methods-application to wavelet-based methods.
IEEE Trans. Geosci. Remote Sens. 2005,
43, 2376–2385.
[Google Scholar]
49.
Liu, J.G. Smoothing filter-based intensity modulation: A spectral preserve image fusion technique for improving spatial details.
Int. J. Remote Sens. 2000,
21, 3461–3472.
[Google Scholar]
50.
Wang, Z.; Ziou, D.; Armenakis, C. A comparative analysis of image fusion methods.
IEEE Trans. Geosci. Remote Sens. 2005,
43, 1391–1402.
[Google Scholar]
51.
Helmy, A.K.; Nasr, H.A.; El-Taweel, S.G. Assessment and evaluation of different data fusion techniques.
Int. J. Comput. 2010,
4, 107–115.
[Google Scholar]
52.
Susheela, D.; Pradeep, K.G.; Mahesh, K.J. A comparative study of various pixel based image fusion techniques as applied to an urban environment.
Int. J. Image Data Fusion 2013,
4, 197–213.
[Google Scholar]
53.
Jong-Song, J.; Jong-Hun, C. Application effect analysis of image fusion methods for extraction of shoreline in coastal zone using Landsat ETM+.
Atmos. Ocean. Sci. 2017,
1, 1–6.
[Google Scholar]
54.
Wald, L. Data Fusion. Definitions and Architectures-Fusion of Images of Diferent Spatial Resolutions; Presses del’Ecole, Ecole de Mines de Paris: Paris, France, 2002.
55.
Gao, F.; Li, B.; Xu, Q.; Zhong, C. Moving vehicle information extraction from single-pass worldview-2 imagery based on ERGAS-SNS analysis.
Remote Sens. 2014,
6, 6500–6523.
[Google Scholar]