Over the last four decades, lithium-ion batteries (LIBs) have emerged as the most successful power sources for various portable devices [
1] and electric vehicles (EVs) [
2]. Automotive LIB demand continues to riseg by about 65% to 550 GWh in 2022. By 2030, electricity demand for EVs will account for ~3.8% of global final electricity consumption [
3]. One of the ongoing challenges in the field of EVs is the need to enhance the energy density, providing longer driving ranges, and improve the safety of lithium-ion batteries (LIBs). Optimizing the positive electrode material, specifically the cathode, is key to achieving these objectives. [
4]. In particular, the pioneering work on LiMn
2O
4 was conducted by John B. Goodenough, K.M. Abraham, and coworkers, including M. M. Thackeray, in 1984. Their research laid the foundation for the understanding and developing spinel LiMn
2O
4 as a cathode material for LIBs [
5]. LiMn
2O
4 has a moderate theoretical specific capacity of 148 mAh g
−1, high working voltage (~4 V vs. Li
+/Li), low cost, low toxicity, and high thermal stability/high safety [
6,
7]. LiMn
2O
4 was synthesized by facile synthesis methods such as sol-gel and solid-state, which improved its properties in terms of loading capacity and high rate capability during cycling due to the high purity and optimized morphology of the synthesized particles [
8]. However, LiMn
2O
4 still faces challenges, particularly in terms of cycle stability and discharge-specific capacity, especially at high temperatures. These limitations can hinder its large-scale application, particularly in demanding conditions. Improving the overall performance and durability of LiMn
2O
4 cathodes is crucial for expanding their applicability in diverse energy storage applications.
Spinel LiMn
2O
4 has a three-dimensional (3D) cubic structure with $$Fd\bar{3}m$$ space group (s.g.), facilitating easy lithium-ion diffusion [
9]. The practical, specific capacities observed for LiMn
2O
4 in the 4-V operating potential range typically fall between 80–120 mAh g
−1. This is notably lower than its theoretical capacity of 148 mAh g
−1 [
10]. The difference between the theoretical and practical capacities is often attributed to various factors, including side reactions and structural changes. The poor cycling stability, as mentioned, was attributed to a combination of structural transformation and Mn dissolution driven by the disproportionation reaction of Mn
3+ and Jahn-Teller (J-T) distortion. Above 3 V, further lithiation of the LiMn
2O
4 host lattice is achieved through Li insertion into octahedral vacancies [
11] to form the over-lithiated Li
2Mn
2O
4 compound with an increasing discharge capacity. Over-lithiation typically involves reducing Mn
4+ to Mn
3+. The severe J-T distortion, in turn, results in irreversible phase transformations within the LMO structure, often transitioning from a cubic phase to a tetragonal phase. These structural changes are associated with capacity fading and reduced cycling stability of LiMn
2O
4, making over-lithiation impracticable for long-term battery performance [
12]. Furthermore, if additional lithiation occurs, the lithium salt (LiPF
6) can react with the electrolyte and any water present to produce HF and other acidic byproducts. These acids can lead to surface erosion and dissolution on the cathode, which in turn accelerates the rate of deterioration [
13]. Bulk doping and surface coating techniques were used to stabilize the crystal structure, limit the Mn dissolution, and suppress the J-T distortion [
14]. These techniques are effective above 3 V and less effective beyond one lithium intercalation below 3 V, as it is hard to suppress the severe J-T distortion. As a result, most previous research has primarily concentrated on electrochemical studies within the 4 V range for spinel LiMn
2O
4 cathodes [
11]. The Li//LiMn
2O
4 cell cycles much better at 4 V than at 3 V but with slow capacity fading at this voltage. Liu and coworkers [
15] stated that the tetragonal LiMn
2O
4 phase is thermodynamically unstable above 3 V. Still, there was evidence of its presence after cycling of Li//Li
xMn
2O
4 cells at a high rate between 4.5 and 3.5 V. They attributed the presence of this phase to kinetic constraints at the electrode surface during fast intercalation. Yu et al. [
16] investigated the electrochemically synthesized single-crystalline and polycrystalline LiMn
2O
4 in the voltage range of 2.0–4.8 V vs. Li
+/Li. The single-crystalline LiMn
2O
4 exhibited a higher Li-ion storage capacity than polycrystalline LiMn
2O
4, particularly due to a large contribution at the 3-volt potential plateau. This indicates that the material’s structural characteristics significantly impact its electrochemical performance.The interest in understanding the behavior of LiMn
2O
4 at potentials below 3 V is driven by the desire to explore the electrochemical performance of the material in a region that could be relevant for practical applications. Investigating the material’s behavior at lower potentials can provide insights into its capacity, cycling stability, and potential challenges encountered during real-world battery operation.
The most intensively investigated monovalent doping ion is Li
+. Li-rich stoichiometric spinels Li
1+δMn
2−δO
4 (0 ≤ δ ≤ 0.33) was proposed by Gummow et al. [
17] and others [
18,
19,
20,
21,
22,
23,
24,
25,
26,
27,
28,
29,
30,
31,
32,
33]. LiMn
2O
4 is prone to lithium over-stoichiometry, i.e., lithium excess at the manganese sites and Mn
3+/Mn
4+ disorder. Goodenough et al. [
18] showed that an increase in the average oxidation state of Mn in Li
1+xMn
2−xO
4 resulted in the suppression of the J–T distortion. Xia and Yoshio [
24] showed that nonstoichiometric spinel Li
1+xMn
2O
4 provides a slightly lower capacity of about 110 to 120 mAh g
−1 and ideal cycling behavior with mitigated capacity fading. Liu et al. [
32] showed that Li-rich LiMn
2O
4 with lithium/manganese disorder and surface reconstruction could effectively suppress the irreversible phase transition and manganese dissolution. Replacing Mn
3+ at a Mn 16
d site with Li
+ creates a lithium antisite $$\mathrm{Li_{Mn}^{2-}}$$. The synthesis of LiMn
2O
4 near-equilibrium conditions is expected to result in a lithium over-stoichiometric compound with the composition Li
1+αMn
2−αO
4 or, more explicitly, Li[Mn
2−αLi
α]O
4 or $$\mathrm{Li^+[Mn_{1-3\alpha}^{3+}Mn_{1+2\alpha}^{4+}Li_\alpha^+]O_4^{2-}}$$.
In this composition, each negatively charged lithium antisite ($$\mathrm{Li_{Mn}^{2-}}$$) is balanced by two two-hole polarons, resulting in an average manganese oxidation state greater than +3.5. This means Mn
4+ is slightly more prevalent than Mn
3+ [
33]. The theoretical capacity will, therefore, decrease from 148 to 148(1−3α) mAh g
−1.
The electrochemical properties of transition-metal (
M) oxides are known to vary with the ratio of Li/
M as over-lithiation significantly affects the float durability and cyclability of cathode materials; cells show slightly smaller capacity but superior cycle life and improved Coulombic efficiencies [
34,
35]. Kopec et al. [
29] explored the relationship between chemical bonding, the average oxidation state of Mn cations, and lithium substitution in a series of lithium-rich manganate spinels. These spinels show a non-linear decrease in the crystallographic cubic parameter, which is due to the addition of extra Li
+ ions into 16
d sites and the replacement of larger Mn
3+ ions with smaller Mn
4+ ions.The local structure studied by FTIR shows an increase in the covalent bonds in MnO
6 octahedra of the spinel lattice. Dygas et al. [
27] demonstrated that the strength of charge carrier relaxation in Li
1+xMn
2−xO
4 is greater than in stoichiometric LiMn
2O
4.
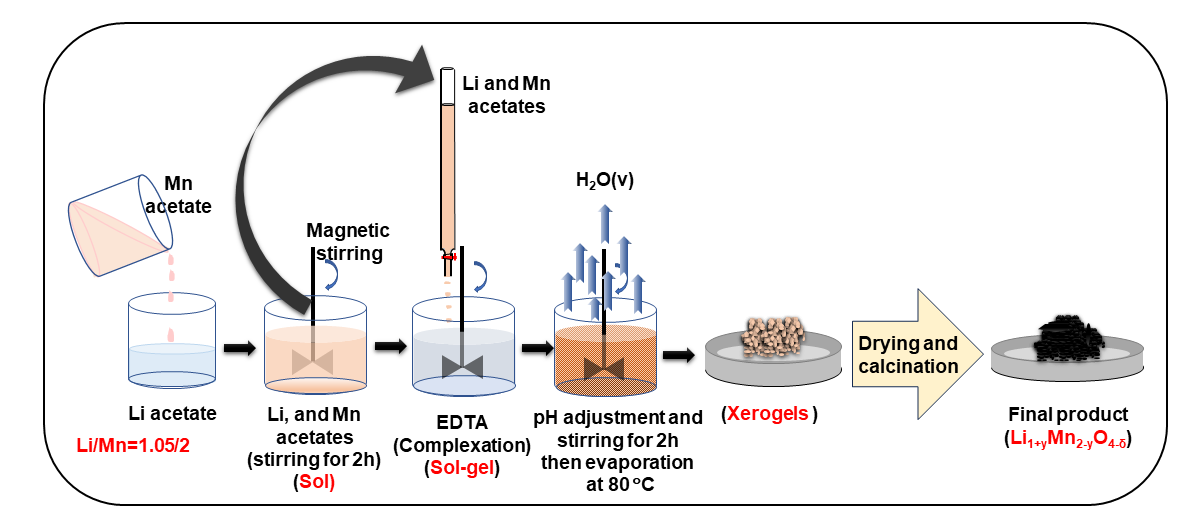
Building upon the aforementioned affinity, the current study delves into the electrochemical performance of Li
1+yMn
2−yO
4−δ (
y = 0.03; δ = 0.01) synthesized by ethylene-diaminetetraacetic acid (EDTA)-assisted sol-gel method to explore the effect of Li over-stoichiometry on the electrochemical behavior under extended potential range. The first stage of this research was to test the best sample which satisfies the structural criterion for high electrochemical performance via the study of the crystalline microstrain. Results demonstrated that calcination of LMO at 900 °C minimizes the strain. For the first time, we successfully induced the formation of the tetragonal phase Li
2Mn
2O
4 through long-term electrochemical cycling (500 cycles) of the Li-rich spinel Li
1.03Mn
1.97O
3.99 in the wide voltage range of 1.5–4.8 V, taking advantage of this continuous and elusive phenomenon known as Jahn–Teller distortion. The electrochemical investigation revealed the formation of the lithiated phase Li
1.03+xMn
1.97O
3.99 (x ≈ 1) when the potential dropped below 3 V, resulting in a capacity of 172 mAh g
−1 nearly double that observed at 3 V (85 mAh g
−1). The newly identified phase exhibited significantly improved capacity retention compared to the ideal spinel LiMn
2O
4 cycled above 3 V. The synthesized Li-rich Li
1+yMn
2−yO
4−δ (LMO) spinel was characterized using X-ray diffraction (XRD), thermogravimetric analysis (TGA), scanning electron microscopy (SEM), high-resolution transmission electron microscopy (HRTEM), and surface area (BET), to elucidate their morphological and structural properties. Additional electrical and electrochemical characterizations of the as-prepared LMO sample are presented, including cyclic voltammetry (CV), galvanostatic charge-discharge (GCD), electrochemical impedance spectroscopy (EIS), and area-specific impedance (ASI).
3.1. Structural and Compositional Properties
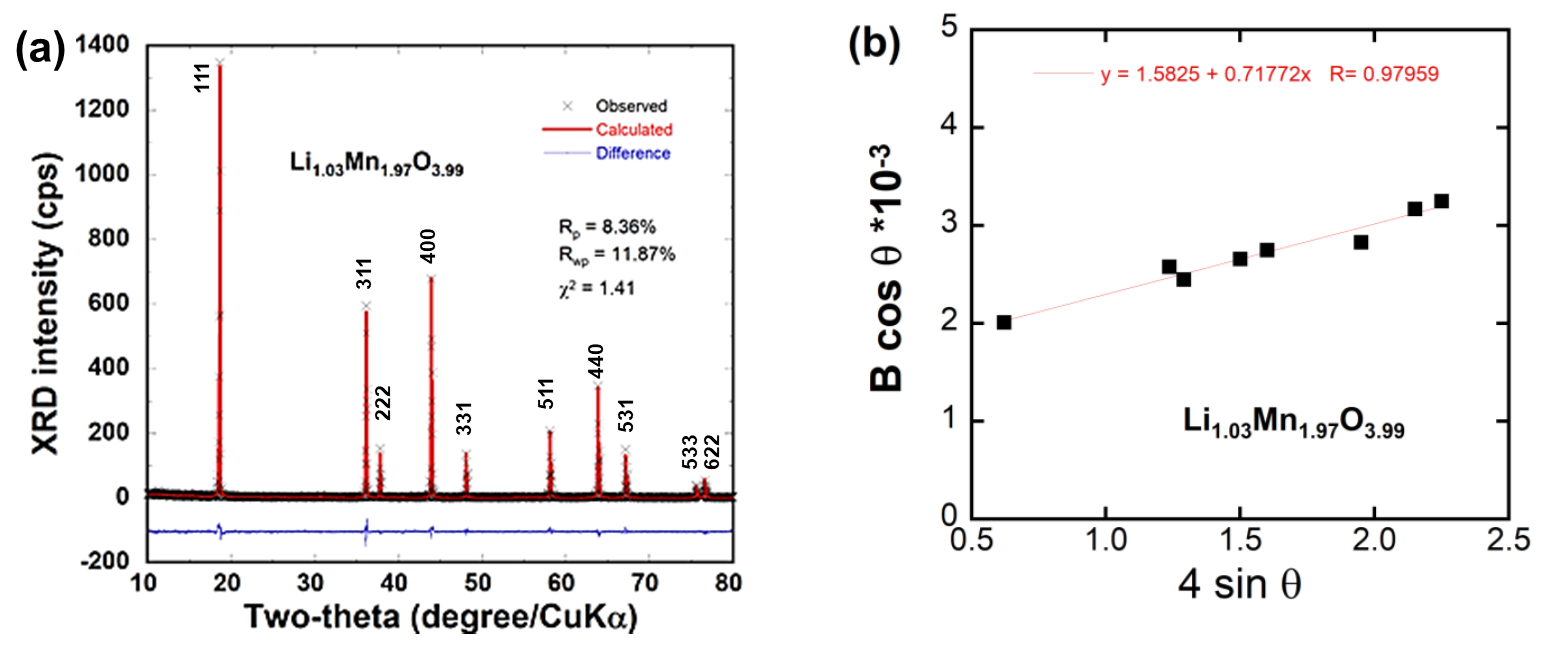
XRD pattern for the LMO900 sample synthesized by sol-gel method using EDTA as a chelating agent at annealing temperature of 900 °C is shown in a. In the 2θ range 10–80°, the XRD patterns reveal eight intense peaks located at 18.7°, 36.1°, 37.7°, 43.7°, 48.1°, 58.1°, 63.8°, and 67.1°, which correspond to the (111), (311), (222), (400), (422), (511), (440), and (531) crystal planes of the LiMn
2O
4 spinel phase, respectively. The XRD reflections of the LMO material calcined at 900 ºC are indexed according to the single spinel LiMn
2O
4 phase with cubic structure $$Fd\bar{3}m$$ (O
h7) (JCPDS card No. 35-0782). The diffraction peaks corresponding to the (111), (311), and (400) lattice planes serve as the primary features of the spinel LiMn
2O
4 phase. In this phase, Li ions occupy the tetrahedral 8
a sites (Wyckoff notation), Mn ions are distributed at octahedral 16
d sites, and oxygen anions are located at the 32
e sites [
7]. Notably, the pure spinel phase is achieved during the transformation of the solid Mn
3O
4 → LiMn
2O
4 after calcination at 900 °C. The cubic lattice parameter
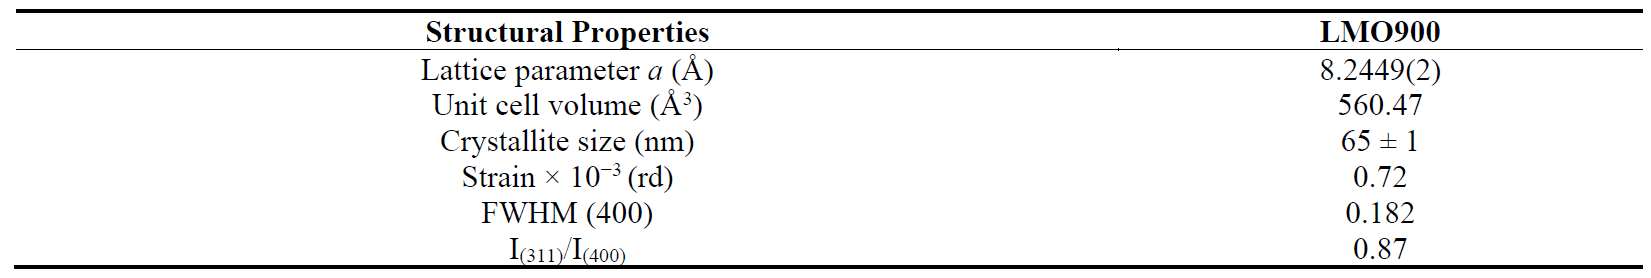
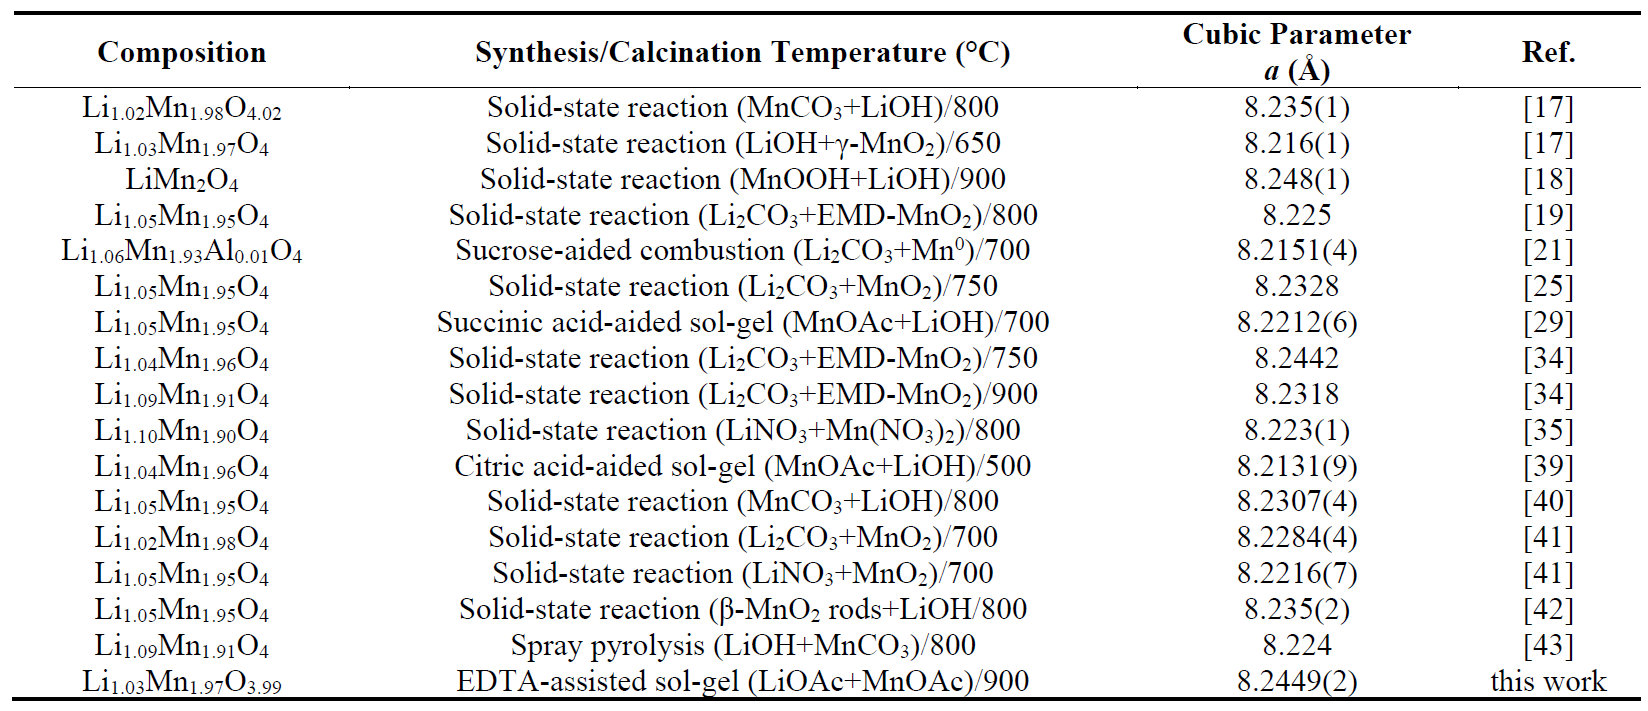
a was calculated via the least square method using 10 well-defined reflections with indexation in the cubic structure. The crystallographic results summarized in match well with the literature data [
38,
39,
40,
41,
42,
43]. The intensity ratio of
Rint =
I(
311)/
I(
400) is thought to be closely related to the electrochemical performance of spinel LiMn
2O
4. LMO900, with
Rint = 0.87, is expected to exhibit good electrochemical performances.
In contrast, samples heat treated at 450 and 750 °C display additional reflections at 2
θ ≈ 32° attributed to Mn
3O
4 impurities in their XRD patterns. The peaks associated with the LiMn
2O
4 spinel phase are well-defined but slightly broadened, indicating the formation of nanosized grains with significant lattice strain. These features do not satisfy the structural criterion of an optimized electrode and are unfavorable for high electrochemical performance to attain high-rate capability and cycling stability [
38]. Raising the annealing temperature to 900 °C results in a gradual sharpening of all peaks, signifying an enhancement in crystallinity with local structure ordering, grain size growth, and/or release of lattice strain. The lattice parameter slightly increases from 8.2322 to 8.2449 Å during calcination from 700 to 900 °C.
. XRD data for the spinel sample synthesized by EDTA-assisted sol-gel method at 900 ºC in air.
Additionally, the structure and composition of the LMO900 sample have been examined through Rietveld refinement (a). The small values of the residual and reliability factors (
Rp = 8.36%,
Rwp = 11.87%, and χ
2 = 1.41) in the Rietveld analysis indicate the successful identification of the cubic phase. The difference between the calculated and experimental diffractogram (blue curve) demonstrates the quality of the fit, validating the structural model. Results indicate an under-occupancy of Mn and a smaller unit-cell parameter (
a = 8.2449 Å) compared to that for a perfect spinel structure for stoichiometric LiMn
2O
4 (
a0 = 8.24762 Å and
V0 = 561.03 Å
3). This suggests that the LMO900 sample is Li doped and has the composition Li
1.03Mn
1.97O
3.99 with 3 mol.% excess of Li. This composition implies the substitution of excess Li ions onto the Mn 16
d site in the spinel, resulting in an average Mn oxidation state of 3.54 [
17].
Additional structural parameters are worth considering to quantify the residual lattice strain and describe the slight variation (if it exists) caused by increased calcination temperature.
First, the full-width at half-maximum (FWHM) of the (400) peak at 2θ = 43.7° is highly sensitive to both the calcination temperature and the degree of crystallization and local structural order. Therefore, as reported by several reports, the lower value of the FWHM of the (400) peak is related to higher crystallinity and better ordering of the local structure [
30,
31]. It is noted that the FWHM of the (400) peak decreases with increasing calcination temperature, indicating that both crystallinity and local structure ordering of the LMO900 sample is the largest among all samples. cubic lattice parameters and crystallite size increase. The lattice parameter increase is attributed to a significant expansion of the spinel lattice, which matches well with previous LiMn
2O
4 reports [
29,
32], while the increase in the crystallite size may be due to a residual lattice strain.
Broadening of diffraction peaks is the third fingerprint of the crystallinity of LiMn
2O
4 powders and the homogeneous distribution of cations within the structure. The microstrain (ε) of the LMO900 particles was determined using the Williamson-Hall equation [
44]:
where
Bhkl is the line broadening of a Bragg reflection (
hkl),
K = 0.9 is the shape factor for a spherical particle,
Lc is the crystallite size, and λ is the X-ray wavelength. The microstrain is estimated from the slope of the plot (
Bhkl cos
θhkl) vs. (4sin
θhkl), and the intersection with the vertical axis provides the crystallite size (b). The
Bhkl value used here is the instrumental corrected one. The microstrain (ε) is inversely proportional to the calcination temperature. The small value of the LMO900 microstrain ε = 0.72 × 10
−3 rd depicts that the local field strain was decreased as a result of lattice ordering upon calcination at 900 °C. It can be compared to ε = 1.5 × 10
−3 rd for LiMn
2O
4 synthesized via two-step precipitation method [
45], to ε = 10.7 × 10
−4 rd for LiMn
2O
4 prepared via rapid calcination of oxalates at 800 °C [
46], and to ε = 1.3 × 10
−3 rd for LiMn
2O
4 prepared through solid-state reaction of the MnO+Li
2CO
3 mixture [
47]. This result is consistent with the crystallite size that was previously discussed. Comparing the lattice parameter
a, FWHM of (400) peak, strain values, and
I(
311)/
I(
400) ratio value of spinel lithium manganese oxides obtained by sol-gel method at different temperatures, we can conclude that the sample (LMO900) prepared at high temperature is well crystallized. This sample exhibits a crystallite size of 65 ± 1 nm determined by the Scherrer formula and shows a lower degree of particle agglomeration due to the synergetic effect of the post-annealing. LMO synthesized at 900 °C is expected to show better electrochemical performance than samples calcined at lower temperatures [
48].
. Structural properties of the LMO900 sample. (<b>a</b>) Rietveld refinement of the XRD pattern. The × signs show experimental data and the continuous line overlapping them refers to the calculated data. The difference between the experimental and calculated data is shown at the bottom. The reliability factors are <i>R</i><sub>wp</sub> = 11.87%, <i>R</i><sub>p</sub> = 8.36% and χ<sup>2</sup> = 1.41. (<b>b</b>) Microstrain of the LMO particles calculated according to Equation (1).
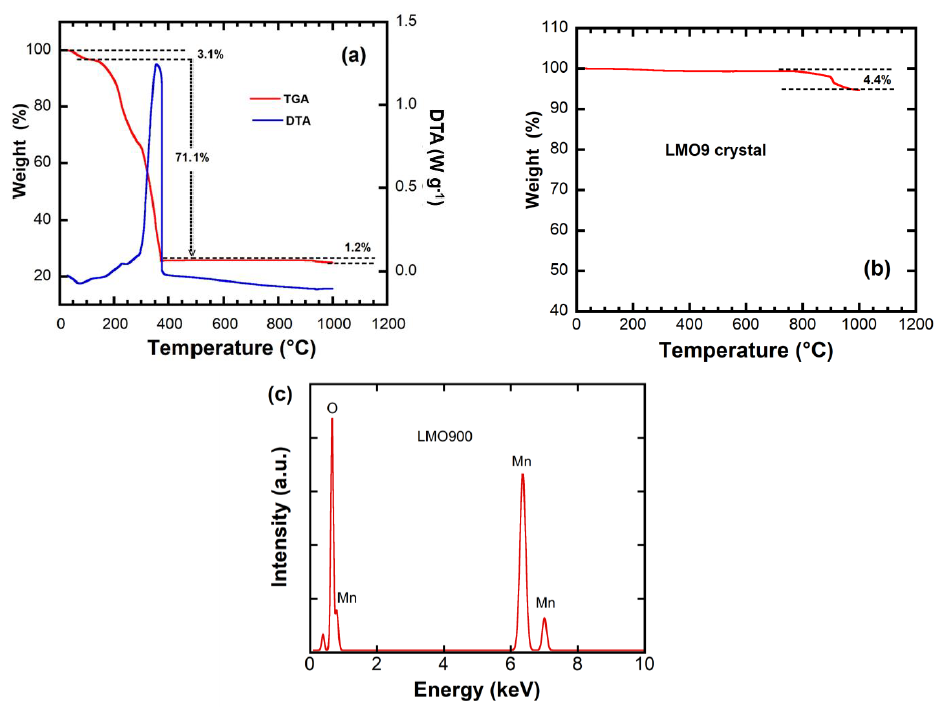
In order to obtain complementary information on the exact temperature of the phase formation reaction of the spinel phase, we have performed a combined thermal gravimetry analysis (TGA) and differential thermal analysis (DTA) on the dried precursor complex in the temperature range 30–1000 °C. The results are shown in a. The TGA curve shows two distinguishable transformation enthalpies, i.e., two weight loss steps occurring at ca. 100 and 235 °C. The endotherm observed at about 100 °C accompanied by a noticeable weight loss (3.1%), is attributed to the evaporation of residual water due to the hygroscopic nature of the precursor sample. As the heating process continues, an exothermic transformation begins to appear at around 235 °C, indicating the onset of the decomposition and/or the soft oxidation of the molecular precursor [
49]. At 378 °C, a significant exothermic reaction occurs due to the decomposition of the organic moieties present in the precursor complex (attributed to the EDTA agent). This reaction occurs in the presence of atmospheric oxygen (in the air) and leads to a weight loss of over 50%s due to a violent oxidation-decomposition reaction. Eventually, this reaction results in the formation of the spinel structure. In this reaction, EDTA seems to function as a fuel in the pyrolysis of the molecular precursors, accelerating the decomposition process of all reactants. This behavior is characteristic of wet-chemistry synthesis using chelating agents such as glycolic, adipic, and oxalic acid [
50,
51]. The spinel phase begins to form at 370 °C due to the synergistic effect of all the reactants (lithium acetate and manganese acetate), as evidenced by the XRD analysis. The spinel remains stable from nearly 370 °C to 930 °C without any observable further weight loss.
The stability of the spinel structure is confirmed by the TG analysis of the as-prepared LMO900 sample (b). No distinct weight loss in the TG curve is observed until 900 °C, indicating that the spinel phase formed by the sol-gel method using EDTA as a chelating agent has a stable structure. This stability has been reported in the literature [
52]. Only slight weight loss of ~4% occurs above 900 °C, which may be attributed to the volatilization and liberation of lithium at such high temperatures. The concentration of the different elements deduced from the EDX spectrum shown in c (O/M = 2.025) is consistent with results from Rietveld refinements.
. (<b>a</b>) TG/DTA curves of the dried precipitate Li-Mn-O precursor prepared by EDTA-assisted sol-gel method. Data are plotted in the “exotherm up” mode. (<b>b</b>) Thermal analysis of the LMO900 spinel sample. Experiments were conducted at a heating rate of 10 °C min<sup>−1</sup> in air. (<b>c</b>) EDX spectrum of the LMO900 sample.
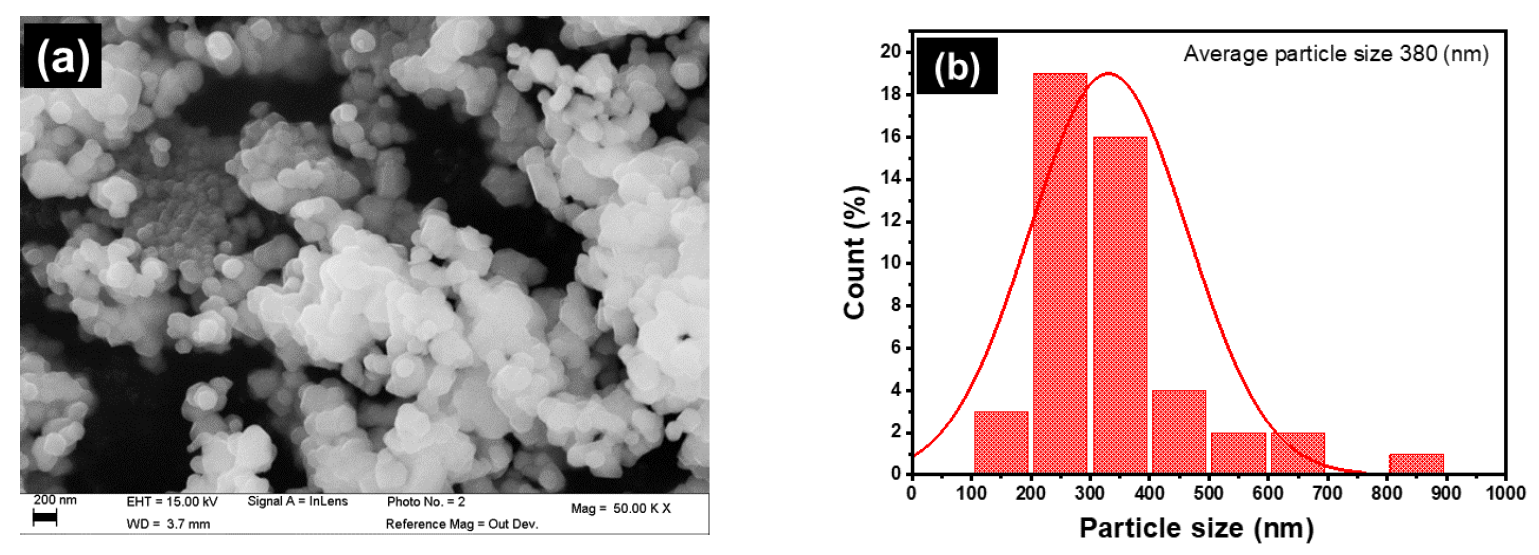
It is well known that particle size, surface morphology, and particle distribution are crucial factors influencing Li-ion battery performance. The electron microscopy analyses (SEM, TEM and HRTEM) of the LMO900 sample are presented in and , respectively. The SEM image (a) reveals well-crystallized particles with similar morphology (almost monodisperse). LMO900 particles present a smooth surface with noticeable edges and corners. This material exhibits a truncated octahedral structure with a face-center cubic (fcc) framework. The particle size distribution was evaluated using the ImageJ software. SEM image analysis was conducted on approximately a hundred nanoparticles. The particles are uniformly dispersed with average size of ~380 nm, as shown in b. These results indicate that the calcination process at 900 °C is beneficial for the growth of single-phase LMO crystals. Additionally, calcining at 900 °C combined with using EDTA as a chelating agent encourages the selective growth of the (110) and (100) crystal planes in LMO materials. This expands the diffusion channels for lithium ions, enhancing the material’s electrochemical performance.The particles appear relatively large compared to spinel LiMn
2O
4 particles prepared by other synthesis methods [
45,
49], likely due to aggregation and agglomeration effects caused by the use of EDTA as a fuel, as illustrated before. The use of EDTA increases the surface energy during the calcination process, causing the crystalline grains to be adjacent and susceptible to anomalous growth. Features of truncated octahedral LiMn
2O
4 with face-center cubic structure, mainly exposing (111) planes and truncated with (100) and (110) planes, have been previously reported by several researchers [
53,
54,
55,
56]. They argue that the (111) planes, with thedensest Mn arrangements, are prone to form stable SEI layers, thereby suppressing Mn dissolution in the electrolyte. The tap density was determined by manually filling a graduated cylinder with the sample, followed by tapping to the constant volume of the sample in the cylinder. The tapped density of 1.85 g cm
−3 was calculated from the ratio between the sample mass and its final volume.
. Morphology of the Li<sub>1.03</sub>Mn<sub>1.97</sub>O<sub>3.99</sub> sample. (<b>a</b>) FESEM image (scale of 200 nm). (<b>b</b>) Particle size distribution evaluated via ImageJ software.
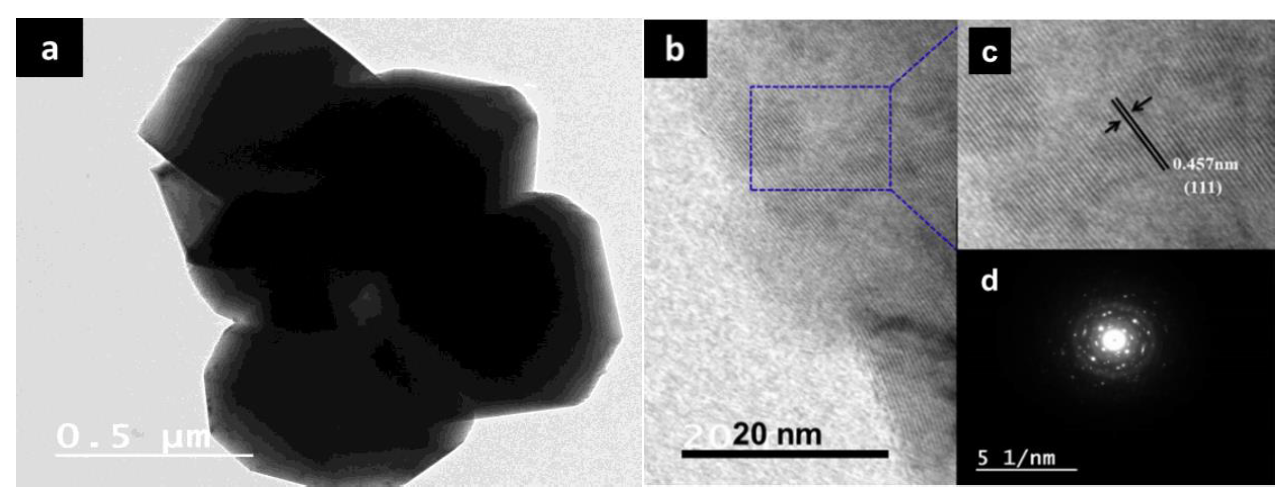
To gain a deeper understanding of the structural information, the morphology and surface state of LMO particles were examined in detail by transmission electron microscopy (TEM). a shows the TEM image of the LMO900 sample, further confirming the truncated octahedral structure with a uniform size distribution. The corresponding HRTEM images (b,c) clearly exhibit lattice fringes with the
d spacing of 0.457 nm, which matches well with the inter-planar distance of the (111) of LMO, indicating remarkable structural compatibility [
46,
47]. Therefore, LMO900 exhibits well-defined fringes, indicating the good crystallinity of powder. It has been reported that dominant (111) surfaces minimize Mn dissolution, facilitate Li
+ ions insertion/desertion, and reduce structural and volume change. Therefore, it can provide a superior cycle life and facilitate high discharge rate capabilities [
57]. The related FFT pattern agrees well with the selected SAED pattern of the whole particle of LMO900 and shows well-defined spots, revealing its single crystalline nature (d).
. (<b>a</b>) TEM image of LMO900 particles, (<b>b</b>) HRTEM image showing the crystallographic structure, (<b>c</b>) enlarged HRTEM image showing the lattice fringes, and (<b>d</b>) SAED image.
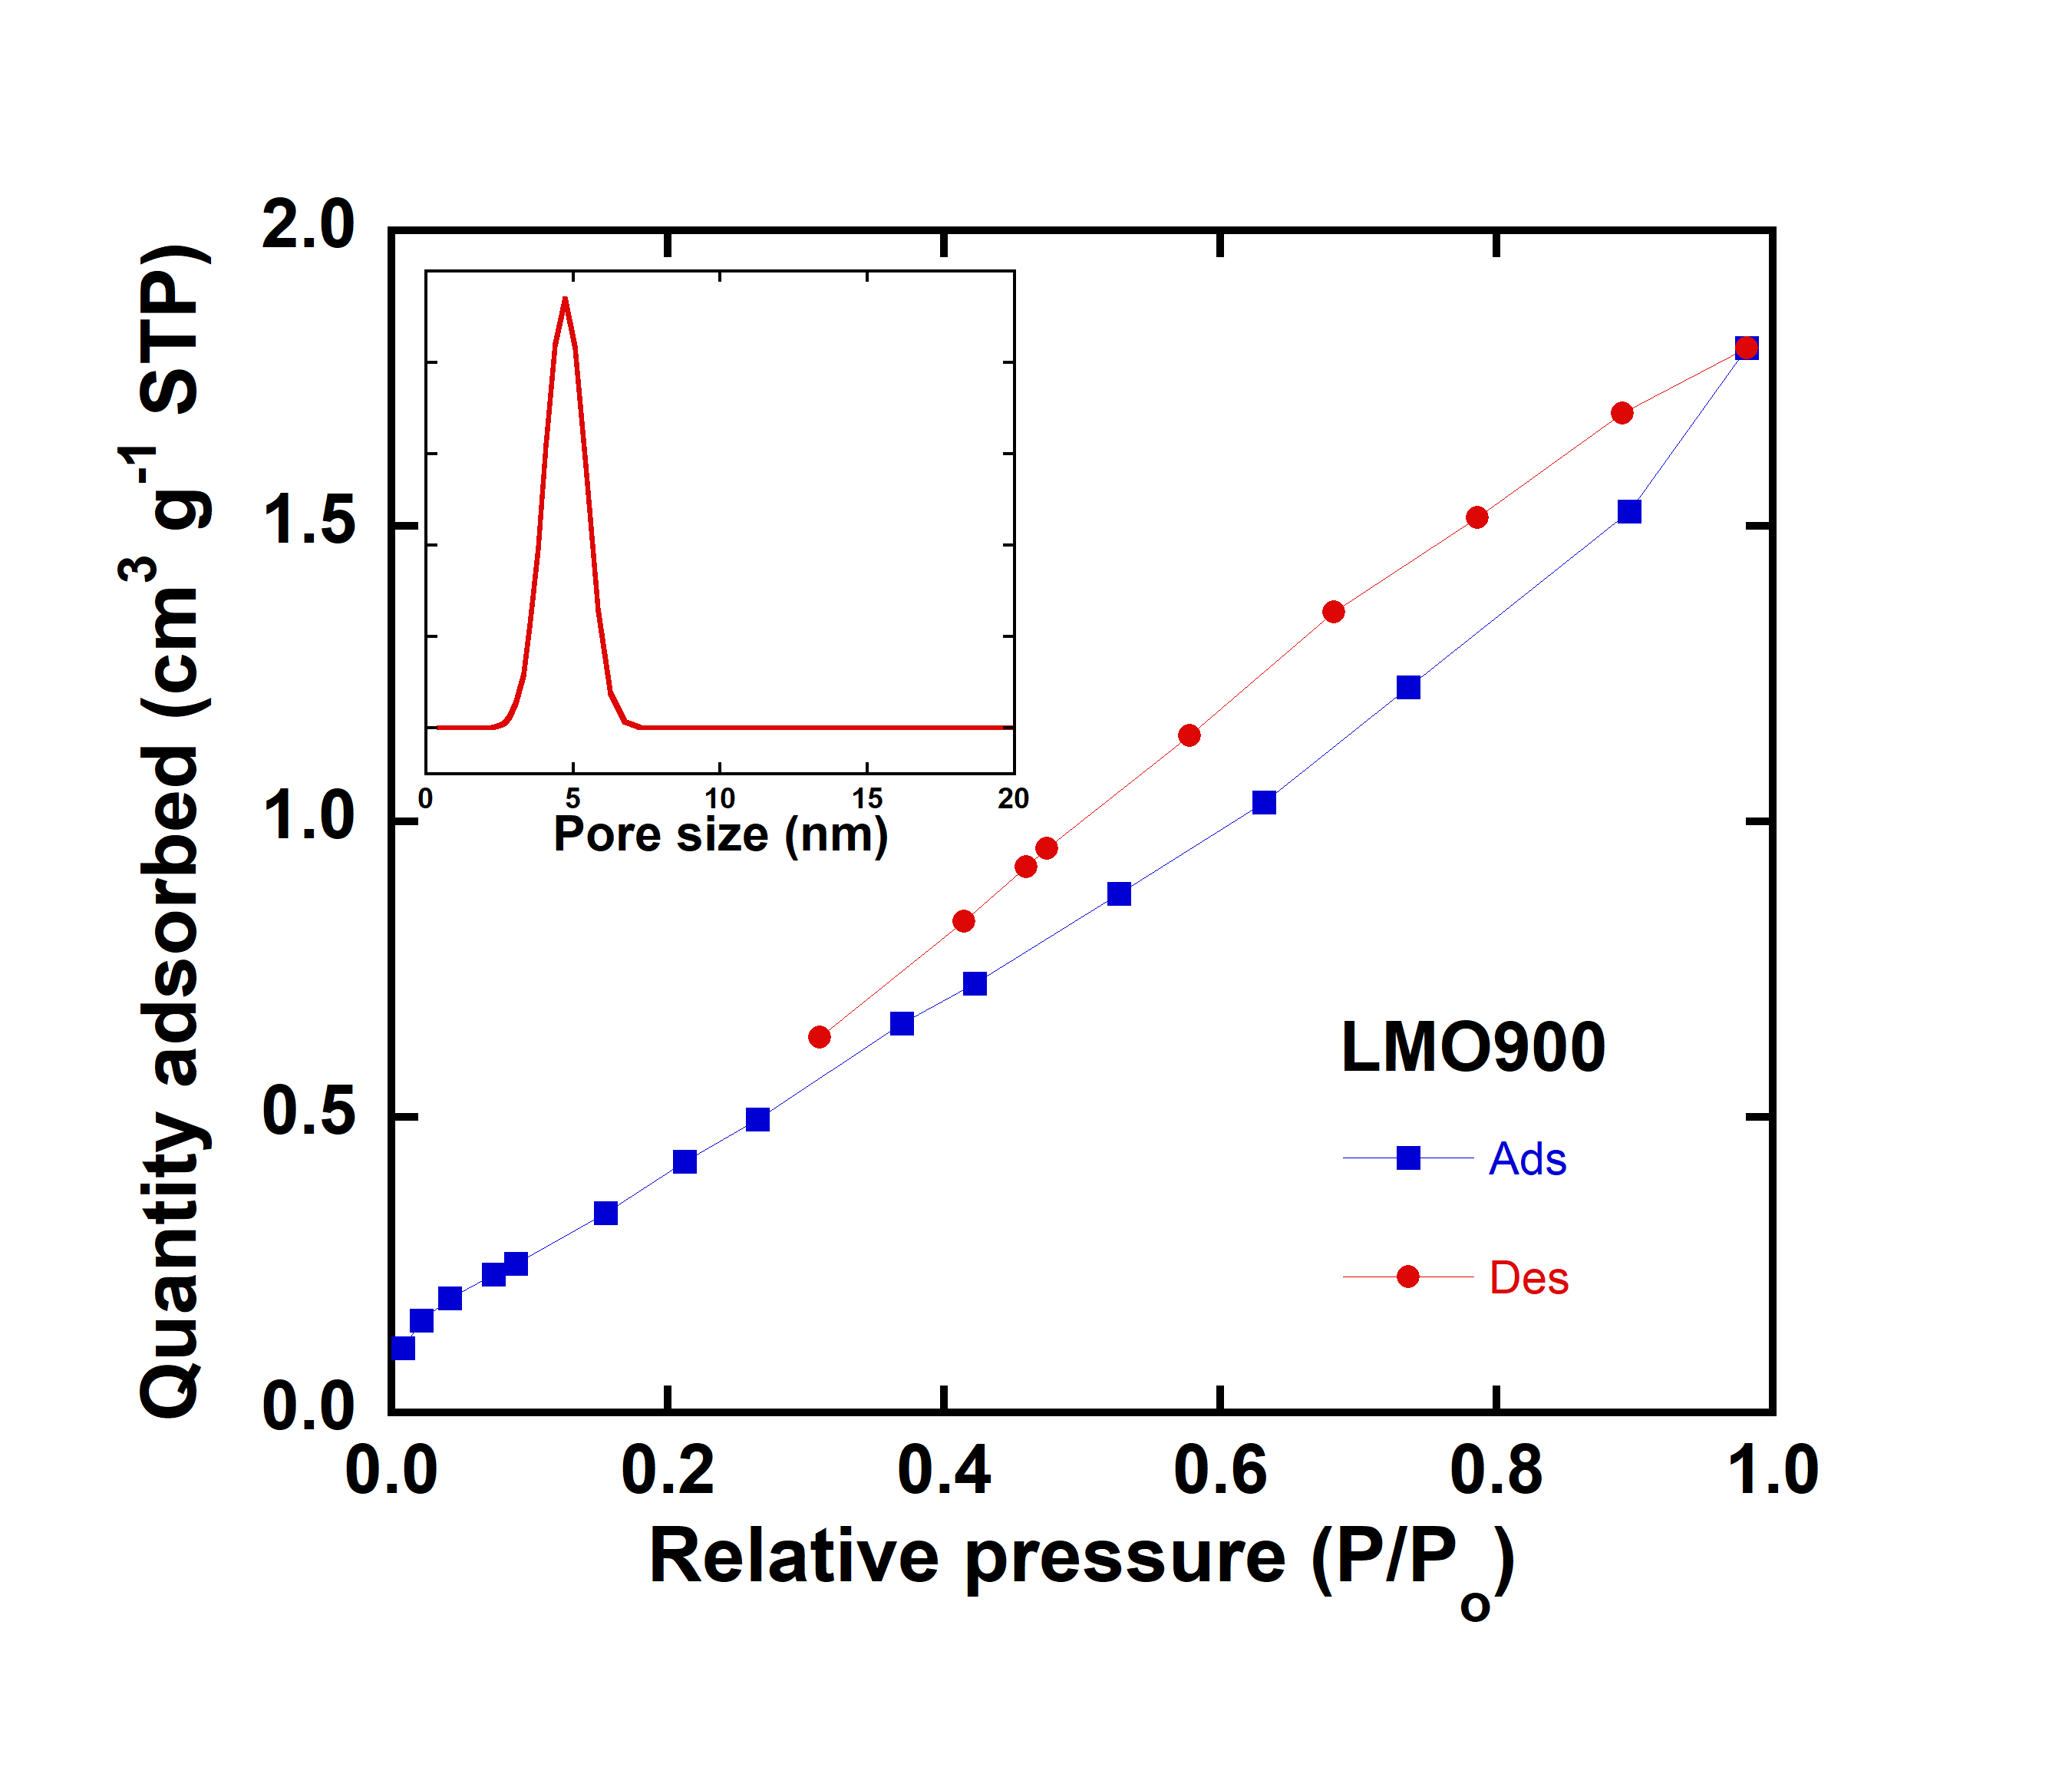
The porosity of the synthesized LMO900 sample was investigated using the BET technique. presents the N
2 adsorption/desorption isotherm and the pore-size distribution (inset) for the LMO900 sample as a function of the relative pressure (
P/
P0,
P0 is standard atmosphere pressure) measured at 77 K. The isotherm curves exhibit an increase in the amount of adsorbed N
2 with the rise in the
P/
P0 value, accompanied by a hysteresis loop. This isotherm profile can be categorized as a type-IV curve with an H3-hysteresis loop, according to the IUPAC classification, implying the existence of a large number of mesopores. BET analysis shows that the LMO900 sample has a specific surface area of 1.68 m
2 g
−1. This value is larger than previously obtained for LiMn
2O
4 synthesized at the same temperature via evaporation method-assisted oxalic acid as a precipitating agent [
49]. Using the Barrett-Joyner-Halenda (BJH) model (via DFT method), the pore volume and size distribution were derived from the adsorption branches of the isotherms, and the total pore volumes were estimated from the adsorbed amount at a relative pressure
P/
P0 of 0.995. As shown in the insets of , the BJH pore size distribution reveals that the LMO900 sample possesses a mesoporous character, with monodisperse mesopore sizes estimated to be 5.1 nm with a total pore volume of 2.8 × 10
−3 cm
3 g
−1. These features may be beneficial, allowing the electrolyte to fully penetrate the pores and facilitating efficient diffusion to active sites with minimal resistance. Additionally, they can buffer the large volume changes during Li-ion insertion/extraction processes. Moreover, the uniformly interconnected mesopore size can decrease diffusion lengths by approximately 10 nm [
58]. Note that particle size (
LBET = 415 nm) can also be calculated from BET measurements by using the relationship
A = 3/(
ρLBET), where
A is the specific surface area,
ρ is the density (4.3 g cm
−3 for LiMn
2O
4).
. Nitrogen adsorption/desorption isotherms for LMO900. The inset displays the pore-size distribution.
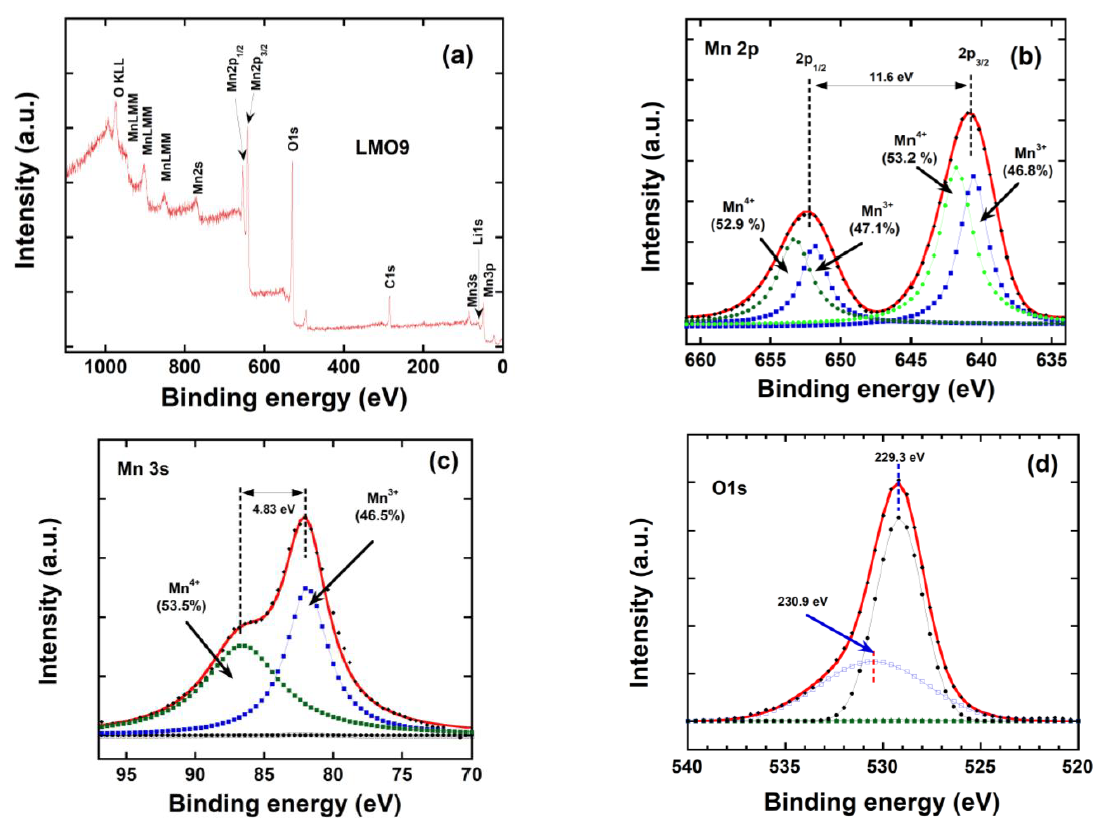
The electronic states of the elements in the spinel sample were revealed by X-ray photoelectron spectroscopy, as presented in . The survey spectrum (a) of the LMO900 specimen shows peaks with Gaussian-like line shape at binding energies of 84.5 eV for Mn 3s, 530.5 eV for O 1s, 55.0 eV for Li 1s, 642.3 eV for Mn 2p
3/2, and 654.4 eV for Mn 2p
1/2, which match well with the characteristic XPS patterns of the LiMn
2O
4 spinel phase [
59]. The high-resolution XPS spectra of the Mn 2p, Mn 3s, and O 1s core levels for the spinel LMO900 sample are illustrated in b–d, respectively. The experimental binding energies were corrected for specimen charging by referencing the C 1s line at 284.5 eV. As shown in b, the Mn 2p
3/2 and Mn 2p
1/2 doublet of Mn 2p (with 11.6 eV spin-orbital energy separation) can be fitted in two bands corresponding to the binding position of Mn
3+ and Mn
4+ cations. The XPS spectrum of O 1s shown in corresponds to the (O-M-O) bonds. A shoulder peak observed at 530.9 eV is assigned to the residual oxygen related to impurities with OH
− or O
− bonding on the surface [
60]. In order to accurately calculate the Mn
3+ and Mn
4+ contents, specific peaks of Mn 2p
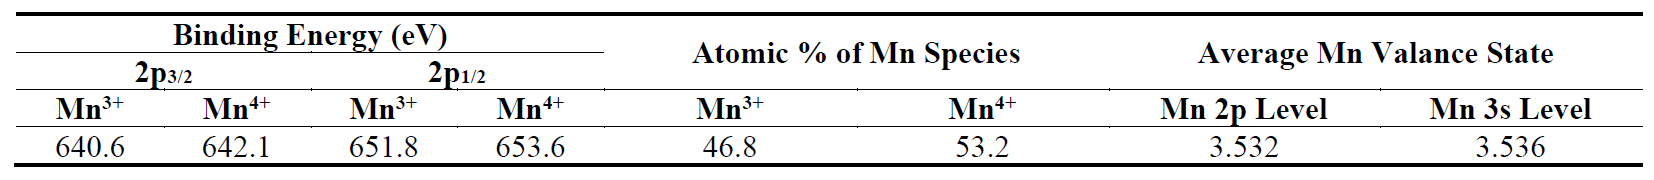
3/2 were fitted and the results are shown in b and listed in . The average Mn valence state is 3.53 due to 53.2% Mn
4+ and 46.8% Mn
3+. Also, the exchange splitting value (Δ
E3s) of Mn 3s can be used to determine the average valence state of Mn via a more quantitative method. According to Beyreuther et al. [
61], there is a linear relationship between the Mn exchange splitting energy and Mn valence governed by the equation (ν
Mn = 9.67−1.27 Δ
E3s/eV), which is used to approximately estimate the average valence state of Mn. c shows that the Δ
E3s for LMO900 sample is ≈4.83 eV, corresponding to an average Mn valence state of 3.54. This result means that the excess 3 mol.% of Li is able to reduce the active J–T Mn
3+ ion, i.e., 3 mol.% of Mn
3+ is replaced by Li
+ on the Mn 16
d site in the spinel framework. XPS results are consistent with the XRD data of the lithium-rich Li
1.03Mn
1.97O
3.99 phase.
. XPS results for the spinel LMO900 sample. (<b>a</b>) Survey spectrum and (<b>b</b>–<b>d</b>) high-resolution XPS spectra. (<b>b</b>) Mn 2p, (<b>c</b>) Mn 3s where deconvoluted bands represent the Mn<sup>4+</sup> (green) and Mn<sup>3+</sup> (blue) contribution, and (<b>d</b>) O1s core level spctrum where bands due to (O–M–O) bonds (black) and residual impurities (violet) are deconvoluted.
. Results of the XPS analysis for the spinel LMO900 sample: binding energies (eV) of Mn2p, atomic % of Mn and average Mn valance state obtained from Mn 2p and Mn 3s levels.
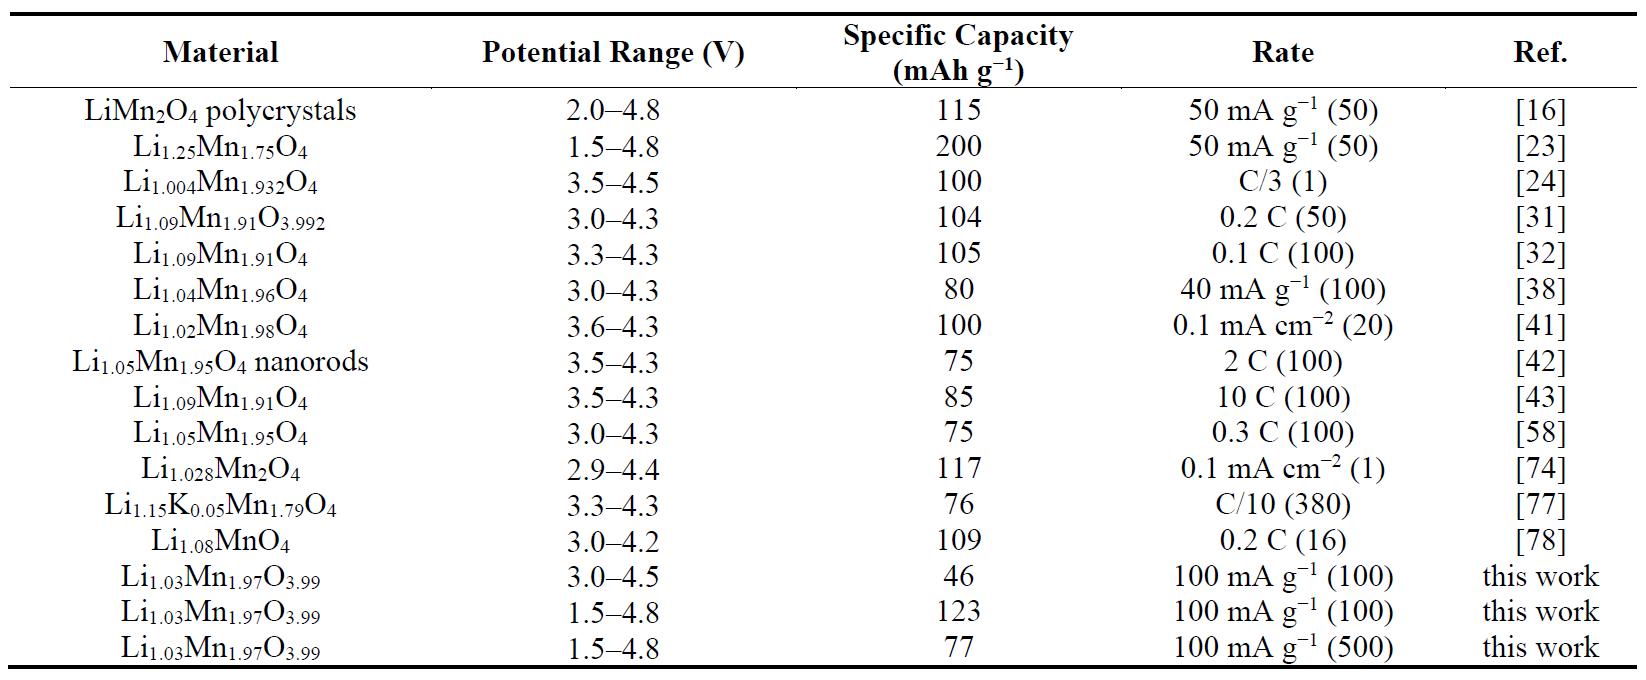
Unlike previously published reports on Li-Mn-O spinels in the 4-V region [
45,
49,
62], this work investigates the electrochemical properties of spinel Li
1.03Mn
1.97O
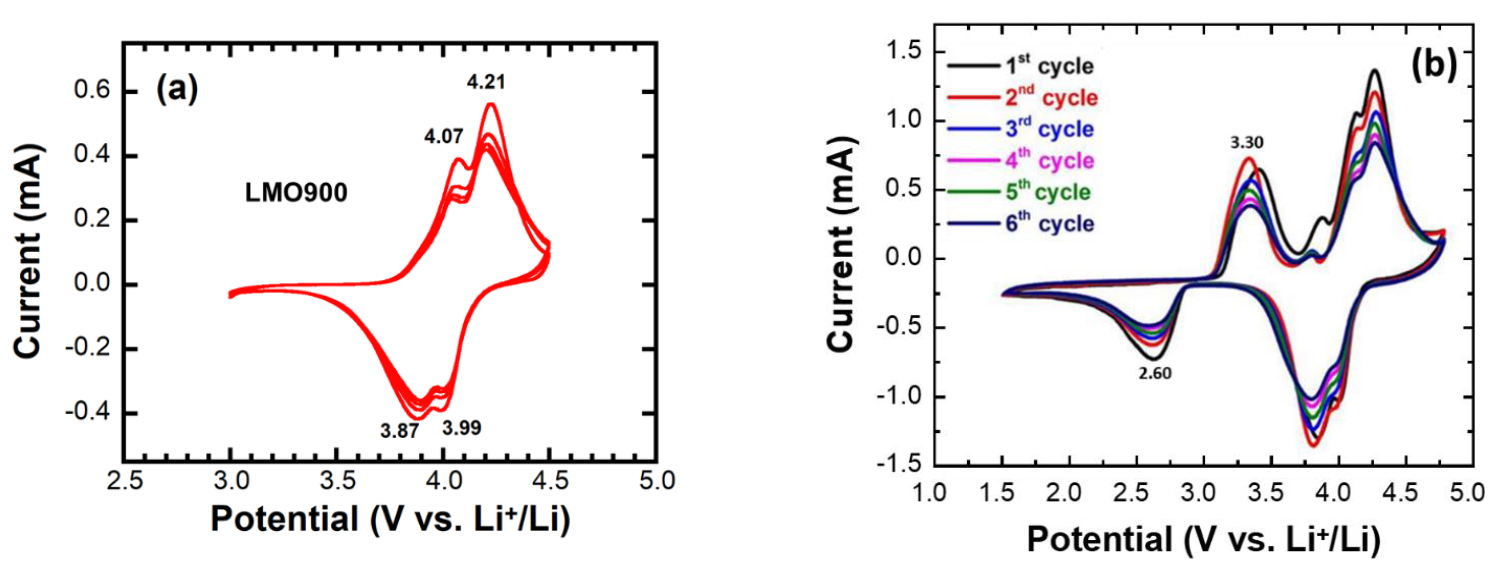
3.99 in both a narrow (3.0–4.5 V) and an extended (1.5–4.8 V) potential window using cyclic voltammetry (CV) and galvanostatic charge-discharge (GCD) method. a displays the CV curves of the LMO900 electrode in the conventional voltage range of 3.0–4.5 V vs. Li
+/Li at a sweep rate of 0.1 mV s
−1 over 4 cycles. All voltammograms exhibit two well-defined, separated reversible redox peaks at ~ 4.07/3.87 V and ~ 4.21/3.99 V. These peaks are associated with the reversible ingress and egress of Li
+ ions into/from the tetrahedral sites (8
a) of the spinel lattice. Bianchini et al. [
40] explored the phase diagram of a series of Li-Mn-O spinels. Stoichiometric LiMn
2O
4 undergoes two biphasic reactions, represented by the α + β and β + ε transitions, with ε < 0.1 close to λ-Mn
2O
4, with the intermediate β-phase close to Li
0.5Mn
2O
4 [
63]. The same behavior is observed for the Li-rich compound Li
1.03Mn
1.97O
3.99, where the total amount of extractable lithium decreases as 1 − 3
x = 0.91. Therefore the amount of lithium that remains in the structure at the end of the charge increases to 0.12 (i.e., reaching the fully oxidized Mn
IV composition Li
0.12Mn
1.97O
3.99).
On the other hand, b displays the CV curves of the LMO900 material within the wide potential range of 1.5−4.8 V vs. Li
+/Li, using the same scan rate of 0.1 mV s
−1 over 6 cycles. The peaks become well-defined and sharper than those cycled at the narrow voltage window (3.0−4.5 V), and the high current response at the wider voltage window was observed. Additionally, it has higher oxidation and reduction current peaks and a larger area, demonstrating the optimal reversibility of Li-ion transportation (i.e., Coulombic efficiency) and superior specific capacity. Besides the two redox peaks characteristic of the cubic stoichiometric spinel LiMn
2O
4 ($$Fd\bar{3}m$$ s.g.), there is notably the presence of an additional redox peak below the 3-V region at ~3.3/2.6 V, which remains stable over cycling. This additional redox reaction is a feature of the Li-ion storage at octahedral sites (16
c), involving the conversion of cubic (LiMn
2O
4 (to tetragonal phase transition (Li
2Mn
2O
4) [
23,
64]. This transformation results from an overlithiation case, in which 50% of Mn
4+:
d3 (
t2g3) in the cubic structure converts to high spin Mn
3+:
d4(
t2g3eg
1). This transformation is also confirmed by the oxidation and reduction current peak ratios (
Ipa/
Ipc) [
63]. An additional oxidation peak at 3.8 V is attributed in the literature to parasitic reactions [
65,
66].
The peak potential difference (Δ
Ep) between the oxidation and reduction peaks can provide insights into the impedance growth related to electron transfer and the polarization degree of the battery [
67]. The Δ
Ep values of LMO900 cycled in the wide potential window 1.5–4.8 V are in the range 0.27–0.29 V, slightly larger than those of LMO900 cycled at the conventional potential range (0.19 V). This suggests that this sample may have a larger electrochemical reaction polarization, possibly due to the tetragonal phase (Li
2Mn
2O
4) presence. However, the sample exhibits similar lower potential intervals (Δ
Ep) over the subsequent five cycles, suggesting good stable cycle performance. On the other hand, Δ
Ep values in the conventional narrow voltage range of 3.0–4.5 V decrease with cycling, indicating the stability of the cubic phase and the improvement of reversibility due to fast Li
+ ion transport. Therefore, we can conclude from the cyclic voltammograms of LMO900 that extra Li-ion storage at the 16
c octahedral vacancies in spinel LiMn
2O
4 was more easily activated in the wide potential window (1.5–4.8 V), leading to the production of the tetragonal phase Li
2Mn
2O
4. This effect on the cycle performance will be investigated in detail in the following.
. Cyclic voltammograms of the LMO900 electrode carried out at 0.1 mV s<sup>−1</sup> in the narrow 3.0–4.5 V (<b>a</b>) and extended 1.5–4.8 V (<b>b</b>) potential window.
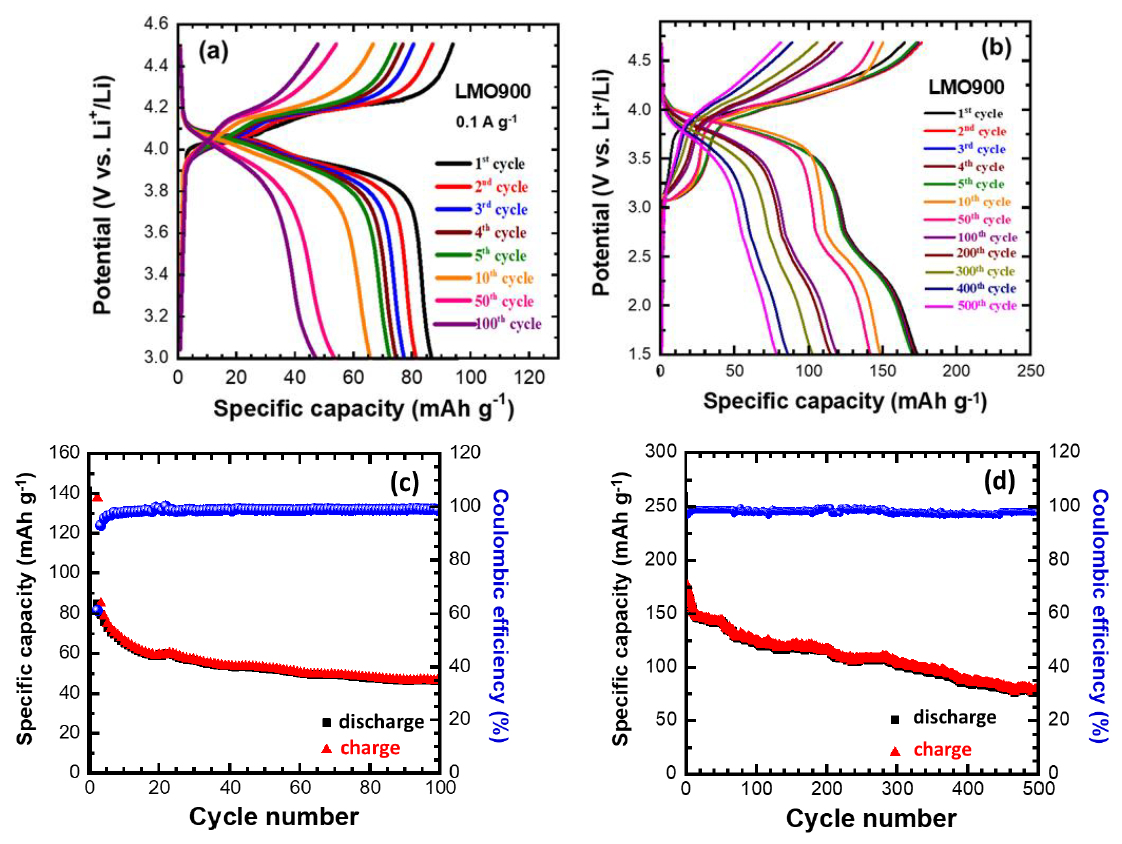
The GCD profiles of the LMO900 electrode cycled at a current density of 100 mA g
−1 for 100 and 500 cycles in the potential range 3.0–4.5 V and 1.5–4.8 V vs. Li
+/Li are shown in a,b, respectively. During the first charging and discharging process, a displays two distinct voltage charge plateaus at ~4.10/4.20 V vs. Li
+/Li and two distinct voltage discharge plateaus at 4.05/3.94 V vs. Li
+/Li, respectively. These plateaus corresponding to the LiMn
2O
4/Li
0.5Mn
2O
4 and Li
0.5Mn
2O
4/Li
εMn
2O
4 two-phase systems match well with the CV results. For LMO900 operating in the wide voltage range of 1.5–4.8 V (b), a slight polarization can be detected after 100 cycles. Notably, the polarization decreases over cycling. In the first 5 subsequent cycles, both charge and discharge voltage plateaus align with each other and with CV peaks. An additional plateau appears at ~2.8 V in the wide voltage range 1.5–4.8 V, corresponding to the tetragonal phase Li
2Mn
2O
4 and generally assigned as “3-V plateau” in literature [
64]. The additional plateaus are consistent during the first five cycles and correspond to CV peaks. When cycled 100 times in the wide potential range of 1.5–4.8 V, the additional plateau gradually disappears, indicating gradual conversion of the tetragonal phase Li
2Mn
2O
4 to the cubic LiMn
2O
4. This result is also evident in the charge profile, as the plateau starts to disappear and takes on the shape of a charge profile of the 3.0–4.5 V range, accompanied by a decrease in polarization with repeated cycling.
c,d illustrate the cycle stability and Coulombic efficiency of the LMO900 cathode material cycled at a current density of 100 mA g
−1 (approximately 0.7 C rate) within the narrow potential window 3.0–4.5 V and the extended potential window 1.5–4.8V vs. Li
+/Li, respectively. Within the conventional voltage range of 3.0–4.5 V, the Li//LMO900 cell initially provides a specific capacity of 85 mAh g
−1, and after 100 cycles, it maintains 46 mAh g
−1. This corresponds to a capacity retention of 54.3%, with a significant capacity decay of 45.7% (equivalent to a capacity loss of approximately 0.46% per cycle). Remarkably, within the extended potential range of 1.5–4.8 V, the same cell exhibits an initial specific capacity of 173 mAh g
−1. After 100 cycles, it retains 123 mAh g
−1, resulting in a capacity retention of 71.45% and a minor capacity decay of 28.55%. The capacity loss is thus reduced to 0.28% per cycle. Note that such a cell provides a specific capacity of ~125 mAh g
−1 in the 3-V region. After 500 cycles, the Li//LMO900 cell gives 77 mAh g
−1 with a capacity retention of 44.6%. This test shows a small capacity decay of 0.15 mAh g
−1 per cycle. The findings suggest that a slight excess of Li in Mn 16
d sites enhances specific capacity and reduces capacity loss by preventing J-T distortion in the Li-rich lattice.The observed increase in discharge capacity at lower voltage levels may be attributed to the presence of a tetragonal phase (Li
2Mn
2O
4), as the standard spinel (LiMn
2O
4) has a theoretical capacity of 148 mAh g
−1 for the insertion and extraction of 1 Li
+ per formula unit. In Li
2Mn
2O
4, an overlithiation state (2 Li
+ per formula unit) occurs, as Li ions can also insert into octahedral 16c sites, which are face-shared with tetrahedral 8
a sites. This expanded capacity contributes to the increased discharge capacity observed in the lower voltage range.
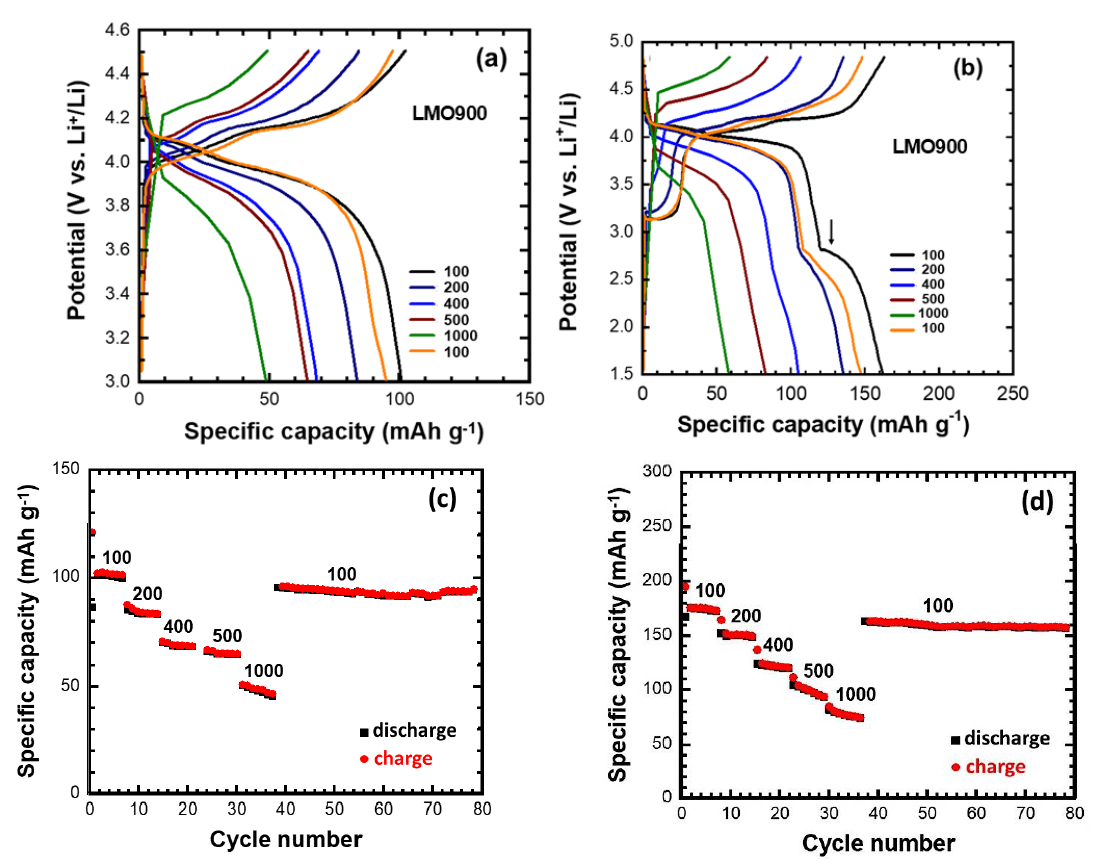
. (<b>a</b>,<b>b</b>) GCD profiles of the LMO900 electrode recorded in the potential range of (<b>a</b>) 3.0–4.5 V for 100 cycles and (<b>b</b>) 1.5–4.8 V vs. Li<sup>+</sup>/Li for 500 cycles at current density of 100 mA g<sup>−1</sup> (0.7 C) (<b>c</b>,<b>d</b>) Cycleability and Coulombic efficiency of LMO900 cathode material in potential window (<b>a</b>) 3.0–4.5 V and (<b>b</b>) 1.5–4.8 V vs. Li<sup>+</sup>/Li under 100 mA g<sup>−1</sup> current density.
The representative GCD profiles of the LMO900 electrode tested in both potential domains at different current densities from 100 to 1000 mA g
−1 (with 1C = 148 mA g
−1) are depicted in a,b. Even at high rates, the 4-volt plateaus remain recognizable. The GCD profiles of the spinel electrode cycled in the wide potential range show a remarkable phenomenon: the reduction of the plateau related to the tetragonal phase at 2.8 V (marked with an arrow in b) until it disappears with increasing current density. This finding is attributed to the tetragonal phase behaving like a cubic phase under high current density conditions. c shows the rate capability of the LMO900 electrode tested in the narrow potential range of 3.0–4.5 V. The discharge capacity values decrease with increasing C-rates in the sequence 85, 52, 35, 30, and 15 mAh g
−1 at 100, 200, 400, 500, and 1000 mA g
−1, respectively. When cycled again at 100 mA g
−1, the discharge capacity of the spinel sample reached 64.6 mAh g
−1 with a capacity retention of 76%. On the other side, LMO900 shows discharge capacity of 162, 135, 105, 83, and 58 mAh g
−1 (d) when tested in the wide potential range 1.5–4.8 V using the same current densities at 100, 200, 400, 500 and 1000 mA g
−1, respectively. When cycled again at 100 mA g
−1, the discharge capacity of the spinel sample reached 148 mAh g
−1 with a capacity retention of 91.5%. Again, rate capability tests show much better performance for the wide-range voltage than the narrow one.
. Electrochemical properties. (<b>a</b>,<b>b</b>) GCD profiles of the LMO900 electrode recorded in the potential range of (<b>a</b>) 3.0–4.5 V and (<b>b</b>) 1.5–4.8 V vs. Li<sup>+</sup>/Li at different current densities (expressed in mA g<sup>−1</sup>; 0.148 A g<sup>−1</sup> is equivalent to 1C rate). (<b>c</b>,<b>d</b>) Rate capability for different current densities (100–1000 mA g<sup>−1</sup>) in potential window (<b>c</b>) 3.0–4.5 V and (<b>d</b>) 1.5–4.8 V vs. Li<sup>+</sup>/Li.
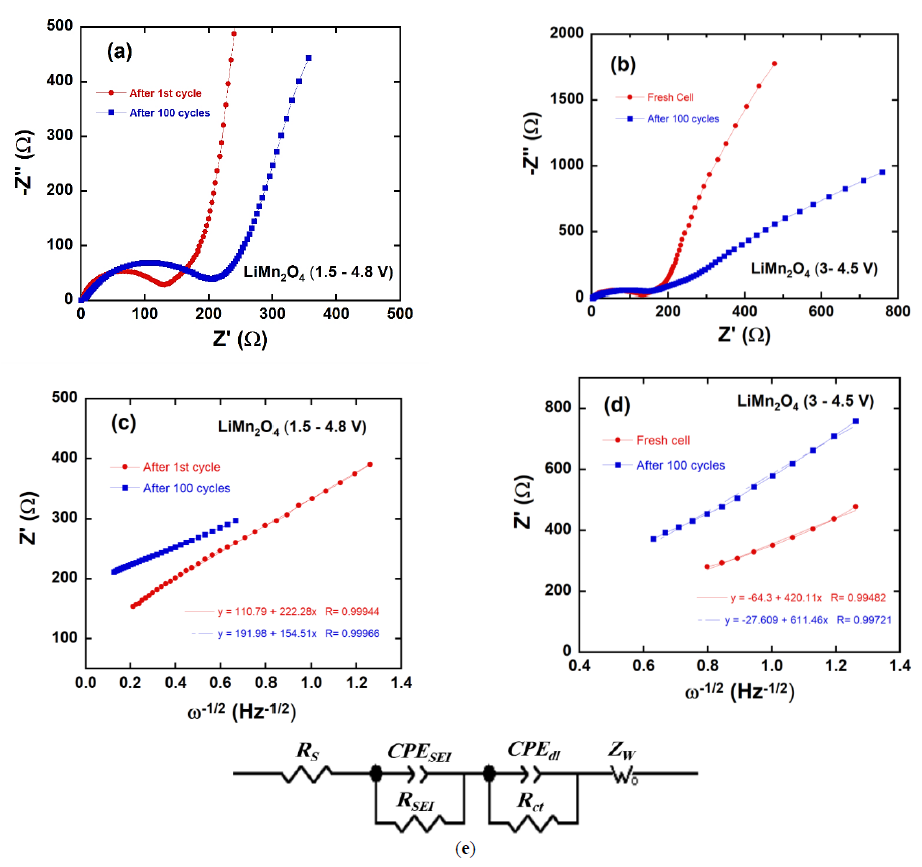
Electrochemical impedance spectroscopy is a useful
in-situ technique to investigate the changes in the electrode-electrolyte interface resistance and Li
+ ion kinetics of electrodes (). EIS measurements of LMO900 were carried out for the fresh electrode and after the 100th cycle for the voltage window 3.0–4.5. Additionally, measurements were performed after the 1st and 100th cycle for the voltage window 1.5–4.8 V, recorded at a rate of 0.7 C. a,b show the Nyquist plots for 1.5–4.8 and 3.0–4.5 V, respectively. The equivalent circuit model used to analyze the EIS patterns (e) is composed of four series components: the ohmic resistance of the cell (
Rs), the impedance of the SEI layer (
RSEI-
CPESEI parallel circuit), the charge transfer impedance and interfacial capacitance at the electrode/electrolyte interface (
Rct-
CPEdl parallel circuit), and the Warburg impedance (
Zw-R), which characterizes the Li
+ ion diffusion-controlled process [
67]. In general, there is an increase in the total impedance after the 100th cycle at a 0.7 C rate, as shown from the fitted parameters listed in . For (1.5–4.8 V), the ohmic resistance (
Rs) values are 2.85 and 4.17 Ω after the 1st and 100th cycle, respectively. Also,
RSEI and
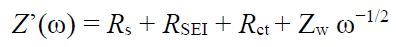
Rct significantly increased during cycling. The real part
Z’(ω) of the total impedance of the cell is the sum of the real part of the four components:
Zw can be determined from the slope of the Warburg plot
Z’ vs. ω
−1/2 (c,d), and the apparent diffusion coefficient
DLi is given according to the relation [
68]:
in which
R is the gas constant,
T is the absolute temperature,
F is the Faraday constant,
n is the number of electrons transferred in the redox reaction at the electrode-electrolyte interface,
CLi is the concentration of Li
+-ion inside the electrode, and
A is the effective surface area of the electrode. The apparent diffusion coefficient (
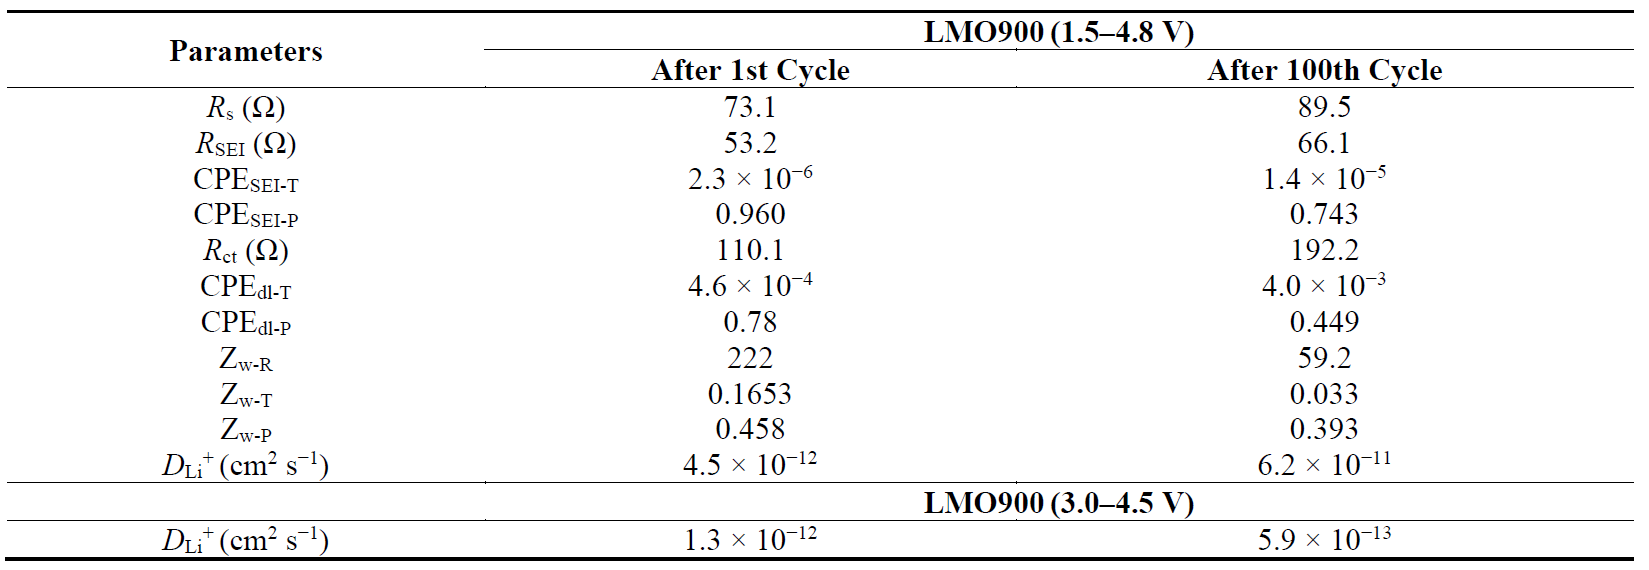
DLi) values for spinel electrodes, both in the initial (fresh) state and after the 1st and 100th cycles, are provided in . The data is presented for two voltage ranges, namely 3.0–4.5 V and 1.5–4.8 V. In the potential window of 3.0–4.5 V, the apparent diffusion coefficient for the fresh LMO900 electrode is
DLi = 1.26 × 10
−12 cm
2 s
−1, which is higher than the value after the 100th cycle (5.9 × 10
−13 cm
2 s
−1). This observation aligns with the increased values of
RSEI and
Rct.
. EIS measurements of LMO900 electrode (<b>a</b>) Nyquist plot after 1st and 100th cycle at 0.7 C rate, in the potential window 1.5–4.8 V. (<b>b</b>) Nyquist plot for fresh and after 100th cycle at 0.7 C rate, in the potential window 3.0–4.5 V. (<b>c</b>) Plots of the real part of the impedance vs. ω<sup>−1/2</sup> for the LMO900 electrode after 1st and 100th cycle, in the potential window 1.5–4.8 V. (<b>d</b>) Plots of the real part of the impedance vs. ω<sup>−1/2</sup> for LMO900 electrode for fresh and after 100th cycle, in the potential window 3.0–4.5 V. Full lines are the slope of the <i>Z</i><sub>real</sub> vs. ω<sup>−1/2</sup> fits, providing the Warburg impedance. (<b>e</b>) Equivalent circuit used for the analysis of the −Z” vs. Z’ planes.
As reported previously, the value of
DLi for fresh LMO spinel cathode material varies from 10
−12 to 10
−13 cm
2 s
−1 [
45,
61,
69]. By raising the charge potential to 4.8 V and lowering the discharge potential to 1.5 V, the
DLi of 4.53 × 10
−12 cm
2 s
−1 after the 1st cycle of the LMO900 electrode is significantly lower than that after the 100th cycle (6.2 × 10
−11 cm
2 s
−1). We recorded the Nyquist profiles after 1st cycle for the wide voltage window (1.5–4.8 V) because we anticipate a phase transition from cubic LiMn
2O
4 to a tetragonal or spinel-like structure (high Li concentration). This comparison confirms that the expansion of the voltage window (1.5–4.8 V) enhances Li
+ ion kinetics, possibly attributed to partial spinel-like ordering, Li
1+xMn
2−xO
4, or a partial phase transition to Li
2Mn
2O
4 from the ideal spinel LiMn
2O
4. The deviation from the ideal spinel to a spinel-like or tetragonal structure increases the amount of Li
+ ions passing through tetrahedral sites or 16
c octahedral sites without face-sharing Mn ions. This results in lower electrostatic repulsion compared to when Li
+ ions pass through tetrahedra that share faces with Mn ions, which leads to improved Li transport kinetics and, thus, a larger capacity.
. Fitting results of Nyquist plots of LMO900 cycled at 0.7 C rate in two potential widows.
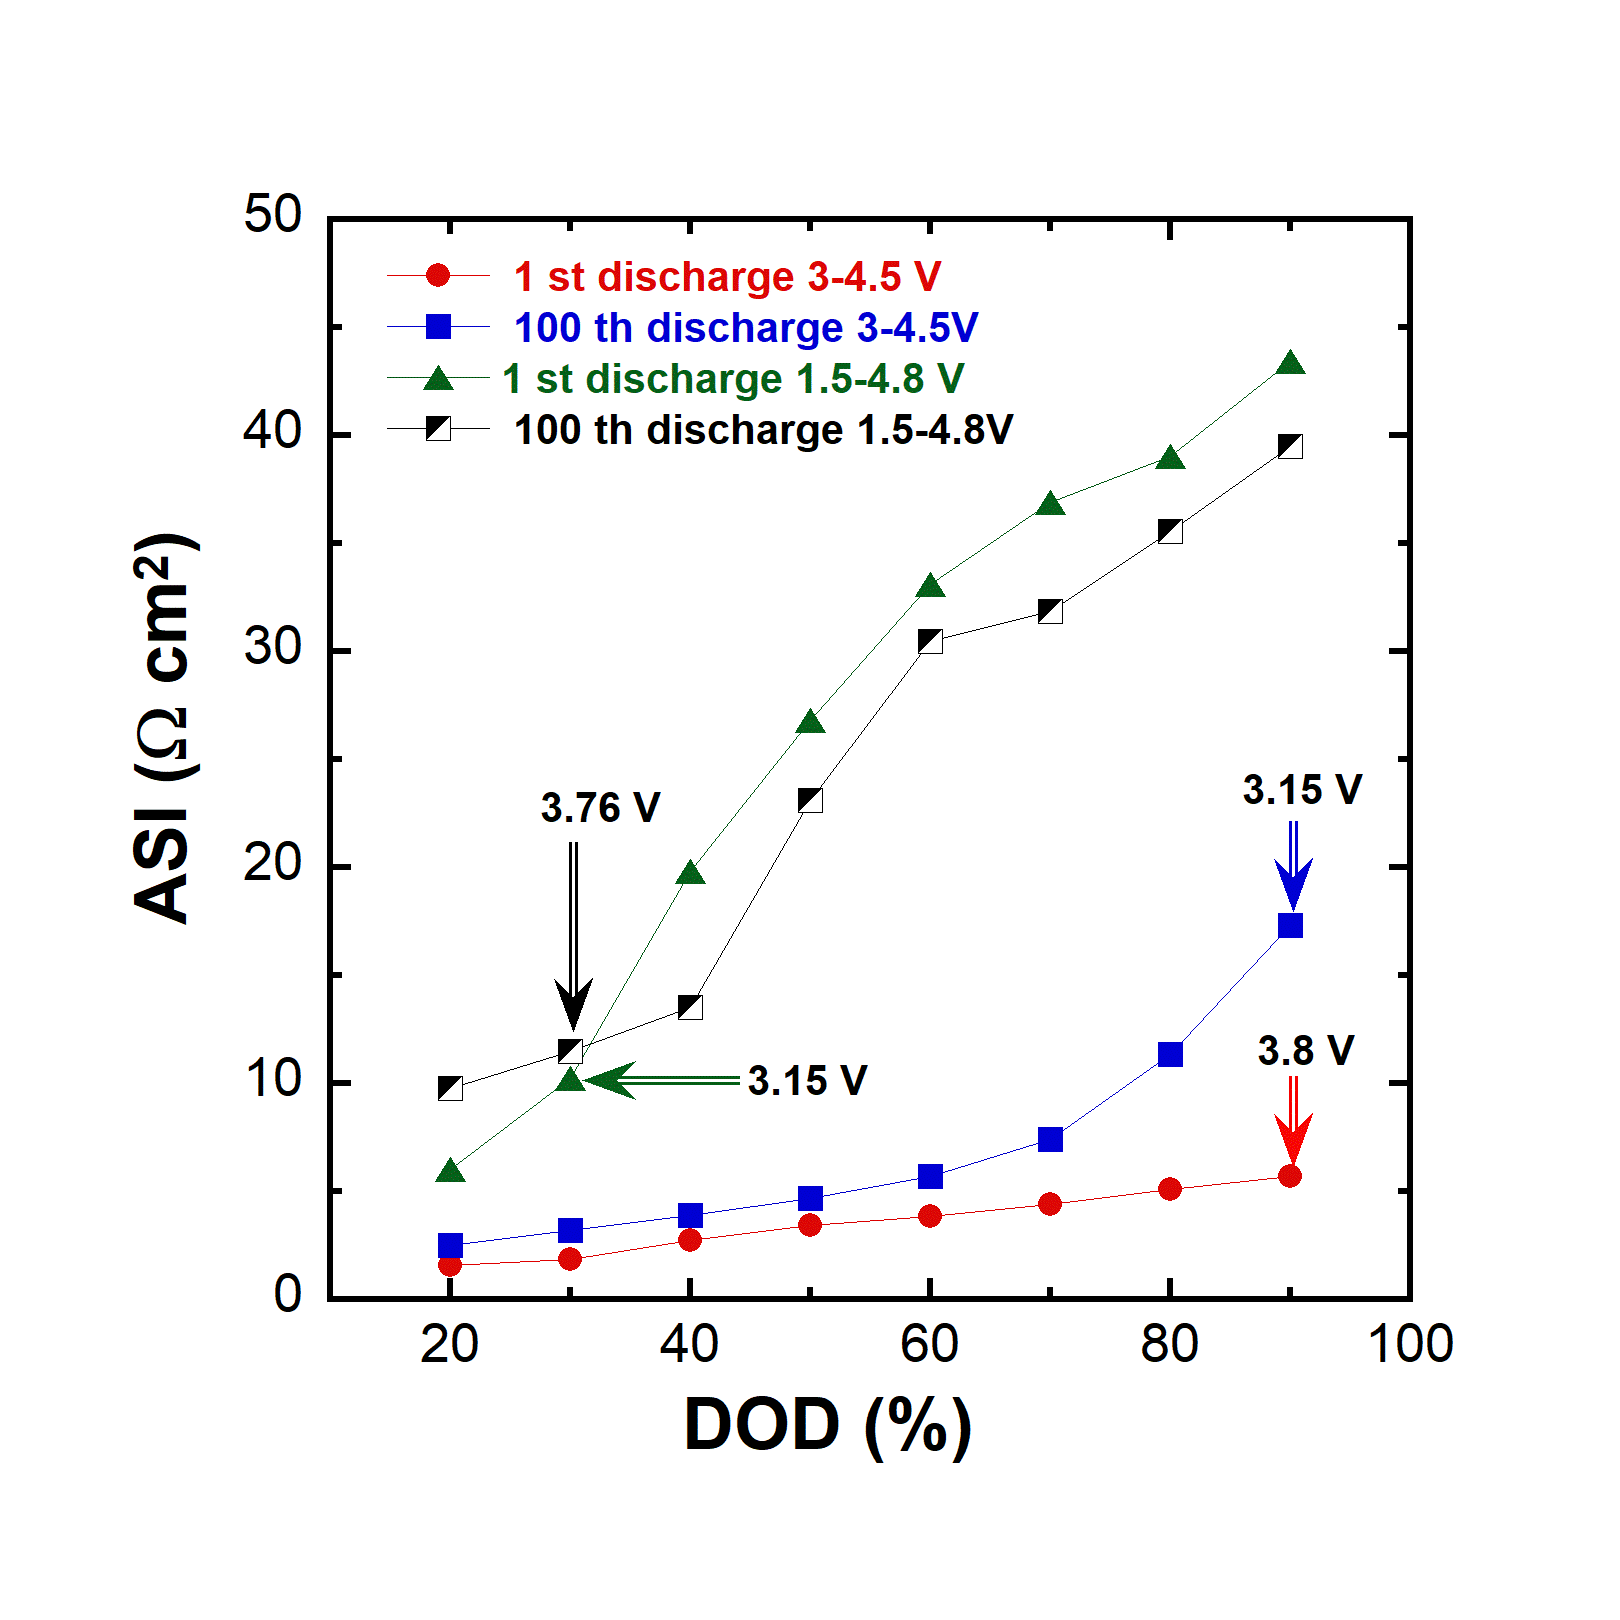
More information on the change in the overall cell potential as a function of the depth-of-discharge (DOD) can be obtained by evaluating the area-specific impedance (ASI) expressed in Ω cm
2, given by the following relation [
70]:
where
A is the cross-sectional area of the electrode, Δ
V =
OCV −
Vcell is the potential change during current interruption for 60 s at each DOD value, and
I is the current passed throughout the cell. Various factors can affect the area-specific impedance, including ohmic drop, Li-ion transport through the electrolyte, and solid-state diffusion within the electrode. Moreover, the ASI does not need to reach equilibrium conditions as in the case of EIS, which makes this technique more representative of the total internal resistance evaluation during cycling. displays the variation of ASI of the LMO900 electrode for the 1st and 100th cycles at 0.7 C rate in the narrow and extended voltage windows. At 20% DOD, the ASI values at the 1st cycle are 1.5 and 6 Ω and increased to 2.5 and 9.7 Ω, after the 100th cycle for the narrow and extended voltage window, respectively. At 90% DOD, the ASI value at the 1st cycle (5.7 Ω) increased to 17 Ω after the 100th cycle for the narrow voltage window (3.0–4.5 V). At the same DOD (90%), the ASI values at the 1st cycle (43.4 Ω) decreased to 39.4 Ω after the 100th cycle for the extended voltage window (1.5–4.8 V). These results indicate that the charge-transfer resistance is dependent on DOD as well as the aging of the electrode. This resistance increases systematically with increasing DOD, as noticed from the narrow voltage window 3.0–4.5 V. For the extended voltage range of 1.5–4.8 V, upon closer examination, as depicted in , particularly in the 30–40% depth of discharge (DOD) range, a noteworthy shift (inversion) in the ASI behavior is observed at approximately 32% DOD. This entails a reduction in the ASI values with increased DOD, resulting in decreased charge-transfer resistance. This phenomenon facilitates smoother ion and electron transfer during the charge-discharge process. Comparing the discharge voltages, we observe a consistent increase in ASI values between the narrow and wide voltage windows until the discharge voltage reaches approximately 3 V, corresponding to 32% DOD. At this juncture, it is noteworthy that the voltage value for the wide voltage window is approximately 90% of the discharge voltage range observed in the narrow voltage window, as shown in . Therefore, we conclude that the deep discharge at a potential below 3 V may cause a change in the crystal structure of the cathode and thus a change in the behavior of the ASI. This reduction in ASI values, and hence the increase of Li-ion diffusion, may be attributed to a partial spinel-like order, Li
1+yMn
2−yO
4, and a partial phase transition Li
2Mn
2O
4 from ideal spinel LiMn
2O
4.
. Area-specific impedance of the LMO900 electrode as a function of depth of discharge (DOD) for the 1st and the 100th cycle. Cells were operating in the narrow (3.0–4.5 V) and wide (1.5–4.8 V) potential window at 0.7 C rate.
To characterize the electrochemical performance of the cathode materials, differential capacity (d
Q/d
V vs.
V) plots are important indicators for tracking phase retention during cycling [
34]. The curves d
Q/d
V vs.
V presented in were calculated from GCD data reported in b.
. Differential capacity plots (d<i>Q</i>/d<i>V</i>) vs. <i>V</i> for the LMO900 electrode tested at the 1st and 500th cycle in the potential window 1.5–4.8 V.
The peaks at ~4 and ~3 V in the d
Q/d
V plots correspond to Mn
3.5+/4+ and Mn
3+/3.5+, respectively. In the high potential region, two pairs of redox peaks correspond to the two undistinguished plateaus of b, indicating that lithium-ions were extracted and inserted into the spinel phase by a two-step process. The differential capacity plot at the charge stage had two sharp peaks at 4.03 and 4.16 V, and the discharge stage also showed two sharp peaks at 4.01 and 3.97 V. The peak potential at 2.47 V corresponds to the pseudoplateau arising from the insertion of Li ions into the spinel 16c sites. Regarding the differential capacity after 500 cycles, all redox peaks maintain the same potential position; only their intensity decreases throughout cycling due to the capacity decay of the LMO electrode. The peak potential difference remains unchanged after 500 cycles, indicating the good electrochemical stability of this Li-rich electrode, in which doping mitigates the fading mechanisms. Therefore, the differential capacity analysis clearly shows that introducing excess Li in LiMn
2O
4 significantly decreases the rate of capacity degradation during charge-discharge cycling.
In summary, for the first time, we successfully induced the formation of the tetragonal phase Li2Mn2O4 through long-term electrochemical cycling (over 500 cycles) of the Li-rich spinel Li1.03Mn1.97O3.99 in the extended voltage range of 1.5–4.8 V, taking advantage of this continuous and elusive phenomenon known as Jahn-Teller distortion. Cycling spinel LiMn2O4 in the wide voltage range of 1.5–4.8 V enhances the initial specific capacity and reduces capacity decay more effectively compared to the narrow voltage range of 3.0–4.5 V, even at a relatively high current density of 100 mA g−1. The improvement in electrochemical performance may be attributed to the increased amount of Li+ ions passing through tetrahedral sites or 16c octahedral sites with no face-sharing Mn ions, resulting in lower electrostatic repulsion compared to passing through tetrahedra that share faces with one Mn ion. The Li1.03Mn1.97O3.99 spinel electrode spinel electrode demonstrates superior rate capability (specific capacity at a rate of 100 mA g−1, ~0.7 C) at ambient temperature, coupled with good stability. This is achieved without intentional coating or doping with foreign ions, resulting in improved Li transport kinetics and, consequently, enhanced electrochemical behavior.
Conceptualization, A.M.H.; formal analysis, S.M.A., M.G.F., R.S.E.-T., S.G.M.; investigation, S.M.A., M.G.F., R.S.E.-T., S.G.M.; data curation, S.M.A., M.G.F., R.S.E.-T., S.G.M., A.E.A.; experimentation, A.E.A.-G.; writing—original draft, A.E.A.-G., A.M.H.; writing—review & editing, A.M., C.M.J.
Not applicable.
Not applicable.
The authors declare no financial support for the research, authorship, or publication of this article.
The authors declare that they have no known competing financial interests or personal relationships that could have appeared to influence the work reported in this paper.