Article Open Access
Received: 17 December 2024 Accepted: 07 February 2025 Published: 11 February 2025

© 2025 The authors. This is an open access article under the Creative Commons Attribution 4.0 International License (https://creativecommons.org/licenses/by/4.0/).
As society’s awareness of health risks continues to grow, indoor air quality has become a critical concern in recent years. Prolonged exposure to poorly ventilated areas can expose people to harmful substances, as noted by Lee et al. [1]. Indoor air pollution is mainly caused by volatile organic compounds (VOCs) as reported by Li et al. [2]. These compounds are released from various sources such as electronic equipment, construction materials, consumer goods, indoor fuel gas, coal or oil combustion, and smoking.
To maintain good indoor air quality, it is necessary to decrease the levels of chemical compounds present in the air. When air renewal rates cannot be increased, conventional treatment processes such as filtration and adsorption can be applied. As opposed to these processes, which require a final disposal stage once the media are saturated, it is possible to eliminate organics with destructive technologies. One of the most effective techniques for controlling gas phase pollutants is Photocatalytic Oxidation (PCO). Early applications of TiO2 semiconductors in gas phase showed the technical potential for the photocatalyzed treatment of air to degrade all major classes of VOCs [3]. Heterogeneous photocatalysis is a highly versatile process, with probed efficacy for air and water decontamination [4] and as a promising alternative for green hydrogen and energy production [5]. PCO technology has the potential to mineralize VOCs and produce harmless compounds directly. PCO is a non-selective technology, suitable for many different contaminants, that can operate at room pressure and temperatures, and requires low energy consumption. The principle behind PCO is the absorption of radiation by a solid semiconductor and one of the most studied metal oxides for its photocatalytic activity and properties is titanium dioxide (TiO2). After ultraviolet (UV) radiation is absorbed, pairs of electrons (e−) and holes (h+) are formed on the surface, which can attack adsorbed molecules leading to reduction and oxidation reactions, respectively [6]. To apply PCO for air decontamination, the catalyst needs to be attached or implanted in other materials in the form of walls that can form different structures.
Currently, there are new computational tools for designing and modeling devices that can be manufactured using a 3D printer immediately after being created. Regarding the field of chemical reactions and conventional catalysis, 3d computational tools are being employed to fabricate a variety of catalyst supports [7,8]. Printed structures can be customized in terms of their geometry and chemical composition to meet the specific requirements of a target product, thereby enhancing mass and heat transfer as well as their catalytic performance. Ultimately, those enhancements can lead to a significant increase in the performance of reactors. Digital manufacturing technologies facilitate the integration of the design stage with powerful simulation tools, such as computational fluid dynamics. The combination of these tools allows the development of optimized devices concerning flow patterns and reaction progress [9]. As well as in conventional reactors, 3D tools can be applied for the design of photocatalytic reactors. The complexity of evaluating the distribution of incident photons on the catalytic surfaces is the key aspect in this field and their optimization is challenging. Photocatalytic substrates can be designed to make raw materials be used more efficiently, leading to reduced costs. The selection of the substrate material for a PCO system is crucial because many properties of the reactive system depend upon it. Ultimately, the performance of a photocatalytic reactor is directly affected by absorbed fraction, catalyst load, and coating adherence. The catalyst immobilization method is very relevant to the reactor performance. Common techniques for TiO2 coating include dip-coating, spray sputtering, physical and chemical vapor deposition, and sol-gel synthesis for generating external layers of catalyst. On the other hand, catalytically active materials may be dispersed in a matrix. Indeed, there have been efforts to combine the 3D printing advantages while doping the printing material [10,11], but their specific efficiency may suffer because of radiation penetration issues. There are other studies focused on the 3D-printed designs of photocatalytic reactors at a micron-scale precision. Despite the numerous studies conducted on this topic [12,13], a thorough analysis of the optical properties of photocatalysis applications in 3D printing has not yet been performed to the author’s knowledge.
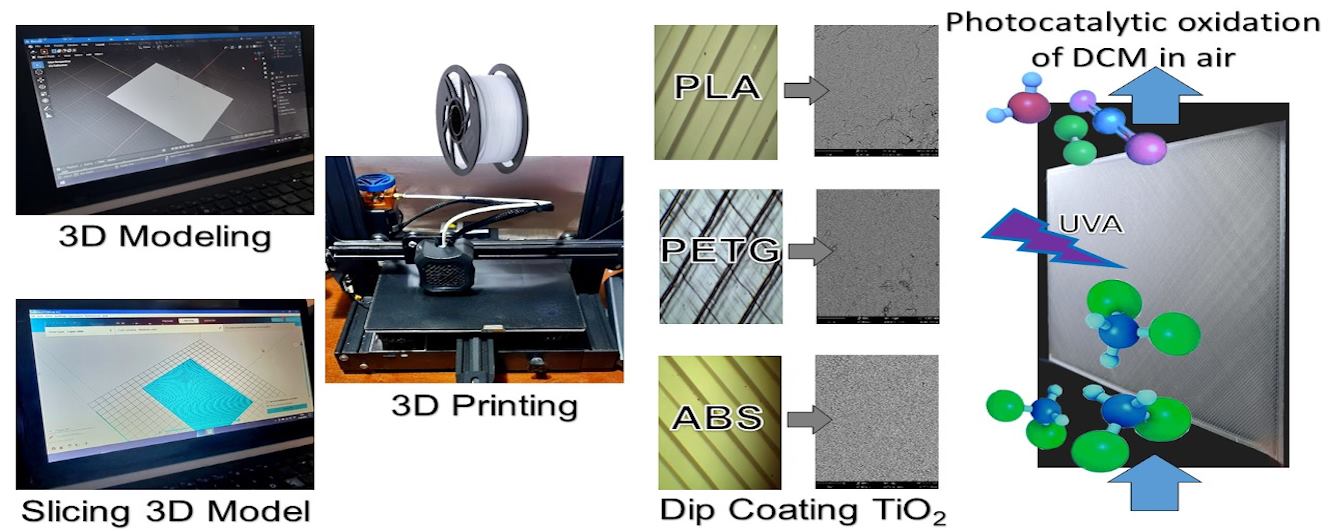
In this direction, our research is currently centered on the evaluation of commercial polymers used in 3D printing and evaluating them for their application in air cleaning with PCO. Our search is to combine the two simplest techniques in each case: 3D printing of commercial and economical filaments, coating them using a pure TiO2 suspension, and dip-coating. For the development of the work, three different types of polymeric materials used as substrates are evaluated and contrasted: Polylactic Acid (PLA), Acrylonitrile Butadiene Styrene (ABS), and Polyethylene Terephthalate Glycol (PETG). The main aspect of evaluating these materials is the photocatalytic activity of plastics coated with titanium dioxide. In this study, dichloromethane (DCM) was selected as a representative VOC since it is a typical indoor air pollutant, often found indoors at concentrations several times higher than outdoors [14]. Environmental agencies classify DCM as a hazardous and toxic compound, requiring strict control and treatment [15,16]. For instance, the OSHA standard sets a permissible exposure limit of 25 ppmv of DCM in air for an eight-hour period [17]. Gas-phase photooxidation of DCM was used in investigating heterogeneous photocatalysis, both in regards to degradation rates [18], and possible degradation pathways [19]. To carry out the photocatalytic activity tests, a laboratory-scale flat plate photoreactor was designed and built; in this reactor the internal catalytic surface was 3D-printed. Near UV lamps are used as a radiation source for the removal of DCM present in an air stream. Since these 3D-printed plastics can be modeled in infinite shapes and structures, the results of the work will provide information on which material could be most useful for the design of new devices for air decontamination with the possibility of optimizing the utilization of effective photocatalytic area with different distribution patterns in the reaction volume.
Three commercial materials used in 3D printing were chosen for the immobilization of the catalyst: Polylactic Acid (PLA), Acrylonitrile Butadiene Styrene (ABS), and Polyethylene Terephthalate Glycol (PETG). The polymers were selected for their availability, affordability, and compatibility with FDM 3D printing. These materials are the most widely used globally. Each represents different plastic classes: PLA (biodegradable), ABS (engineering-grade), and PETG (semi-transparent). PLA is chosen for its sustainability and ease of printing, while ABS provides superior mechanical properties and UV durability. PETG’s semi-transparency suits optical applications like light transmission in photocatalytic systems. Additionally, PMMA is not easily available in our country, and PETG outperforms PET in chemical resistance and moldability.
Filaments of each material were used to print rectangular flat plates that were utilized to determine the catalyst loading, optical properties, and photocatalytic activity tests. Table 1 summarizes the main characteristics and features of the three plastic filaments. Interestingly, as of January 2025, the cost of a spool of each of these polymers is very similar in Argentina, around 18 USD/kg.
Table 1. 3D Printed Polymer properties.
| Commercial Name | PLA | ABS | PETG |
|---|---|---|---|
| CAS name (Number) | Polylactic acid (26100-51-6) | Acrylonitrile-butadiene-styrene copolymer (9003-56-9) | Polyethylene terephthalate glycol (25038-91-9) |
| Molecular formula | (C3H6O3)x | (C8H8·C4H6·C3H3N)x | C14H20O5S |
| Density (g/cm3) | 1.21 | 1.04 | 1.27 |
| Melting point (°C) | 180 to 220 | 240 | 240 |
| Solubility in water | In hot water | insoluble | insoluble |
| Glass Transition Temperature (°C) | 50–80 | 105 | 80–85 |
| Aging under UV (a) | 5–6% (b) | 10% (c) | 30% (b) |
| Extrusion Temperature (°C) | 220 | 245 | 240 |
| Bed Temperature (°C) | 65 | 80 | 75 |
(a) measured as % loss in tensile strength. (b) Amza et al. [20]. (c) Fiorio et al. [21].
To generate the supports, a 3D Ender-3 V2 115/230V printer (Shenzhen Creality 3D Technology Co., Ltd., Shenzhen, China) was used with the Fused-Deposition Modeling (FDM) technique. This process involves the controlled deposition of molten thermoplastic materials layer by layer. The plastic filaments are fed into an extrusion nozzle, heated, and then deposited onto a build platform according to design specifications. The nozzle follows a predetermined route to create the desired object, while the melted plastic layers fuse as they cool and solidify, gradually building up a three-dimensional object. With all three materials, the nozzle diameter, the layer thickness, and the printing speed were 0.5 mm, 0.2 mm, and 50 mm/s, respectively. Table 1 shows the extrusion and hot bed temperatures used in this work for each material, which are very similar to those recommended by the manufacturers.
Aeroxide P25 (Evonik, Essen, Germany) is one of the most employed catalysts in environmental applications, with extensively reported properties in the literature [22]; it was used as provided by the manufacturer, without any additional processing. This commercial catalyst is composed mainly of crystalline TiO2 with an anatase/rutile ratio of ~5.5, and around a 10.0 wt% amorphous phase [22]. The catalyst was immobilized onto the samples by a series of dip coating cycles. A 100 g/L suspension of pure titanium dioxide was made using distilled water. Before each coating cycle, the suspension was kept for 1 h in a magnetic stirrer to homogenize the catalyst concentration.
To augment the quantity of fixed catalyst, we performed the coating procedure numerous times. The process involved submerging each sample in a vessel containing the recirculated suspension that was mixed with the aid of a peristaltic pump. After precisely one minute, we carefully evacuated the vessel at a controlled rate of 10 cm/min. Once extracted, we allowed the samples to air-dry for 15 min before placing them on a stove preheated to 50 °C for an hour.
To deliver DCM vapor inline, we used a custom-made pressurized gas cylinder. We started by using a vacuum pump to evacuate a gas tube. Then, we introduced a small amount of pure liquid DCM (Sintorgan, Villa Martelli, Argentina, reagent grade) into the tube using an automatic micropipette and opening the tube’s valve for a few seconds. Finally, we connected the tube to an oil-less air compressor and filled it up to a pressure of 115 psi.
Gas chromatography with a flame ionization detector (GC-FID) was employed to measure concentrations of DCM at the inlet and outlet of the reactor. The gas chromatograph (HP 5890) was operated in splitless mode using nitrogen as a carrier; the injector temperature was set at 170 °C, the detector at 250 °C, and the oven at a constant 40 °C. A calibration curve was created for DCM response in GC-FID using a static headspace method [23].
A demountable sandwich-type reactor was constructed and mounted, with a central 3D-printed flat plate of plastic coated with TiO2. The two outer layers are acrylic frames and windows with airtight seals; the acrylic of the windows is transparent to the UV rays. To avoid external mass transfer limitations to the catalyst surface, the internal reactor thickness is 6 mm and the plate is located at the midpoint between windows. The radiation sources are two boxes of actinic lamps (Sylvania F15W T12) which provide a uniform flux over the catalytic plates. Table 2 provides a summary of the reactor’s dimensions and operating conditions.
Table 2. Specifications and operating conditions of the reactor.
| Reactor Dimensions | Value | Units |
|---|---|---|
| Length | 10 | cm |
| Width | 15 | cm |
| Thickness | 0.6 | cm |
| Total Catalytic area | 300 | cm2 |
| Operating conditions | ||
| Inlet DCM concentration | ~50 | ppmv |
| Total flow rate | 1 | L min−1 |
| Radiation flux | 28.0 | W m−2 |
| Wavelength range of radiation | 300–400 | nm |
| Temperature | ~25 | °C |
| Relative humidity | ~15 | % |
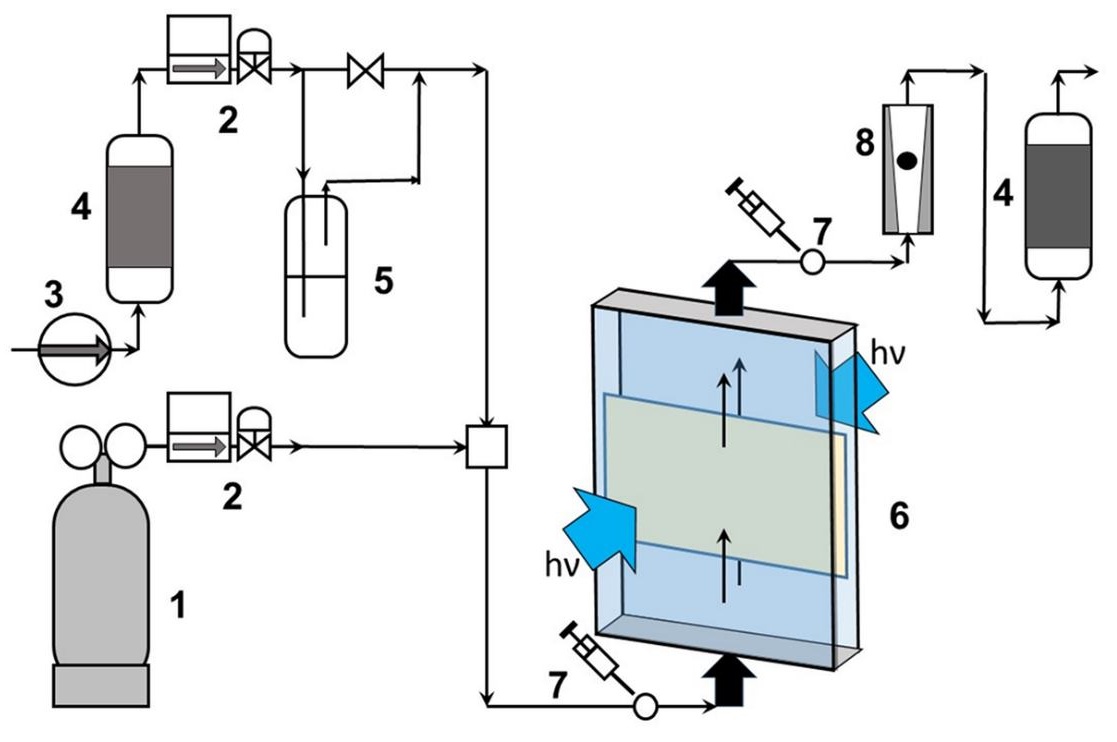
DCM oxidation tests were performed in a fixed bed continuous flow one-pass reactor operated at atmospheric pressure. The complete reaction system layout is presented in Figure 1. A compressor powers the pneumatic circulation, and the air stream is filtered through two columns of activated carbon and silica gel. The mass flow controllers are regulated to achieve the desired concentration of DCM at the reactor inlet. A continuous air stream feeds the reactor with a constant concentration of DCM and relative humidity. A flow distributor was installed at the inlet to achieve a well-developed velocity profile across the reactive plate. It is worth noting that the residence time in the reactor is just 4.5 s.
To test the photocatalytic activity, the pollutant-filled air is circulated in the reactor until the inlet and outlet concentrations become constant. After reaching a steady state, the plate is irradiated and the outlet concentration is measured periodically. The conversion is calculated when no significant changes over time are observed.
The irradiance level at the reactor windows was measured with a portable radiometer (Ocean Optics USB2000 + UV-VIS-ES). The optical properties of the polymer plates were analyzed with an integrating sphere accessory in a spectrophotometer (Optronic OL50) to determine total reflectance and transmittance.
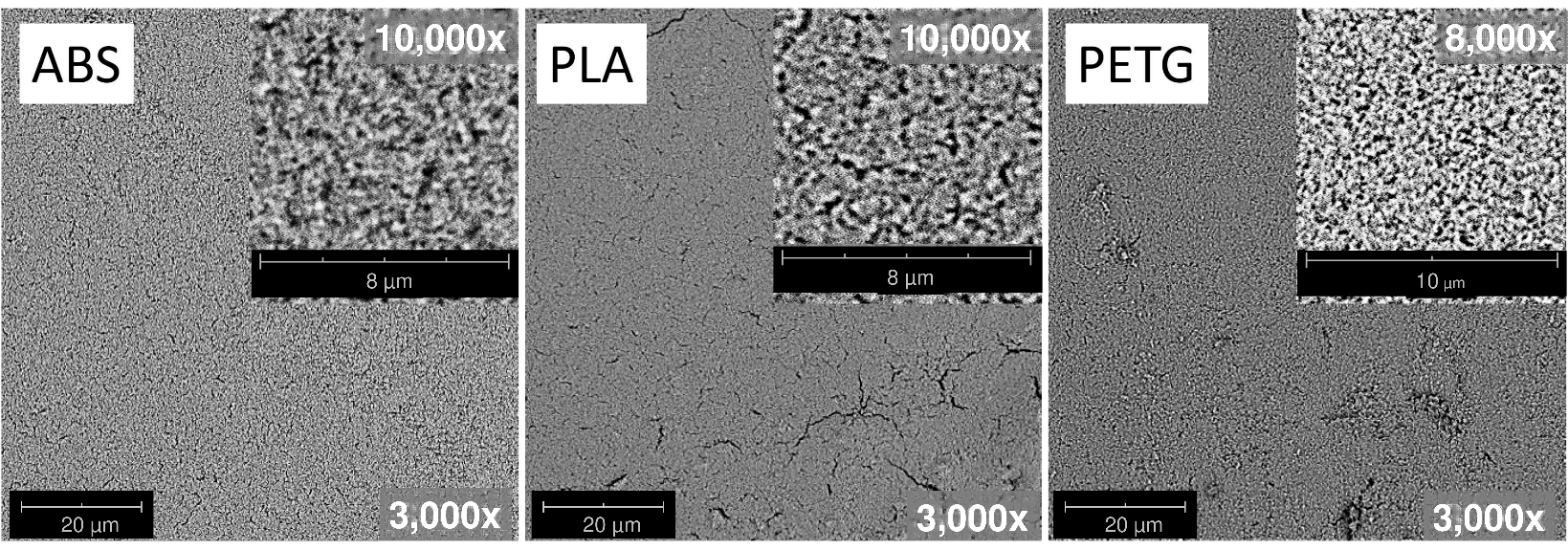
A microscopic inspection of the coatings over the different substrates was performed. Samples have been inspected and photographed by scanning electron microscopy (SEM) (Phenom-World Pro). The plastic samples (1 cm × 1 cm) were put inside the vacuum chamber and observed at different magnifications; the selected images are shown below in Figure 2.
Figure 2 shows micrographies of the samples after 8 coating cycles, at 3000× magnification for each tested material. A complete coverage of all the polymeric substrates can be seen, with a reasonable uniformity distribution of the catalyst over the entire surface. In the PLA sample, small micro-cracks can be seen, probably due to the thermal expansion of the film, while in PETG, some regions with micro-clusters of TiO2, from 0.3 to 0.47 μm in size, can be observed, which may be due to imperfections in the material surface. The ABS surface shows the most homogeneous distribution of the catalyst.
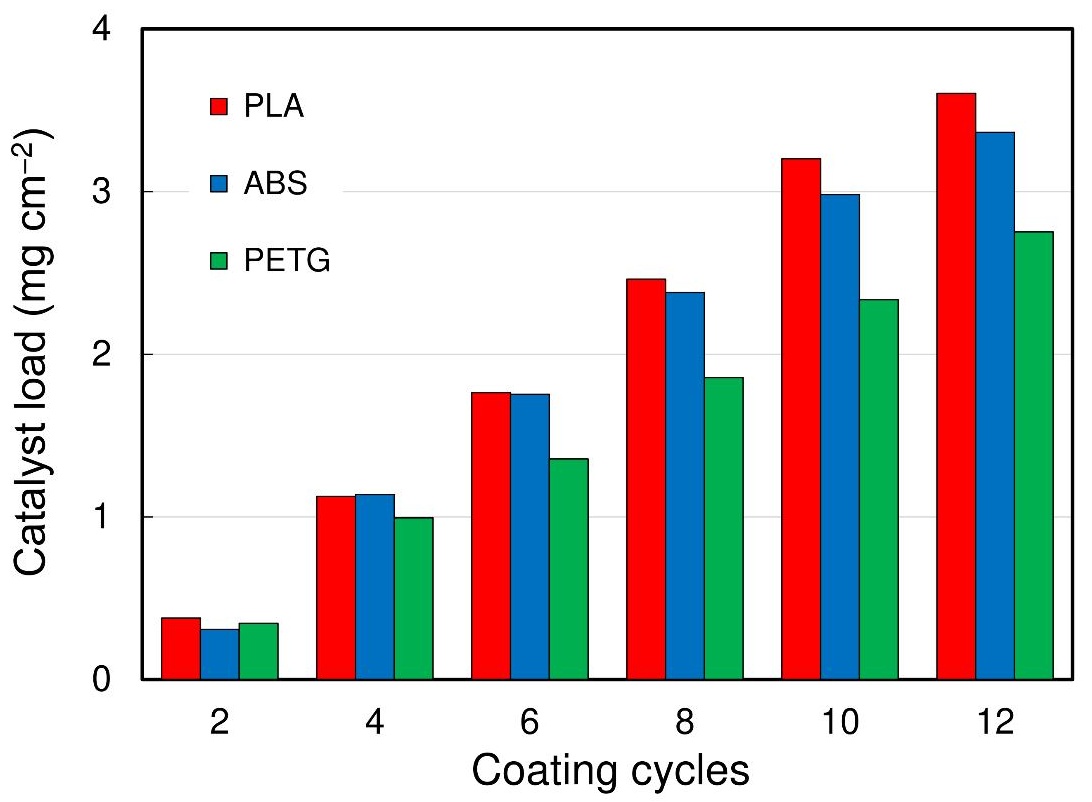
During the evaluation process of the materials, one of the first parameters that were considered was the catalyst load on different samples. The weight of each sample was recorded after each immobilization cycle, which included dip-coating and drying. As shown in Figure 3, the amount of fixed catalyst increased proportionally with the number of coating cycles. All three materials incorporated catalysts in the same order of magnitude, with PLA having the largest load per unit area. PETG, on the other hand, had a lower capacity for adding catalysts.
After 12 immobilization cycles, the superficial catalyst loads achieved for the different materials are approximately 2.75 mg·cm−2 for PETG, 3.36 mg·cm−2 for ABS, and 3.6 mg·cm−2 for PLA. To provide a reference point regarding the capacity of these materials to support the catalyst, we can compare them to coatings on stainless steel meshes (25 mesh size). Following a procedure reported in the literature [24], after performing 4 coating cycles, a catalyst load of approximately 3.0 mg·cm−2 is reached.
The catalyst film is adhered to the substrate but may eventually be detached. In this sense, we selected an additional parameter for the substrate comparison, a test for catalyst adherence.
To evaluate the resistance of the adhered films in high-stress conditions, the coated samples were tested in an aqueous medium using the ultrasonic method, as per the methodology described in the literature [25]. Although the coated materials will be used for gaseous streams in our case, a milder condition, we deemed this to be a valid comparative examination. The test consists of the measurement of the weight loss caused by the exposition of the sample to ultrasound waves. The coated samples were immersed in distilled water and then subjected to a 2.5-min ultrasonic bath using a Biobase® Ultrasonic Cleaner at maximum power and room temperature. Following this, the samples were dried on a stove at 50 °C for 4 h. The weight loss was calculated by comparing the mass of the samples before and after the ultrasonic test. The results of the adherence test showed a lower adherence of the coating on PETG with a remaining adhesion (expressed as the percentage of remaining TiO2 mass) of approximately 45%. On the other hand, ABS and PLA presented similar behavior, with a remaining adherence of between 67 and 71% for ABS and between 70 and 72% for PLA.
The adhesive and cohesive strength of TiO2 films could be of further investigation—but left out of our scope—considering factors such as thickness, application techniques, pretreatments of the substrates, and number of coating cycles. Nonetheless, it’s important to note that the adhesion testing method used here puts more stress on the materials than what is expected in gas phase operation. During the photocatalytic activity tests, there were no instances of catalyst detachment observed.
The absorbed fraction of a film supported on any material, defined as the ratio of absorbed radiation to incident radiation, is an indirect property that can be calculated from reflectance and transmittance measurements. Among the materials studied, PLA and ABS are opaque within the relevant wavelength range. In contrast, PETG is semi-transparent, allowing for the application of models to determine the radiation absorbed fraction of catalyst layers as a function of wavelength. In this discussion, we will propose a simple model to explain the chemical conversion of DCM based on the absorbed fraction. We will focus exclusively on PETG, as it has measurable, non-zero transmittance, while PLA and ABS are opaque, resulting in negligible transmittance for those materials.
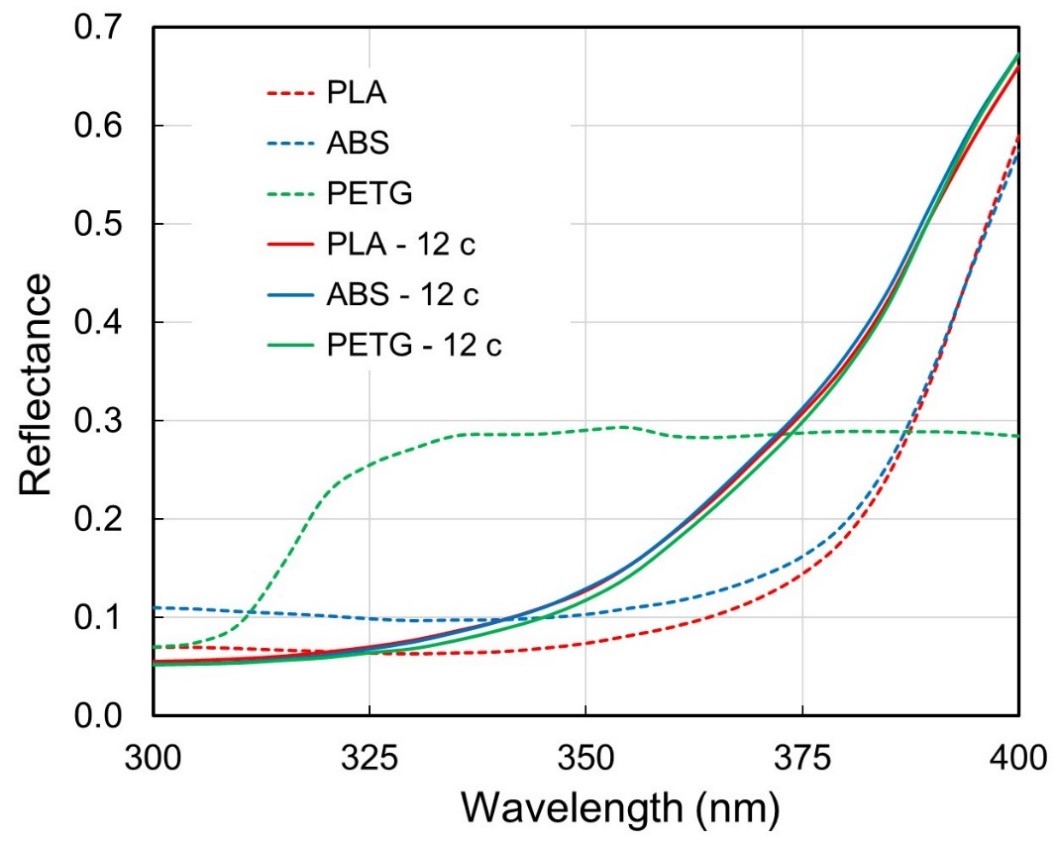
The reflectance and transmittance of bare support materials and coated samples were measured in the range of lamp emission power wavelengths (300–400 nm, 5 nm intervals) and depicted in Figure 4.
Figure 4 illustrates that the spectral reflectance curves for the three uncoated plastics differ significantly, particularly the curve corresponding to PETG. In contrast, the total reflectance curves of all coated samples are nearly identical. This similarity can largely be attributed to the properties of the catalyst. Because the catalyst loads are high and comparable (equal to or greater than 3 mg·cm−2), the films exhibit very similar optical behaviour, regardless of the support material used. Consequently, the radiation model developed for PETG can also be considered valid for ABS and PLA.
Based on the net-radiation method proposed by Howell et al. [26], it is possible to calculate the absorbed fraction (A) of the photocatalyst layer simply by:
In Equation (1), T is for transmittance, and R is for reflectance. Notice that these are spectral properties; in the following equations, the subscript will be dropped for the sake of clearness. The values of T and R of the catalyst layer are derived from the measured values of diffuse reflectance and diffuse transmittance of both the bare and the TiO2-coated materials. Given that the plastic samples are coated on both sides, the equations relating to the optical properties are [27]:
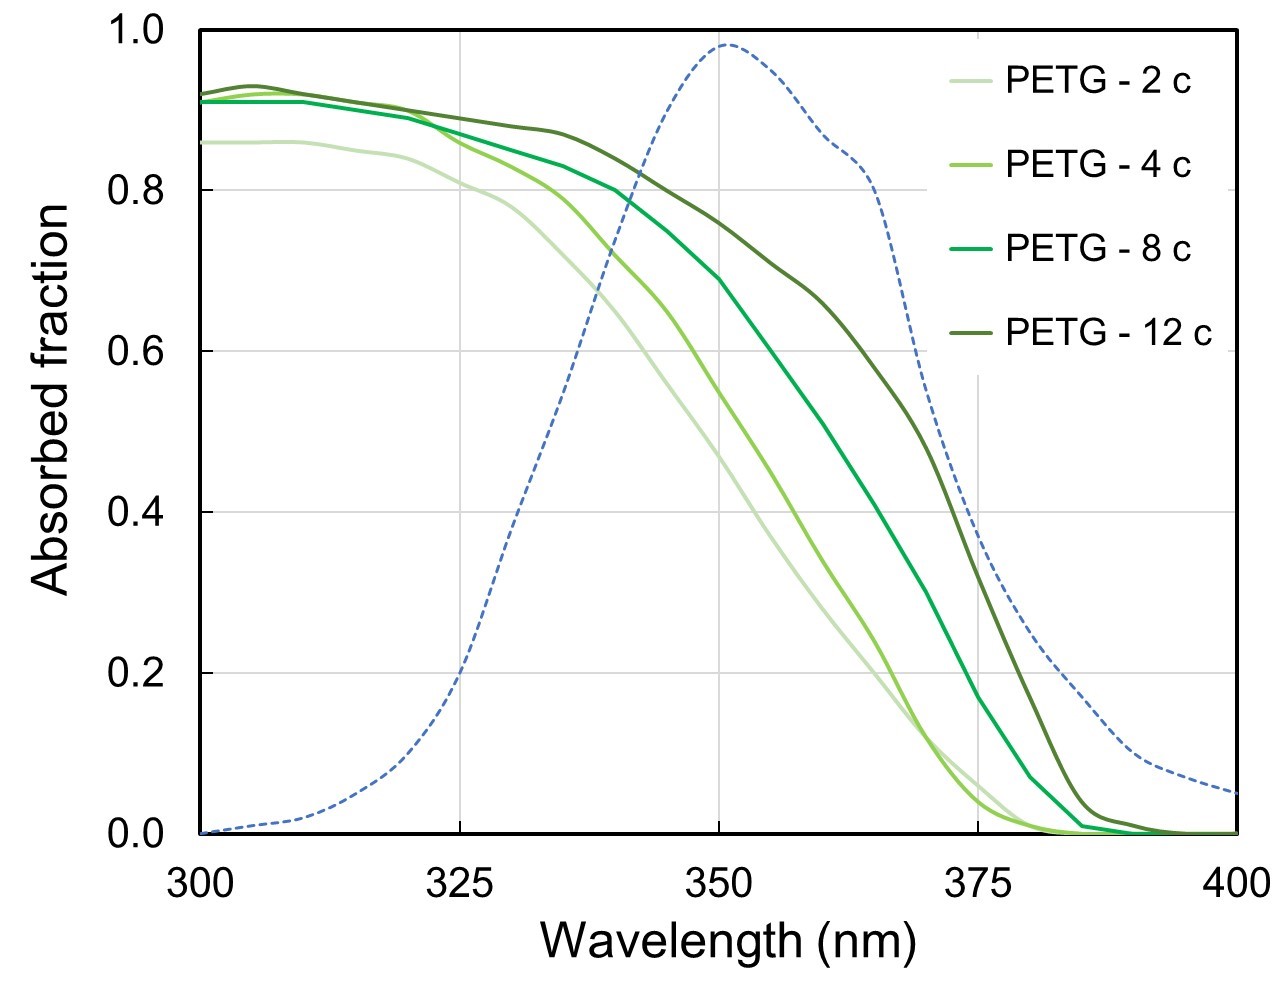
where the subscript c refers to the catalyst layer, s to the support material, and g to the global optical property of the composite medium: catalyst-support-catalyst. a radiation balance for the catalyst (Equation (1)), and the obtained values are plotted in Figure 5.
The parametric curves show an increasing absorbed fraction with the number of catalyst immobilization cycles. The normalized radiative output power of the lamps employed can weigh the curves plotted in Figure 5. Calculating the incident radiation flux over the samples would yield the local superficial rate of photon absorption for each sample. The y-axis in Figure 5 is a normalized scale; it represents the spectral absorbed fraction of radiation (parametric curves) and the spectral emission of the lamp, relative to its peak. It is worth noting the steep decline in the absorbed fraction to reach almost null absorption for wavelengths larger than 380 nm; this result is consistent with the bandgap absorption of the P25 catalyst.
To investigate the degradation of DCM in the reaction device, several blank tests were conducted. Firstly, the air supplied by the purification system was analyzed and no peaks were detected in the chromatogram, indicating no unwanted substances were present. Secondly, a blank test for photolysis was carried out by circulating the DCM mixture in the reactor with an uncoated plate (with no catalyst) and exposing it to maximum power. Finally, an additional test was done using the TiO2-coated samples inside the reactor and lamps powered off. There was no significant difference between the concentrations of DCM at the inlet and outlet of the tests, suggesting steady-state operation without photolysis or dynamic adsorption phenomena.
Experimental runs were conducted for each material sample, with identical dimensions, by varying catalyst coating cycles to measure photocatalytic activity. To ensure comparability of results, all operating variables were controlled, including inlet DCM concentration, total flow rate, radiation flux, and relative humidity. The details concerning operating conditions are summarized in Table 2.
Each experimental run in the continuous reactor requires measurement of the inlet (Cin) and outlet (Cout) concentrations of DCM. At the beginning of the air circulation, before the lamps are turned on, samples are taken until Cin stabilizes at a constant value. Once this is achieved, the lamps are turned on; during the illuminated period samples are taken until Cout no longer changes over time. Finally, the lamps are turned off to check that the values of Cin (which is monitored during the whole reaction) and Cout match in the absence of radiation. The steady-state concentrations are then used to calculate the DCM conversions for each sample by:
Table 3 summarizes the experimental results of DCM degradation for different coating cycles for the three plastic samples. All runs were done with a 50 ppm inlet concentration and maximum radiation. The variability indicated in the conversion column corresponds to one standard deviation of the mean value.
Table 3. Photocatalytic activity results.
| Material | Coating Cycles | TiO2 Mass (mg) | DCM Conversion (%) | ΔC (ppm) | ΔC/mcat (ppm/g) |
|---|---|---|---|---|---|
| ABS | 4 | 92.7 | 8.22 ± 1.0 | 4.2 | 44.96 |
| 8 | 398.7 | 15.77 ± 2.4 | 8.6 | 21.63 | |
| 12 | 1020.9 | 19.00 ± 3.9 | 12.9 | 12.68 | |
| PETG | 4 | 129.0 | 9.09 ± 1.5 | 5.0 | 38.57 |
| 8 | 284.7 | 14.95 ± 2.6 | 8.3 | 29.09 | |
| 12 | 883.2 | 20.58 ± 1.6 | 9.5 | 10.76 | |
| PLA | 4 | 288.9 | 14.09 ± 2.6 | 7.8 | 26.83 |
| 8 | 683.1 | 17.11 ± 2.1 | 9.4 | 13.82 | |
| 12 | 1161.3 | 22.81 ± 1.7 | 12.4 | 10.66 |
Throughout the use of the coated plates, there were no signs of aging or catalyst poisoning; different runs were repeated, and no significant changes were observed as a function of the time of use. From the results in Table 3, it is evident that, although the conversions get higher when increasing the number of coating cycles, the intrinsic performance does not follow such a trend. The last column in Table 3 represents the DCM destruction efficiency per mass of the catalyst, which indicates the degree of utilization of each immobilized TiO2 particle. As more layers of catalyst particles are added, it is natural that the first ones are not exposed to radiation or come in contact with the pollutant. Consequently, the ratio of pollutant moles reduced per mass of catalyst has an inverse relation with the number of coating cycles.
The results in the last column of Table 3 show a decrease in the DCM concentration per gram of fixed catalyst (ppm/g) of 45.0 (ABS), 38.6 (PETG), and 26.8 (PLA). These values may be contrasted with a previously published study [24]. Using a stainless steel mesh as support, with four coating cycles, 45.9 ppm of DCM were converted per gram of fixed TiO2, under similar conditions. The result is very similar to that obtained using ABS in the present study. It is worth noting that the comparison is performed against the number of coating cycles because of the different catalyst loadings achieved in the three plastics.
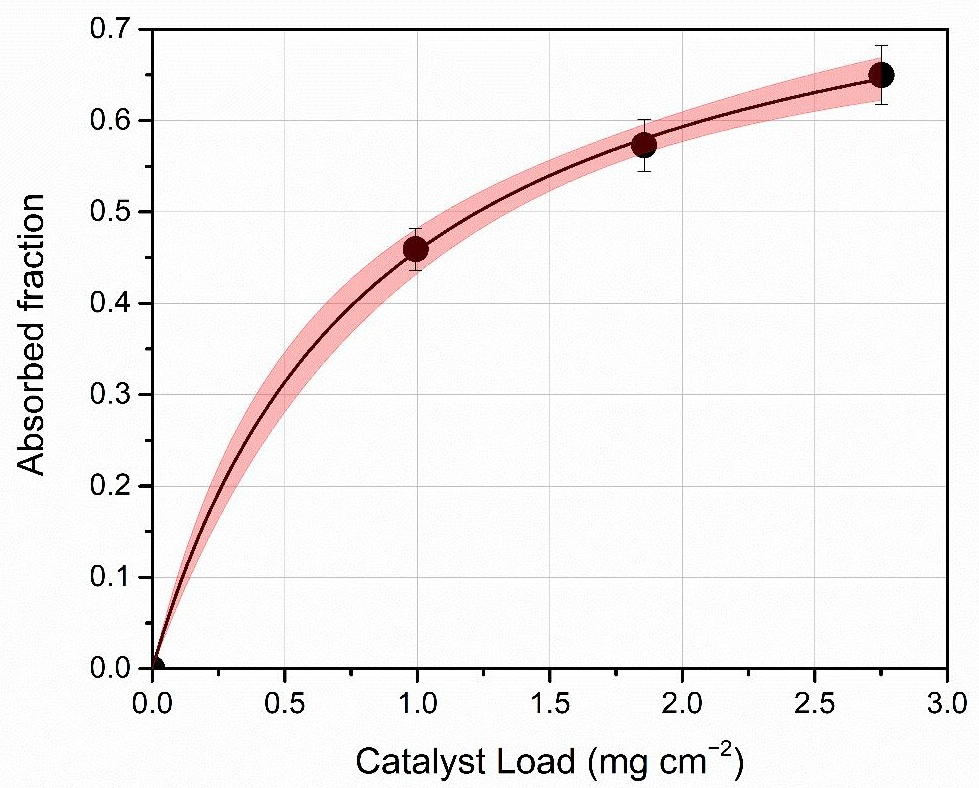
By observing the results of the absorbed fraction by the catalyst layers, a saturation phenomenon could be seen. This allows us to propose a simple model of the absorbed fraction as a function of the superficial catalyst load (Lc) in the following terms:
where Ac,∞ represents the absorbed fraction of an infinitely thick layer of catalyst, and kc is a fitting parameter. Figure 6 shows the experimental points and the fitted model. The obtained values of the parameters are Ac,∞ = 0.8439 ± 0.0201 and kc = 0.8446 ± 0.0624 mg·cm−2; with R-squared = 0.99955.
According to the obtained parameters for Equation (5), it would be enough to reach approximately 3 mg/cm2 of TiO2 since for this value the absorbance no longer increases because there is a saturation phenomenon.
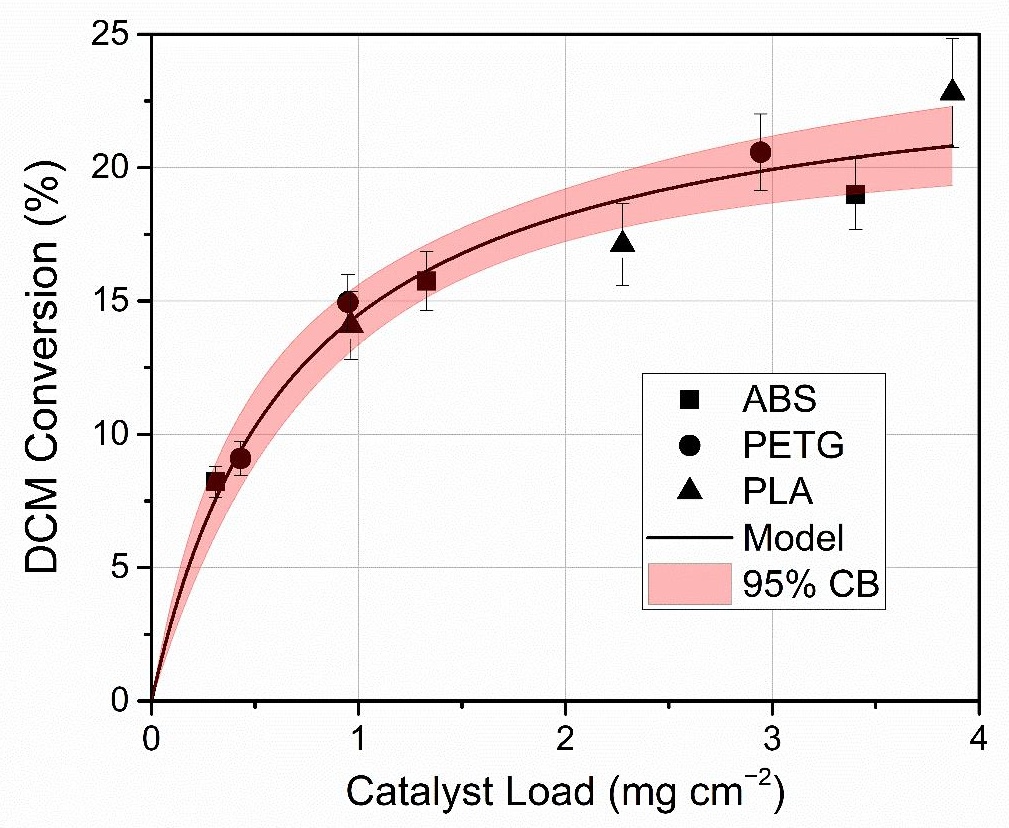
An additional result is the trend of the DCM conversions versus the TiO2 loading for all three materials studied, which is shown in Figure 7.
It is evident that the support material loses relevance and the conversion is merely due to the attached photocatalyst. Also noticeable is a nonlinear trend for conversion, which can also be thought of as a saturation phenomenon. A Langmuir-type function was proposed to fit the experimental points:
The parameter estimation yielded the following values: Xmax = 24.548 ± 1.276 (%) and kx = 0.6946 ± 0.1197 (mg·cm−2); with R-squared = 0.9711. According to this model, the maximum achievable conversion, for Lc tending to infinity, is 24.55%. Based on the model, adding more catalyst layers will increase pollutant conversion, but the efficiency gain will decrease. This is because the photons and pollutant molecules can’t reach the deepest layers of the catalyst. This raises the question of how many cycles of catalyst immobilization should be done. As the number of coating cycles increases, pollutant conversion increases but with diminishing returns. In this sense, it would be reasonable to think that there is an economic optimum for the catalyt’s loading. Additionally, there could be issues with adherence as the catalyst layer becomes thicker.
Here it is very important to clarify how the variables used affect the decomposition reaction rate of the pollutant (rDCM). This rate, averaged over the reactor volume, can be obtained from a global mass balance for DCM, resulting in:
Given fixed values of the flow rate (Q), the catalytic area (Acat) and the reactor inlet concentration (Cin) in Equation (7), as in our case, the reaction rate is directly proportional to the conversion. Therefore, whether we talk about conversion or reaction rate makes no difference.
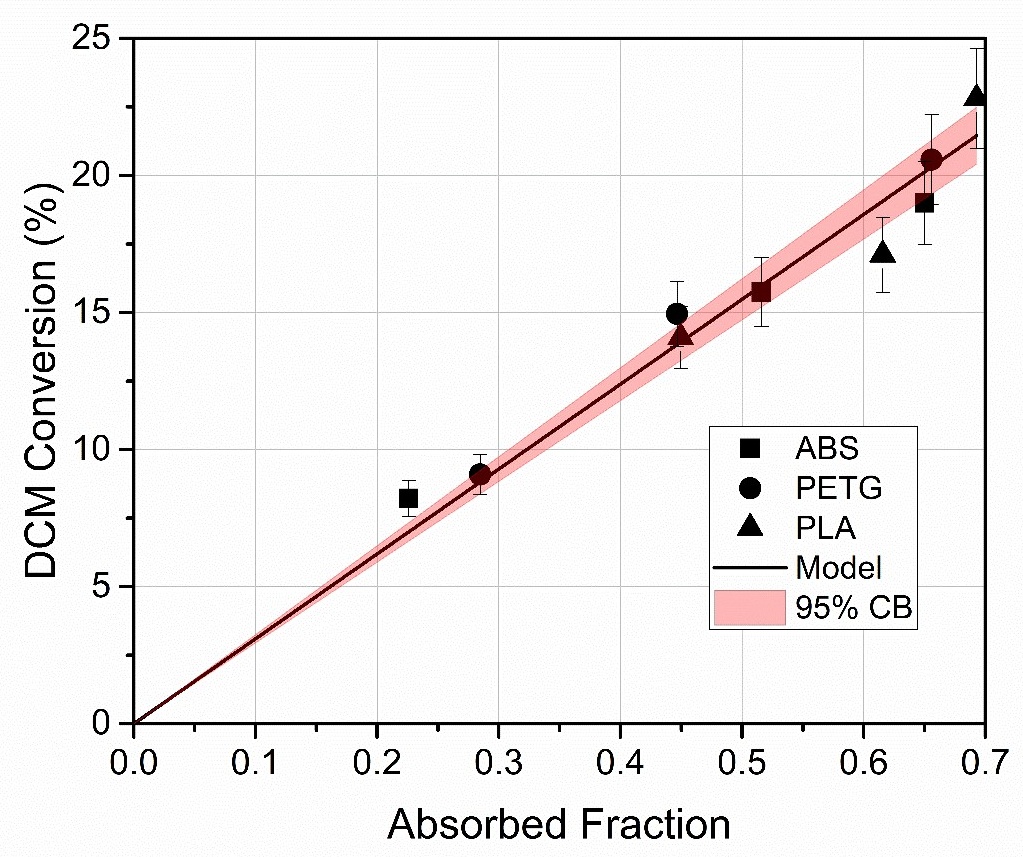
The catalyst load has been used as a reference for analysis as a fundamental variable. However, since the relationship between the load and the absorbed fraction (as illustrated in Figure 6) and the relationship between load and conversion or reaction rate (shown in Figure 7) demonstrate nearly identical behavior, it is evident that the key variable influencing the reaction rate or conversion is the absorbed fraction. Therefore, in photocatalytic reactors, the primary factor is the absorbed fraction of radiation, which directly reflects the catalyst’s efficiency in absorbing radiation for the reaction. This efficiency should be incorporated as a factor in a kinetic expression, similar to how catalyst efficiency is represented in conventional (thermal) fixed-bed catalytic reactors.
The radiation absorption efficiency implicitly contains the catalyst loading via Equation (5). As a novelty, we can demonstrate this by plotting the conversion, or reaction rate (using Equation (7)) as a function of the absorbed fraction, as shown in Figure 8.
The linear adjustment yielded the following parameters: slope = 30.96 ± 0.66 with an R-square: 0.9955.
Finally, to make a well-founded selection of the most suitable plastic for its functionalization, a multi-parametric comparison is made. The comparison criteria in Table 4 include intrinsic material properties as well as photocatalytic performance-related results.
Table 4 summarizes three major useful items for comparison: (i) material properties, (ii) manufacturing process, and (iii) performance. Recalling the information in Table 1 we can explain the rating in the material properties variables: PLA, a biopolymer derived from natural sources such as corn starch or sugar cane, is biodegradable under certain conditions; PLA polymers have been identified as a potentially viable alternative to petroleum-based products. Bio-based degradable polymers have been demonstrated to have numerous applications in the biomedical field and are used as disposable packaging materials [28]. PETG is not directly biodegradable and it is persistent in the environment, yet it can be recycled. ABS, on the other hand, is derived from petroleum and is not biodegradable, which poses an environmental issue. According to Table 1, PLA is the most durable material tested when it comes to aging under UV exposure.
Table 4. Qualitative assessment for selection.
| PLA | ABS | PETG | |
|---|---|---|---|
| Material properties | |||
| Biodegradability | ■■□ | □□□ | ■□□ |
| Resistance to aging under UV | ■■□ | ■■□ | ■□□ |
| Support manufacture | |||
| Ease of Printing | ■■■ | ■■□ | ■□□ |
| Low energy consumption | ■■□ | ■□□ | ■■□ |
| Performance | |||
| Catalyst load and adherence | ■■■ | ■■□ | ■■□ |
| Photocatalytic activity | ■■□ | ■■□ | ■■□ |
■■■: High | ■■□: Medium | ■□□: Low | □□□ Very Low (property is almost negligible or absent).
Concerning the manufacturing process of the samples, and based on our own experience, PETG is the most challenging material in terms of printability. When melted, PETG has a high viscosity, making it more susceptible to stringing, which can result in surface imperfections. Additionally, the material can adhere to the nozzle during printing, potentially causing clogs and loss of precision. To mitigate these issues, a higher temperature and proper retraction control settings are necessary. On the other hand, ABS is prone to warping, particularly in large or thin-walled parts, due to uneven cooling that creates internal stresses. This often leads to lifted corners or cracks between layers. These problems can largely be resolved by using higher temperatures during printing. In contrast, PLA is much easier to print and does not produce toxic fumes, making it a more user-friendly option.
The low energy consumption parameter is related to the bed and extrusion temperatures in the printing process of the plastic support; PLA also has the advantage in this case. PETG is, out of the three plastics studied, the most difficult to manipulate when printing; although ABS is relatively easy to handle, it requires the highest temperatures.
Finally, we analyzed performance aspects, based particularly on the results shown in Table 3. Although all three polymers provide similar DCM conversions, PLA seems the best choice for the functionalization of plastics to control airborne organic pollution. However, it must be noted that PETG would be the only viable option if the reactor’s internal configuration requires a semi-transparent support material.
In this study on gas phase pollution control, three different polymers were tested as potential substrates for immobilizing photocatalysts: PLA, ABS, and PETG. It was possible to generate titanium dioxide films on the printed plastic supports simply and effectively. In all cases, good levels of DCM elimination were obtained in a laboratory-scale continuous reactor. Considering the established comparison criteria, the best results were achieved with PLA, which had a high load capacity, photocatalytic efficiency, and biodegradability. Using PLA as a support for TiO2 not only meets technical requirements but also aligns with green chemistry and sustainability. This study lays the groundwork for scaling up the photocatalytic reactor for treating larger air volumes using functionalized 3D-printed pieces. Moreover, we conclude that the performance of the reactor turns independent on the substrate as long as sufficiently high superficial loads of photocatalyst are achieved; yet the strength of our findings relies on the simple and effective process for functionalizing plastics which have a great versatility through 3D printing, to generate infinite possible internal configurations and optimize devices.
The authors would like to thank the Agencia Nacional de Investigaciones Científicas y Técnicas and the Universidad Nacional del Litoral for their financial support.
M.J.F. and M.J.D. performed the experiments and data collection. All authors designed the study and analyzed all the data. C.P. and R.J.B. made theoretical calculations. M.J.F., R.J.B. and C.P. wrote the main manuscript text and prepared the figures and tables. M.D.L. and R.J.B.: obtained funding for the research. All authors reviewed the manuscript, made amendments, and contributed with their expertise.
Not applicable.
This work was funded by the Agencia Nacional de Promoción Científica y Tecnológica (PICT 520 2017-2090) and Universidad Nacional del Litoral (CAID 50620190100162Li).
The authors declare that they have no known competing financial interests or personal relationships that could have appeared to influence the work reported in this paper.