Glyphosate, chemically known as N-(methyl phosphate) glycine, is a highly effective, broad-spectrum, and most widely used organophosphorus pesticide, mainly used for weeding non-cultivated land, including orchards, roads and forestry, and planting rice fields with little or no tillage. Due to its high efficiency, glyphosate become one of the most widely used organic phosphorus pesticides worldwide [
1,
2,
3]. However, most glyphosate would be migrated into the water bodies via the rainfall. Its excessive use can lead to high concentrations in the aqueous solutions, which may negatively impact water quality and produce toxic effects on aquatic organisms. Therefore, research on glyphosate removal has gained increasing attention [
4,
5,
6,
7,
8].
Currently, technologies such as advanced oxidation, chemical oxidation, chemical precipitation, biodegradation, membrane filtration, and adsorption are used to treat glyphosate-contaminated wastewater [
9,
10,
11]. Among these technologies, adsorption offers advantages of high efficiency, ease of operation, and low cost [
12,
13,
14,
15]. Commonly used adsorbents include mesoporous materials such as metal compounds, activated carbon, industrial resins, and zeolites. As an emerging functional material, biochar can remove pollutants through physical and chemical adsorption [
16,
17,
18,
19]. Among carbonization technologies used to prepare biochar, slow pyrolysis was identified as the most efficient for achieving a satisfying yield and porous structure [
20,
21,
22]. Additionally, using low-cost, naturally biodegradable waste biomass as a feedstock can potentially reduce operation costs [
23,
24]. Water hyacinth, a tropical plant widely distributed in the southern watersheds of China, is characterized by its rapid growth, prolific reproduction, and robust adaptability to different environments. However, water hyacinths can block sunlight, reduce dissolved oxygen levels in water and outcompete other aquatic plants. Composed of three carbon-based polymers-cellulose, hemicellulose, and lignin, water hyacinth is considered as a promising precursor of biochar [
25,
26]. Compared to other biomass sources, water hyacinth biochar has a larger pore size and specific surface area, making it suitable for wastewater treatment and mitigating ecological and environmental issues caused by its uncontrolled growth. Transformation of water hyacinth into biochar realized a “win-win” strategy to not only remediate environmental pollution but also recycle the ecological-harmful solid waste [
27]. However, its limited adsorption capacity and non-selectivity hinder its widespread application in practical wastewater treatment [
28,
29]. Appropriate biochar modification is essential to improve its adsorption performance and selectivity [
30,
31,
32,
33].
Nanoparticle loading is an effective method of enhancing the selectivity and capacity of adsorbents. Commonly used nanoparticles include metal nanoparticles, oxide nanoparticles, carbon-based nanoparticles, and polymer nanoparticles. Considering their strong affinity for phosphate, rare earth elements (REEs) are prospective and highly selective adsorbents for phosphate removal [
34,
35]. Among these, cerium dioxide (CeO
2) is an inexpensive and sustainable rare earth oxide with stable and non-toxic chemical properties [
36,
37,
38]. Cerium dioxide and its related adsorbents are gaining significant interest in their use in water treatment. The substantial surface charge, a variety of functional groups, and strong attraction to surface hydroxyls enable the rapid formation of cerium ion complexes with pollutants, including phosphates and arsenic, making cerium dioxide an excellent material for ecological remediation [
39,
40,
41,
42]. It has become a potential candidate for water purification. However, cerium (hydro)oxide exhibits low capacity and slow rate in phosphate adsorption, which restrain its practical applications. To improve the adsorption performance towards phosphate as well as reduce the usage of cerium, host materials, including biochar, porous silica micro-sphere and molecular sieve, were used to support and disperse cerium (hydro)oxide [
43,
44]. There are few reports on the preparation of ceria-loaded activated carbon and its application in the adsorption of glyphosate [
45,
46,
47,
48,
49].
Herein, we present a recyclable CeO
2-based adsorbent capable of capturing and subsequently releasing glyphosate, facilitating its recovery and enabling the reuse of the adsorbent. In designing these adsorbents, we have exploited the exceptional binding capacity of cerium oxide nanostructures to load glyphosate onto biochar. Specifically, in this study, cerium dioxide-loaded water hyacinth biochar (CeO
2/WHBC) was synthesized using an
in situ precipitation technique. The optimal preparation conditions were investigated, and the as-prepared sorbent was characterized by scanning electron microscope (SEM), X-ray diffraction (XRD), Fourier transform infrared (FTIR), X-ray photoelectron spectroscopy (XPS), and zeta potential analyses. The adsorption kinetics and isotherms of glyphosate on CeO
2/WHBC were studied, and the effects of solution pH, co-existing ions and regeneration processes on the adsorption performance of the sorbent were discussed. In addition, dynamic adsorption experiments and wastewater treatment tests were conducted to evaluate the potential applications of this adsorbent, which were further determined, and the adsorption mechanism was investigated.
2.1. Materials
Water hyacinth was purchased from Alibaba (Hangzhou, China), then washed, dried, ground, and sieved through 100–200 mesh before use. Chemical reagents, including sodium hydroxide, potassium hydroxide, concentrated hydrochloric acid, Cerium nitrate hexahydrate, glyphosate (99%), and absolute ethyl alcohol (all of analytical grade), were purchased from Sinopharm Chemical Reagent (Shanghai, China) and used without further purification.
2.2. Preparation and Characterization of CeO2/WHBC-n
To remove soluble sugars and impurities, 14 g of water hyacinth was added to 500 mL of 1 mol·L
−1 KOH. After stirring at room temperature for 20 min, the treated solid was separated and sequentially washed with distilled water and ethyl alcohol. To produce water hyacinth biochar (WHBC), the obtained water hyacinth was heated at a rate of 5 °C per minute from 30 °C to 500 °C and then calcined at this temperature for an hour in a tube furnace supplied with nitrogen. The solid product was further washed with 1 mol·L
−1 HCl and hot distilled water, and it was then dried at 70 °C overnight prior to use.
The CeO
2/WHBC-n adsorbent was prepared by adding 0.10 g of WHBC to 50 mL of cerium nitrate solution at a concentration of 50.0 mmol·L
−1. After stirring the combination for half an hour at room temperature, a solution of 6 mol·L
−1 NaOH was gradually added to adjust the solution pH to 12.0. The mixture was then stirred for a further hour, and the resulting sorbent was washed with distilled water and ethyl alcohol and then dried at 70 °C overnight before use. The cerium-containing particles were loaded onto the WHBC by adjusting the solution pH with NaOH. To investigate the effect of CeO
2 loading on the adsorption performance of glyphosate, CeO
2/WHBC adsorbents were prepared at Ce(NO
3)
3 concentrations of 2.0, 6.0, 10.0 and 20.0 mmol·L
−1. The physico-chemical properties of the prepared sorbents were analyzed using a scanning electron microscope (SEM, Hitachi S4800, Tokyo, Japan), an X-ray diffractometer (XRD, Rigaku D/max2500, Tokyo, Japan), X-ray photoelectron spectroscopy (XPS, Thermo Fisher Scientific Esca Lab 250Xi, Waltham, MA, USA), and a zeta potential analyzer (Zetasizer Nano Zs90, Malvern Instruments Ltd., Malvern, UK).
2.3. Batch Adsorption Experiments
Adsorption experiments were conducted at 25 °C with a shaker set to 250 rpm. To determine the adsorption isotherm, 0.010 g of adsorbent was added to 40.00 mL of glyphosate solution with a concentration range of 10–50 mg·L
−1 at pH 3.4. For kinetic investigations, 0.050 g of adsorbent was mixed with 200.00 mL of 50 mg·L
−1 glyphosate solution. In co-existence studies, 0.050 g of CeO
2/WHBC-3 was added to 200.00 mL of 50 mg·L
−1 glyphosate solution containing co-existing cations. The initial concentrations of cations (K
+, Na
+, Ca
2+, Mg
2+) and anions (Cl
−, NO
3−, SO
42−) ranging from 0 to 200 mg·L
−1. The influences of pH on adsorption performance were investigated in the range of 1.0 to 12.0. In the wastewater treatment experiment, CeO
2/WHBC-3 was added to a 40 mL solution containing 20 mg·L
−1 glyphosate. Three adsorption-desorption cycles were performed to determine the reusability of the sorbents. For regeneration, 0.01 mg·L
−1 NaOH was used, followed by washing with distilled water until neutral.
To determine the glyphosate concentration before and after adsorption, glyphosate was oxidized to phosphate using potassium persulfate as the oxidant and the resulting phosphate content was measured using ammonium molybdate spectrophotometry [
50].
The quantity of glyphosate adsorbed was calculated using the following Equation (1):
qe (mg·g
−1) represents the amount of glyphosate adsorbed per unit mass of the sorbent,
V (mL) is the volume of the glyphosate solution,
C0 (mg·L
−1) and
Ce (mg·L
−1) is the concentration of glyphosate before and after adsorption, and
m (g) is the weight of the adsorbent.
2.4. Dynamic Adsorption Experiments of Glyphosate on CeO2/WHBC-3 Fixed Bed Column
Dynamic adsorption studies were conducted in a laboratory-scale fixed-bed column with an internal diameter of 1 cm and a height of 20 cm. Typically, 1.0 g of CeO
2/WHBC-3 was placed in the column, and glyphosate solution (0.50, 1.00, 1.2 mmol·L⁻¹) was passed through the column at varying flow rates (2.0, 3.0, 5.0 mL·min⁻¹). In the wastewater treatment experiment, simulated wastewater was prepared using glyphosate and running water, with a glyphosate concentration of 0.5 mmol·L⁻¹ and a flow rate of 5 mL·min⁻¹. Samples were collected at various intervals, and glyphosate concentrations were evaluated using the same procedure as in the batch adsorption studies.
3.1. Preparation and Characterization of CeO2/WHBC
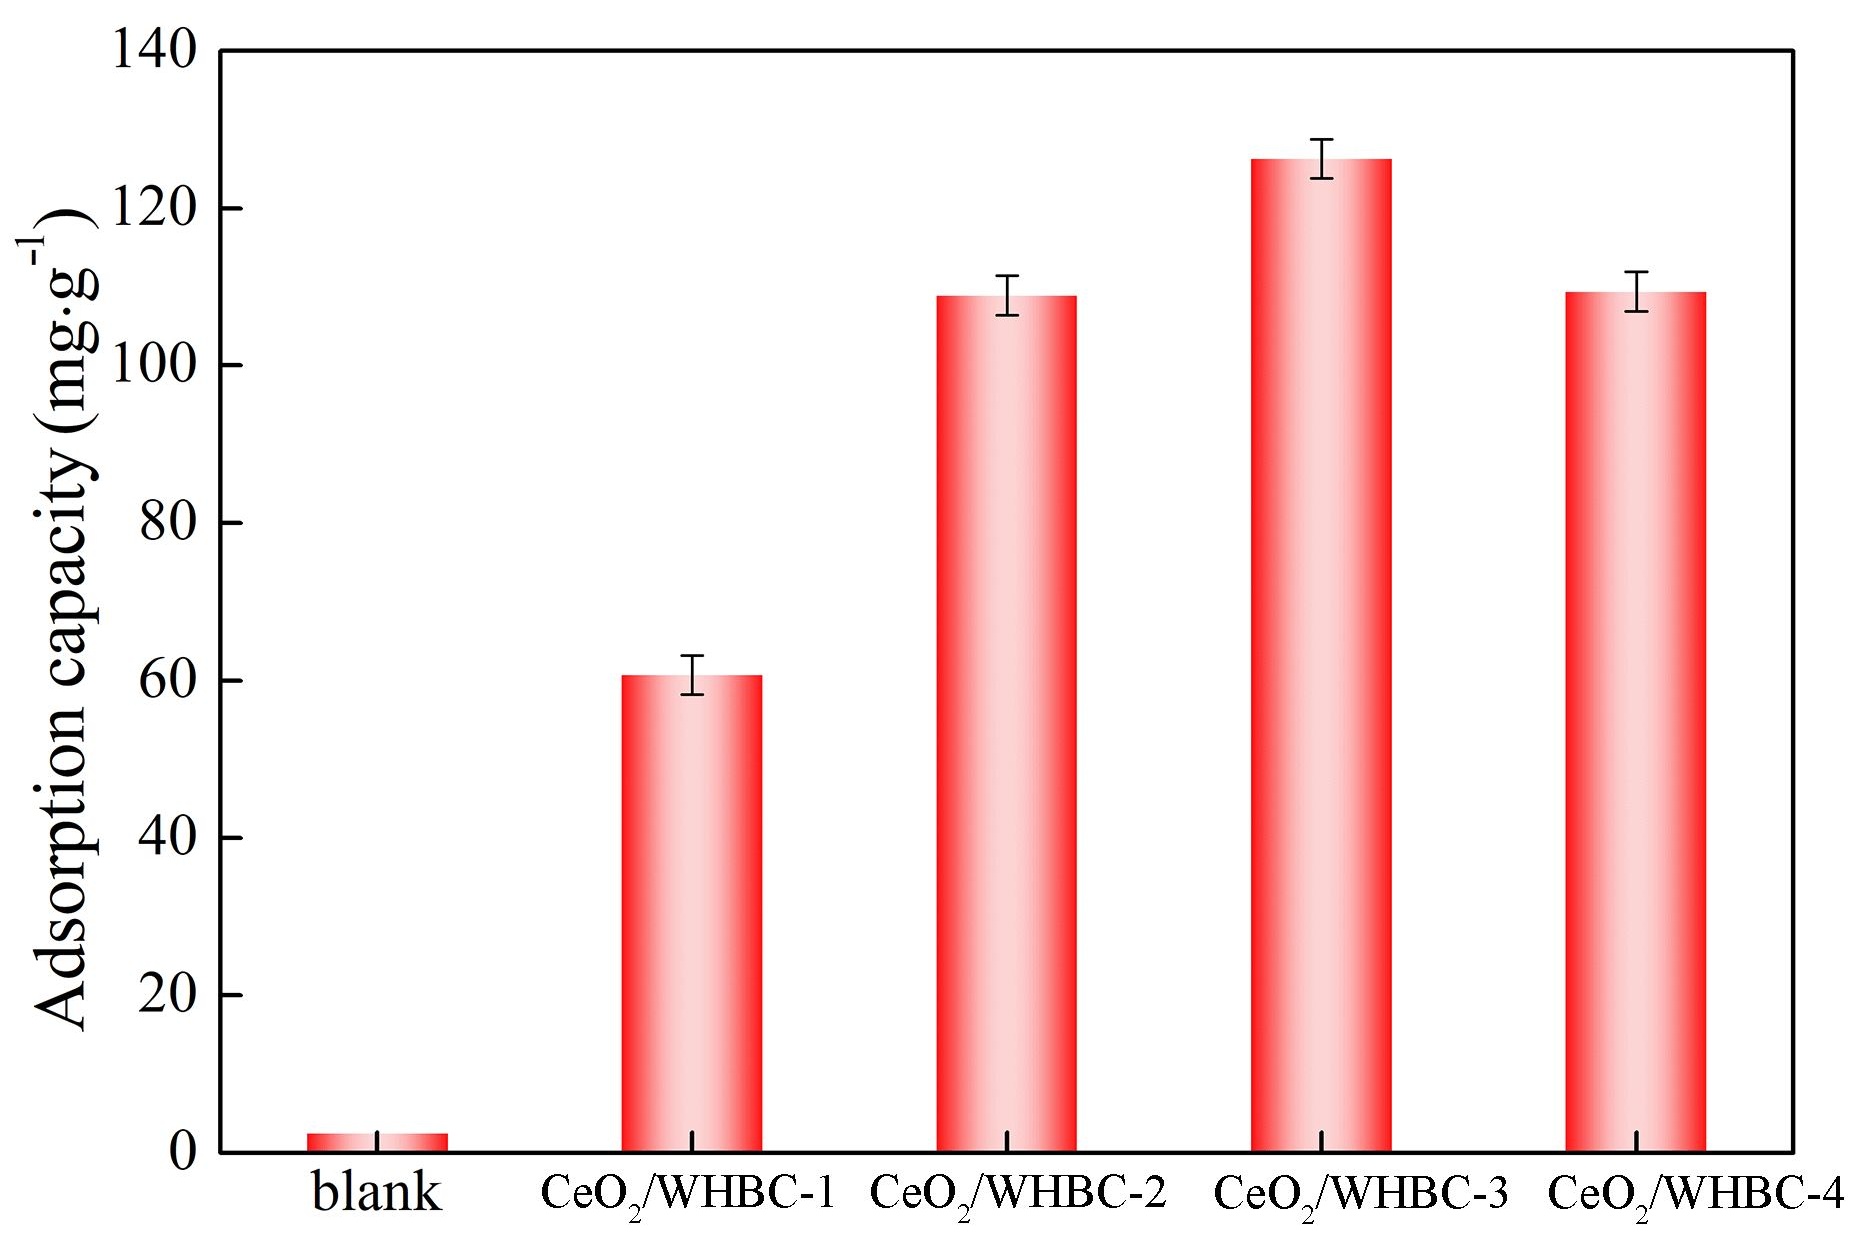
Water hyacinth was firstly carbonized at 500 °C, and shows the adsorption capacity of glyphosate on CeO
2/WHBC at different loading levels. The adsorption capacities of CeO
2/WHBC prepared at Ce(NO
3)
3 concentrations of 2.0, 6.0, 10.0 and 20.0 mmol·L
−1 were 60.7, 108.9, 126.3, and 109.4 mg·g
−1, respectively. The results indicated that the best adsorption performance was achieved with a Ce(NO
3)
3 solution of 10.0 mmol·L⁻¹. The corresponding adsorbents are CeO
2/WHBC-1, CeO
2/WHBC-2, CeO
2/WHBC-3 and CeO
2/WHBC-4, respectively. Therefore, CeO
2/WHBC-3 was selected as the adsorbent for the subsequent adsorption experiments.
. Adsorption capacity of CeO<sub>2</sub>/WHBC with different CeO<sub>2</sub> loading amounts.
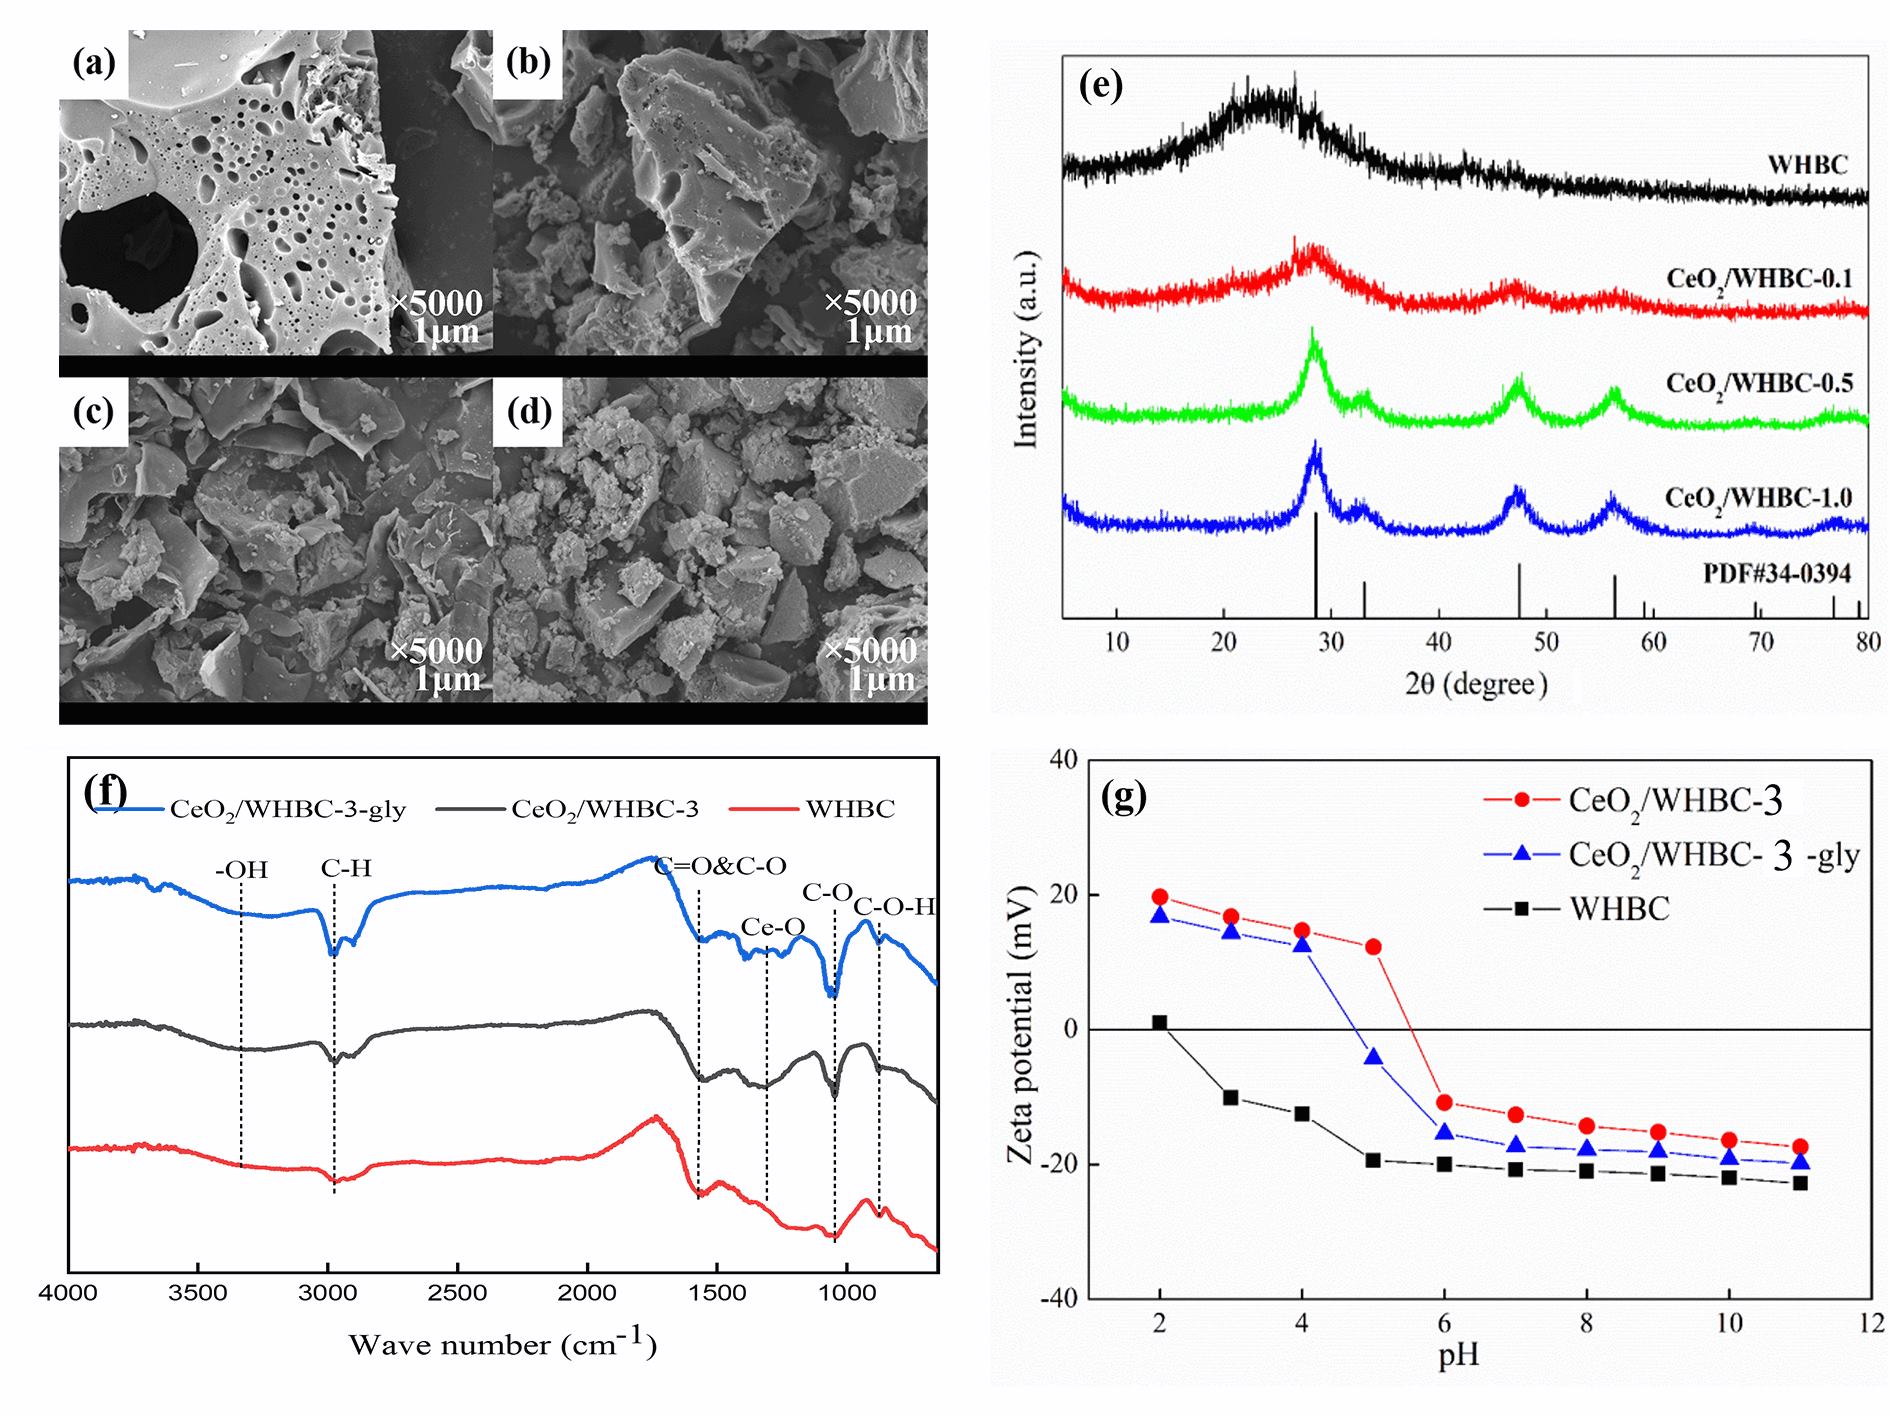
Since the adsorption capacity of glyphosate by CeO
2/WHBC varied significantly with different loadings, and this phenomenon might be related to the distribution of CeO
2 on the surface of the biochar, WHBC, CeO
2/WHBC-1, CeO
2/WHBC-3, and CeO
2/WHBC-4 were selected for SEM analysis, and the results are shown in . From the figure, it can be seen that almost no CeO
2 nanoparticles were observed on the surface of the CeO
2/WHBC-1. However, when the loading amount was increased to a large number of CeO
2 nanoparticles were encapsulated on the biochar surface, and the original pore structure of the biochar was barely visible. e shows the XRD patterns of biochar with different Ce loadings. The diffraction peaks of WHBC appear in the 20–30° and 40–50° intervals, which can be categorized as typical of an amorphous graphitic phase carbon material. It can also be observed that the crystallinity of CeO
2 on the surface of biochar gradually increases with higher loading amounts. When this adsorbent was CeO
2/WHBC-1, new diffraction peaks at 28°, 47° and 56° appeared in the XRD patterns, corresponding to the (111), (220), and (311) crystal planes of CeO
2, respectively. However, these three peaks were broad, indicating that the crystallinity of CeO
2 obtained at a low loading amount was poor. When this adsorbent was CeO
2/WHBC-3 and CeO
2/WHBC-4 the characteristic peaks of CeO
2 became sharp, and three diffraction peaks at 33°, 69°, and 76° were observed, corresponding to the (200), (400), and (331) crystal planes of CeO
2, respectively. This indicates that the CeO
2 loaded on the surface of biochar exhibited a cubic fluorite structure. f shows the FTIR spectra of CeO
2/WHBC-3 before and after glyphosate adsorption. The absorption peak at 1066 cm
−1 can be attributed to the bending vibration peak of Ce-OH on the surface of CeO
2, while the two absorption peaks located at 421 cm
−1 and 853 cm
−1 correspond to the characteristic stretching vibrations of Ce–O. g presents the zeta potentials of WHBC and CeO
2/WHBC-3 before and after adsorption. The zeta potential of the biochar changed significantly after loading, with the isoelectric point increasing from 2.11 to 5.51. This shift indicates that CeO
2 introduced more positive charge sites on the material’s surface, facilitating the adsorption of glyphosate on CeO
2/WHBC-3 [
40].
. SEM of WHBC (<b>a</b>), CeO<sub>2</sub>/WHBC-1 (<b>b</b>), CeO<sub>2</sub>/WHBC-3 (<b>c</b>) and CeO<sub>2</sub>/WHBC-4 (<b>d</b>), and (<b>e</b>) XRD of WHBC, CeO<sub>2</sub>/WHBC-1, CeO<sub>2</sub>/WHBC-3 and CeO<sub>2</sub>/WHBC-4, (<b>f</b>) FTIR of CeO<sub>2</sub>/WHBC-3 before and after glyphosate adsorption, (<b>g</b>) Zeta potential of WHBC, CeO<sub>2</sub>/WHBC-3 before and after glyphosate.
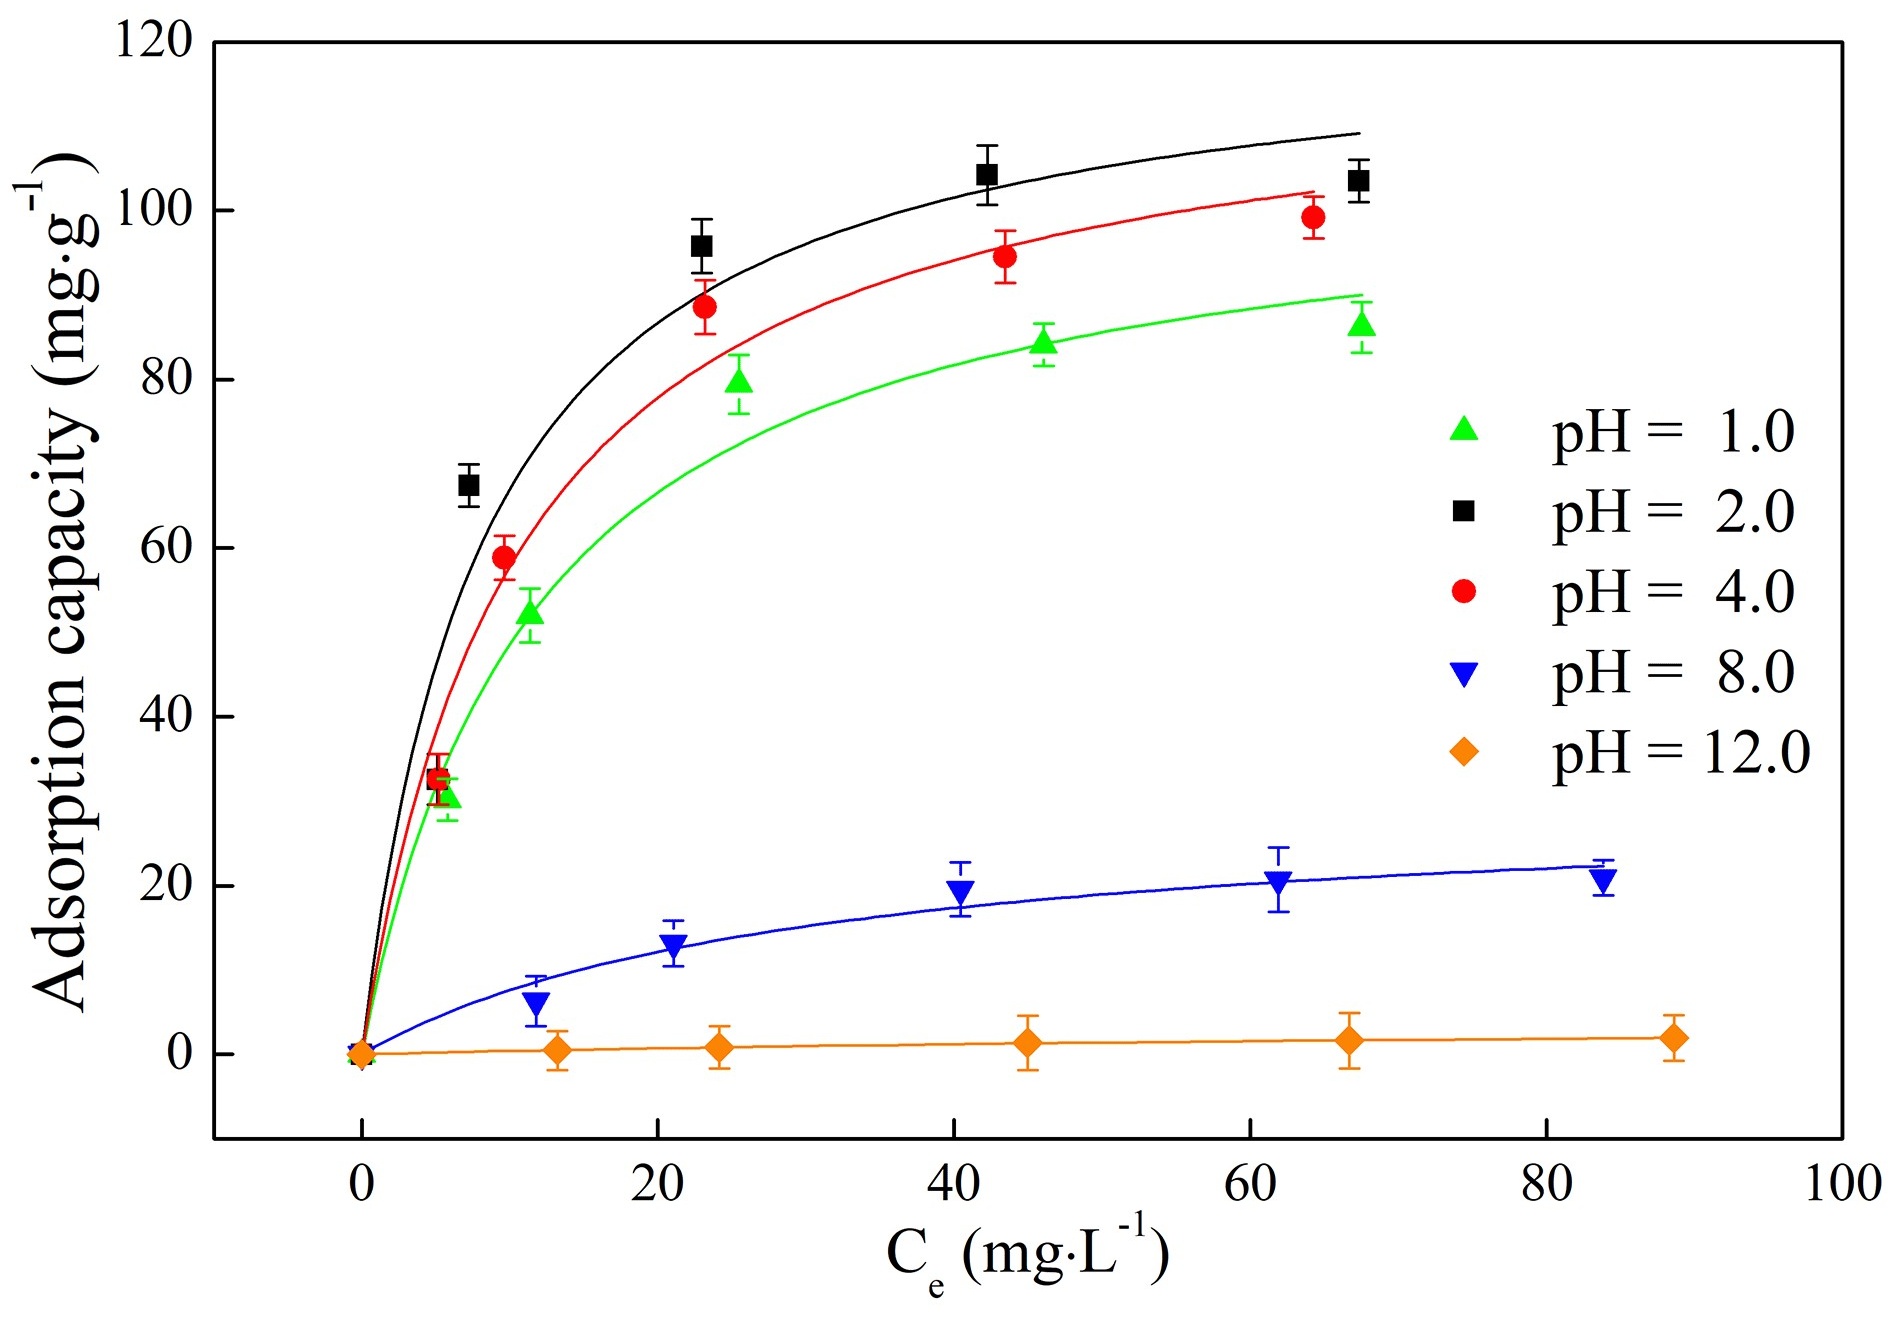
Since the pH of the system strongly influences the adsorption performance of glyphosate on CeO
2/WHBC-3, we investigated the isothermal adsorption of glyphosate by CeO
2/WHBC-3 at pH levels 1.0, 2.0, 4.0, 8.0 and 12.0. The results are shown in . As shown in the figure, the adsorption of glyphosate by CeO
2/WHBC-3 increased gradually until reaching equilibrium with the rising initial concentration of glyphosate. The optimal pH for the adsorption performance of CeO
2/WHBC-3 to glyphosate was 2.0, followed by 4.0, 1.0, 8.0 and 12.0, aligning with the findings from experiments on the effect of acidity on the adsorption performance. The isothermal adsorption data at different pH levels were fitted to the Langmuir, Freundlich and Temkin isothermal adsorption models (Equations (2)–(4)), The
qe represents the equilibrium adsorption capacity of glyphosate (mg·g
−1);
qm is the maximum adsorption capacity (mg·g
−1);
Ce is the equilibrium concentration of glyphosate (mg·L
−1);
KL is the Langmuir adsorption constant (L·mg
−1);
KF and 1/
n are Freundlich adsorption constants (mg·mg
−1/n·L
1/n·g
−1), which are related to the adsorption intensity between adsorbent and adsorbate;
AT (L·mg
−1) is the maximum binding energy corresponding to the equilibrium binding constant;
bT is the Temkin isothermal constant (mg
−1·g
−1);
R and
T represent the ideal gas constant (8.3145 J·mol
−1·K
−1) and temperature (K), respectively. The fitting results are presented in . The correlation coefficient (
R2) values fitted by the Langmuir model were much higher than those by the Freundlich and Temkin model. Based on the aforementioned results, it can be concluded that the Langmuir model more accurately describes the adsorption behaviour of glyphosate as compared to the Freundlich and Temkin models do, indicating that the adsorption of glyphosate on CeO
2/WHBC-3 follows a monomolecular layer chemisorption. The maximum adsorption capacities of glyphosate by CeO
2/WHBC-3 at pH levels of 1.0, 2.0, 4.0, 8.0, and 12.0 were 105.6, 122.6, 119.1, 30.2, and 3.9 mg·g⁻¹, respectively, as calculated from the Langmuir model. A comparison with other carbon-based adsorbents reported in related literature () reveals that CeO
2/WHBC-3 demonstrates superior adsorption performance for glyphosate in acidic conditions, suggesting its potential application in the treatment of acidic glyphosate wastewater. The pH of the static adsorption system influences not only the equilibrium form of glyphosate in the aqueous solution but also the surface charge of the adsorbent [
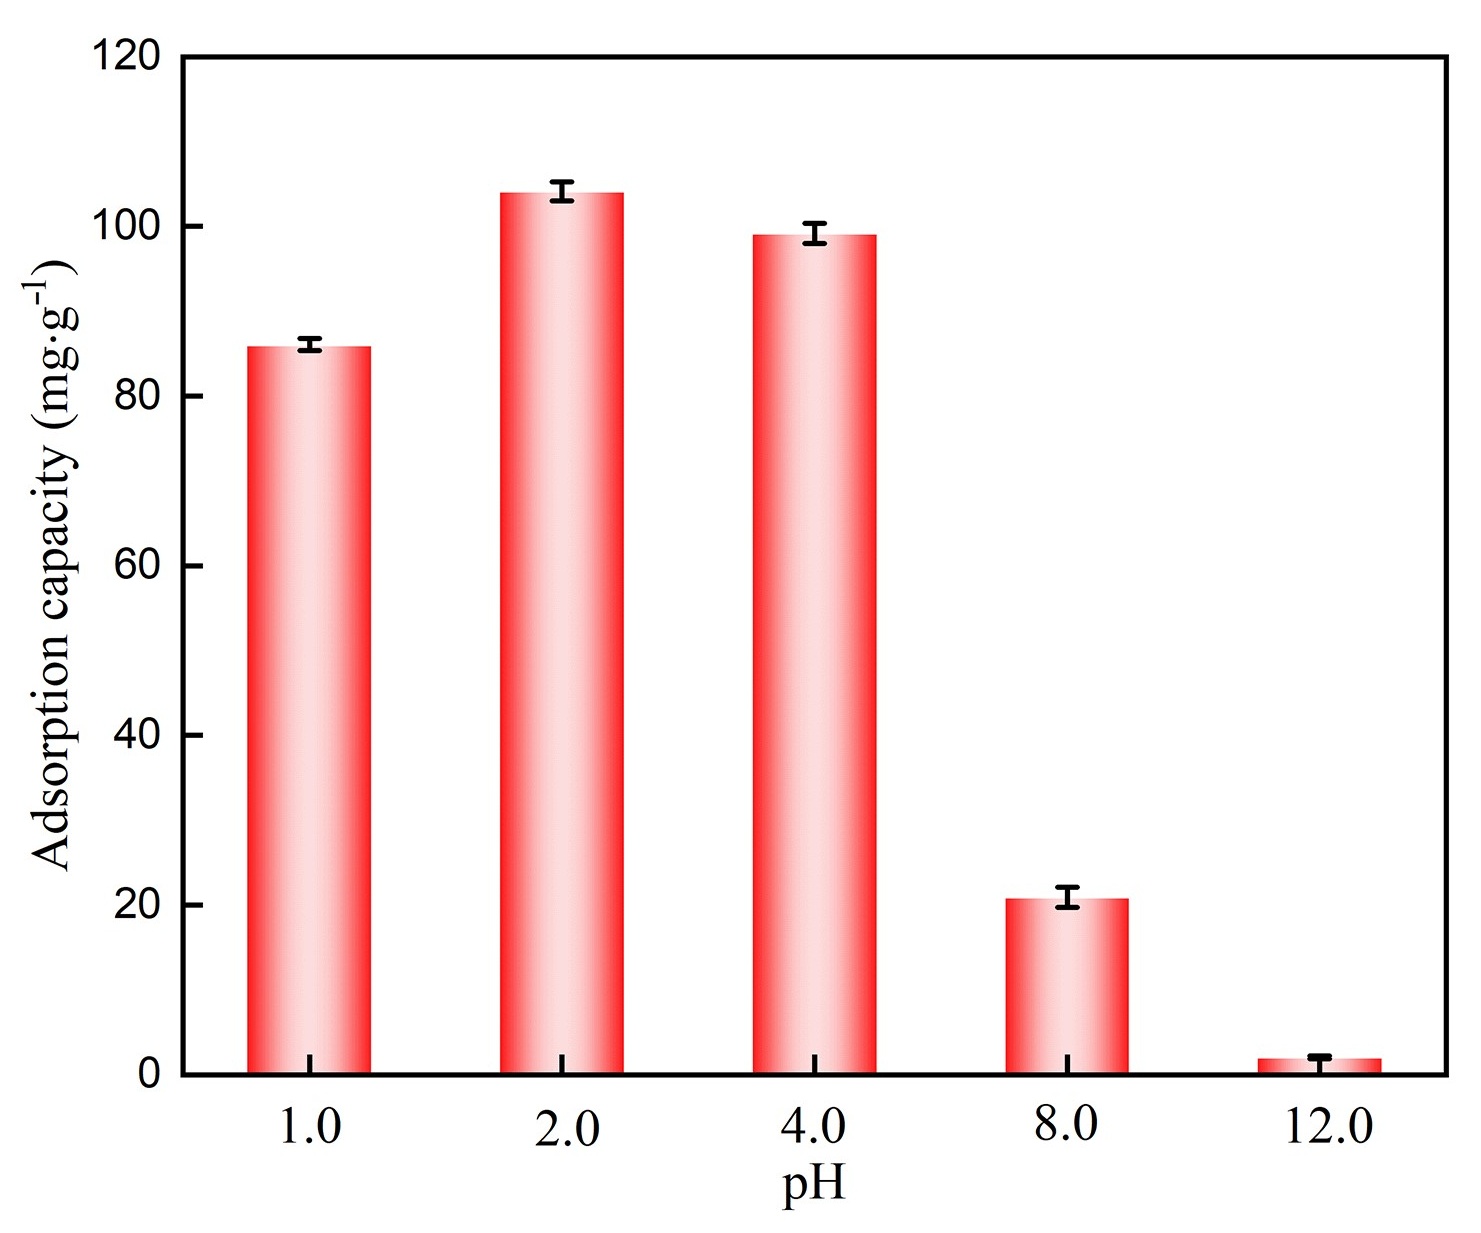
32]. shows the adsorption capacity of CeO
2/WHBC-3 for glyphosate at various pH levels, indicating that glyphosate adsorption by CeO
2/WHBC-3 was more effective in the acidic conditions, whereas a significant decrease in adsorption capacity was observed under alkaline conditions. At pH levels of 2.0 and 4.0, as shown in g, glyphosate is negatively charged, while CeO
2/WHBC-3 is positively charged, enabling the adsorption process to occur via electrostatic attraction. As the pH increased to 8.0 and 12.0, the zeta potential diagram indicates that the pH exceeded the isoelectric point of the adsorbent, resulting in a negatively charged surface on CeO
2/WHBC-3. Consequently, the adsorption capacity of the adsorbent for glyphosate decreased significantly.
. Effects of pH on adsorption performance of CeO<sub>2</sub>/WHBC-3.
. Adsorption isotherms of glyphosate on CeO<sub>2</sub>/WHBC-3 at different Ph.
.
Adsorption isotherm parameters fitted by Langmuir, Freundlich and Temkin models.
| Model |
Langmuir |
Freundlich |
Temkin |
| pH |
1/KL |
qm |
R2 |
KF |
1/n |
R2 |
AT |
bT |
R2 |
| mg·L−1 |
mg·g−1 |
(mg·g−1) (L·mg−1)1/n |
L·mg−1 |
J·mol−1 |
| 1.0 |
11.73 |
105.6 |
0.9818 |
22.1 |
0.342 |
0.8224 |
0.764 |
105.4 |
0.9103 |
| 2.0 |
8.28 |
122.6 |
0.9492 |
32.0 |
0.301 |
0.7214 |
1.23 |
96.6 |
0.8077 |
| 4.0 |
10.60 |
119.1 |
0.9831 |
25.7 |
0.341 |
0.8329 |
0.849 |
93.9 |
0.9189 |
| 8.0 |
29.75 |
30.2 |
0.9949 |
3.04 |
0.456 |
0.7968 |
0.236 |
324.4 |
0.9002 |
| 12.0 |
92.97 |
3.9 |
0.9598 |
0.09 |
0.683 |
0.9769 |
0.127 |
3194.4 |
0.9856 |
.
Comparison of capacities among different carbon-based sorbents for glyphosate.
| Adsorbent |
Adsorption Conditions |
qm (mg·g−1) |
Reference |
| MnFe2O4–G |
pH = 4.0, 1.0 g·L−1 |
39.0 |
[51] |
| Dendro biochar |
pH = 4.0, 1.0 g·L−1 |
44 |
[38] |
| MWCNT/MPNs-Fe |
pH = 4.0, 1.5 g·L−1 |
43.7 |
[40] |
| AC@AgNPs |
pH = 3.8, 0.1 g·L−1 |
149.3 |
[6] |
| Clay-biochar composite |
pH = 8.0, 0.2 g·L−1 |
37.1 |
[5] |
| BC-NZV |
pH = 4.0, 0.6 g·L−1 |
80 |
[29] |
| RHBC |
pH = 4.0, 0.5 g·L−1 |
30.5 |
[39] |
| MnFe2O4-CAC |
pH = 3.4, 0.5 g·L−1 |
162.7 |
[32] |
| MnFe2O4-PAC |
pH = 4.0, 4 g·L−1 |
119.6 |
[52] |
| MWCNT-COOH |
pH = 4.0, 1.5 g·L−1 |
21.2 |
[2] |
| CeO2/WHBC |
pH = 2.0, 0.25 g·L−1 |
122.6 |
This study |
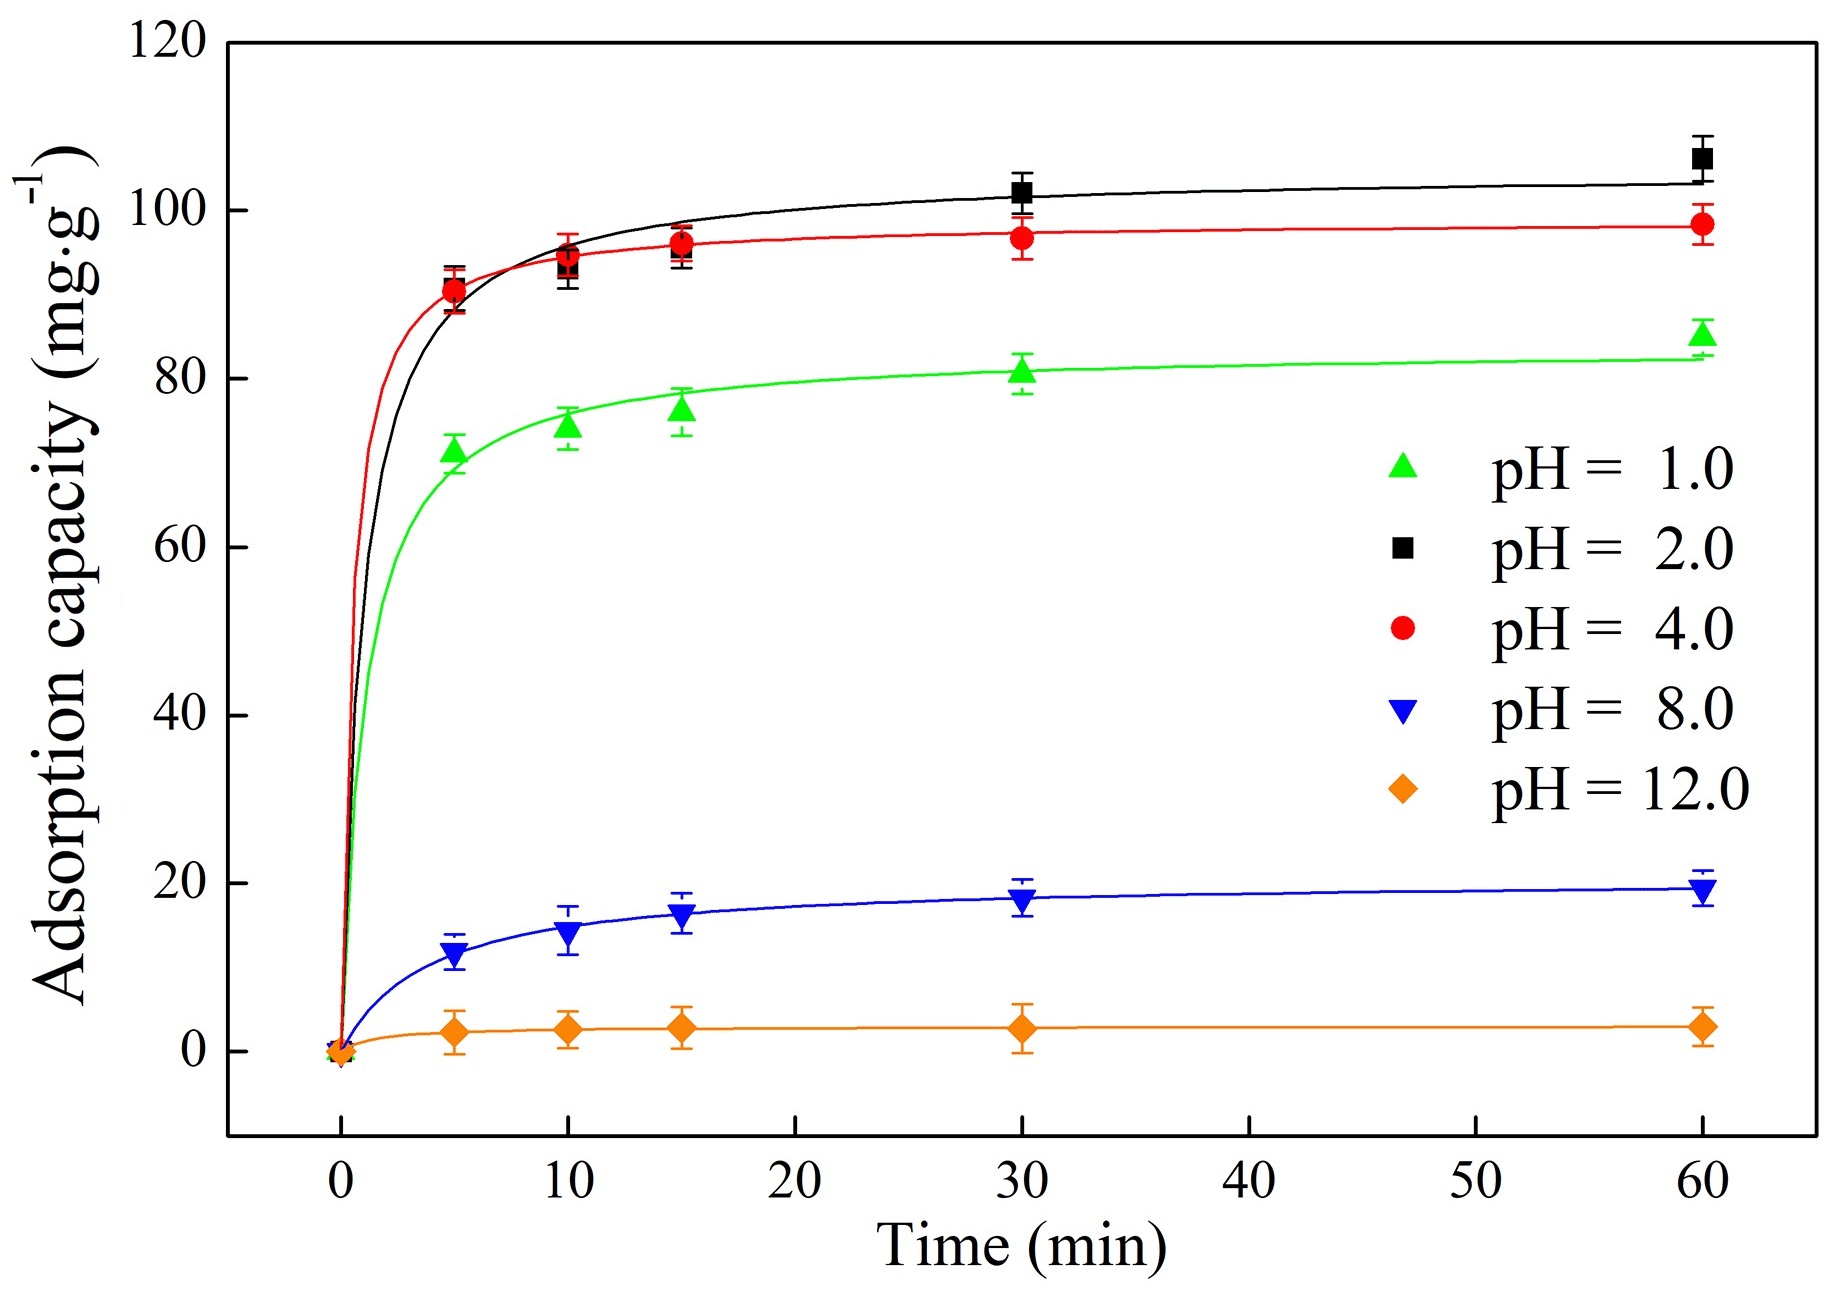
The adsorption kinetics were also used to evaluate the adsorption performance of CeO
2/WHBC-3, as shown in . It can be observed that the adsorption rate was faster within the first 5 min at different pH levels, with more than 90% of glyphosate adsorbed by CeO
2/WHBC-3. As the adsorption process continued from 5 to 30 min, the concentration of glyphosate gradually decreased as the active adsorption sites on the surface of the adsorbent became occupied, leading to a gradual reduction of the adsorption rate. The rate eventually stabilized and reached equilibrium within 60 min. To further investigate the adsorption behaviour of CeO
2/WHBC-3 on glyphosate, the pseudo-first-order model and the pseudo-second-order model were applied to fit the experimental data (Equations (5) and (6)), where
qe (mg·g
−1) and
qt (mg·g
−1) is the amount of glyphosate absorbed at equilibrium and time
t,
k1 (min
−1) and
k2 (g·mg
−1·min
−1) is the rate constant of pseudo-first-order and pseudo-second-order model, respectively. The fitting results are presented in . shows that the correlation coefficients (
R2) for glyphosate adsorption kinetics, fitted using the pseudo-second order model at pH levels 1.0, 2.0, 4.0, 8.0 and 12.0 were 0.9955, 0.9950, 0.9995, 0.9986 and 0.9937, respectively, which were much higher than those by the pseudo-first order model. This result indicates that the pseudo-second-order model describes the adsorption behavior of glyphosate more accurately than the pseudo-first-order model does, suggesting that the adsorption of glyphosate by CeO
2/WHBC-3 may be a chemisorption process controlled by the adsorption rate of the adsorption active sites [
53]. The equilibrium adsorption capacities of glyphosate by CeO
2/WHBC-3 at pH 1.0, 2.0, 4.0, 8.0 and 12.0 were 83.7, 104.8, 98.8, 20.6 and 3.0, respectively, aligning more closely with the actual adsorption amounts than those predicted by the pseudo-first-order model.
. Adsorption kinetics of glyphosate on CeO<sub>2</sub>/WHBC-3 at different pH.
.
Adsorption kinetic parameters fitted by two kinetic models.
| Model |
Pseudo-First-Order Model |
Pseudo-Second-Order Model |
| pH |
k1 |
qe |
R2 |
k2 |
qe |
R2 |
| min−1 |
mg·g−1 |
g·mg −1·min−1 |
mg·g−1 |
| 1.0 |
0.423 |
79.5 |
0.9849 |
1.04 |
83.7 |
0.9955 |
| 2.0 |
0.452 |
99.8 |
0.9850 |
0.94 |
104.8 |
0.9950 |
| 4.0 |
0.541 |
96.6 |
0.9991 |
0.45 |
98.8 |
0.9995 |
| 8.0 |
0.174 |
18.5 |
0.9834 |
3.88 |
20.6 |
0.9986 |
| 12.0 |
0.313 |
2.85 |
0.9926 |
1.50 |
3.01 |
0.9937 |
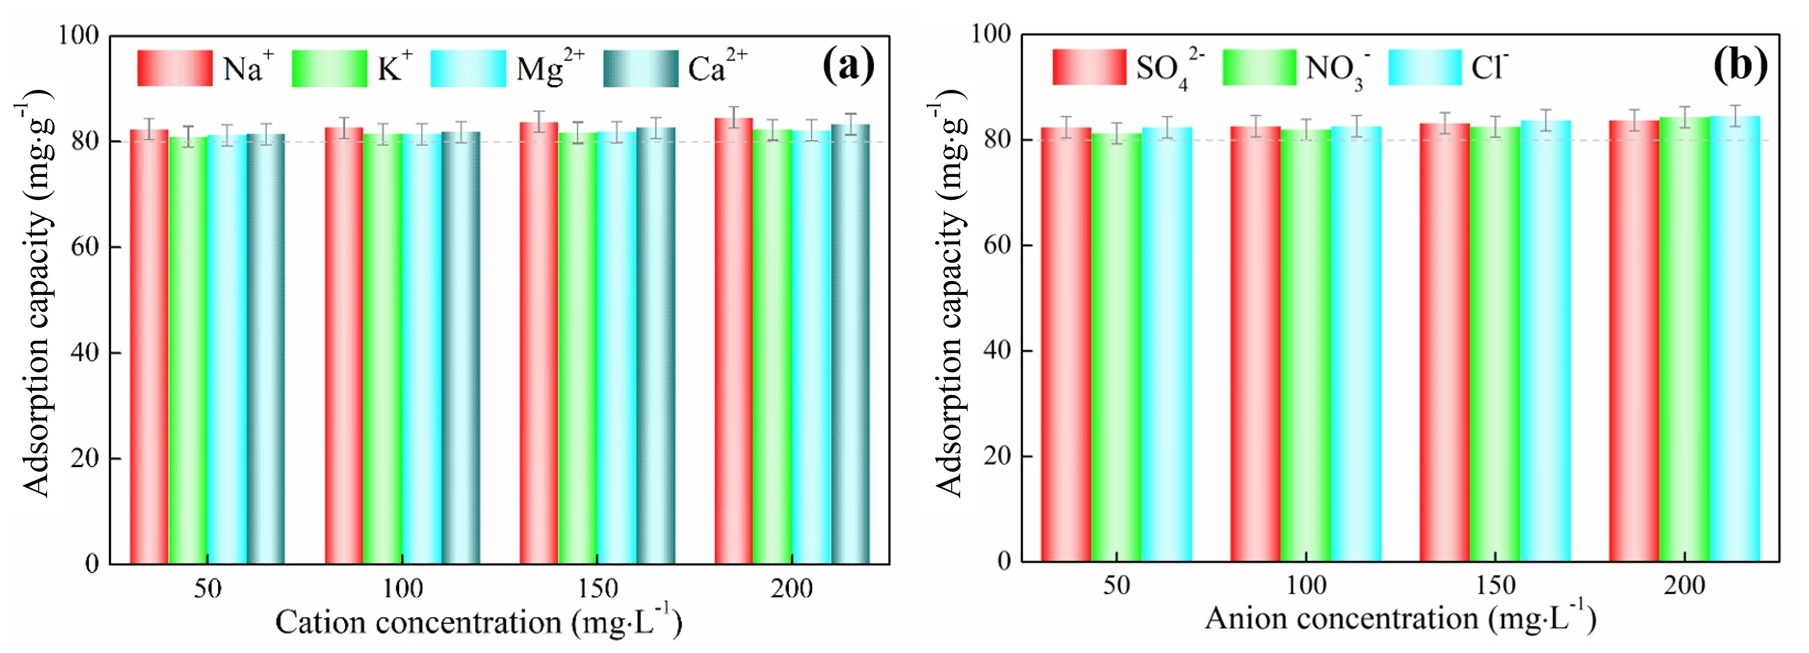
3.3. Effects of Co-Ions on Glyphosate Adsorption on CeO2/WHBC-3
In the actual wastewater treatment process, a variety of co-existing ions (e.g., anions such as SO
42−, NO
3− and Cl
− and cations such as Na
+, K
+, Ca
2+ and Mg
2+) may compete with glyphosate for adsorption on the adsorbent surface, potentially affecting the amount of glyphosate adsorbed. This effect may vary depending on the concentration of the co-existing ions. Therefore, we investigated the effect of the CeO
2/WHBC-3 system in the presence of various concentrations of different interfering ions on the adsorption capacity for glyphosate, with the results shown in . The figure reveals that the co-existing ions had little effect on the adsorption of glyphosate, indicating that the material has strong anti-interference ability.
. Effects of (<b>a</b>) cations and (<b>b</b>) anions on glyphosate adsorption on CeO<sub>2</sub>/WHBC-3.
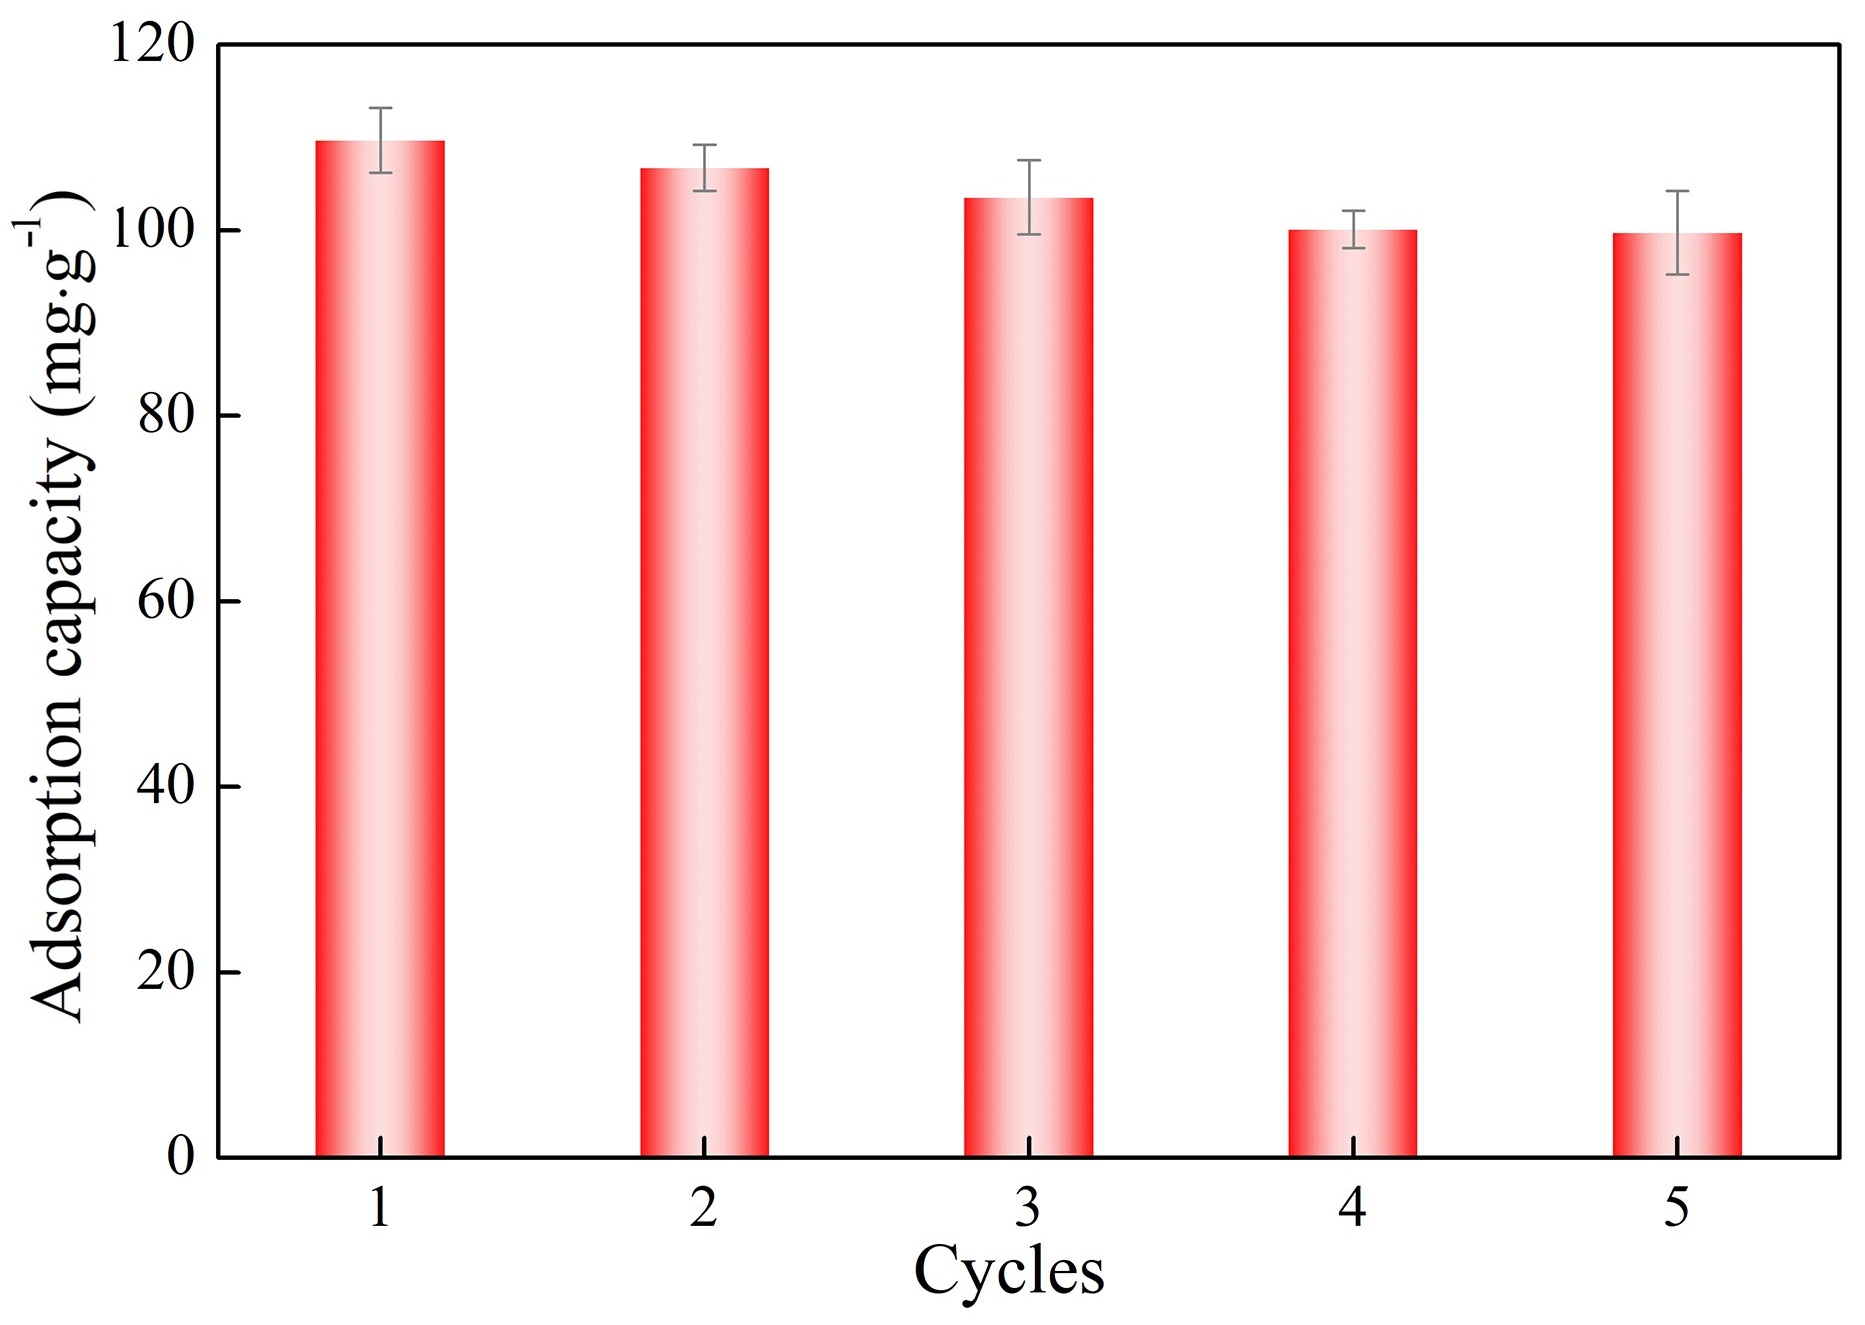
To investigate the cyclic regeneration performance of the prepared adsorbent, we added 0.050 g of CeO
2/WHBC-3 to 200 mL of 50 mg·L
−1 glyphosate solution, then regenerated the adsorbent using a 0.01 mol·L
−1 NaOH solution before starting the next cycle. The results of the cyclic regeneration experiments, shown in , indicate that CeO
2/WHBC-3 maintains strong adsorption performance for glyphosate even after five adsorption-desorption cycles, with a recovery rate over 90% using a 0.01 mol·L⁻¹ NaOH solution. This suggests that the prepared CeO
2/WHBC-3 has significant potential for practical application.
. The reusability of CeO<sub>2</sub>/WHBC-3.
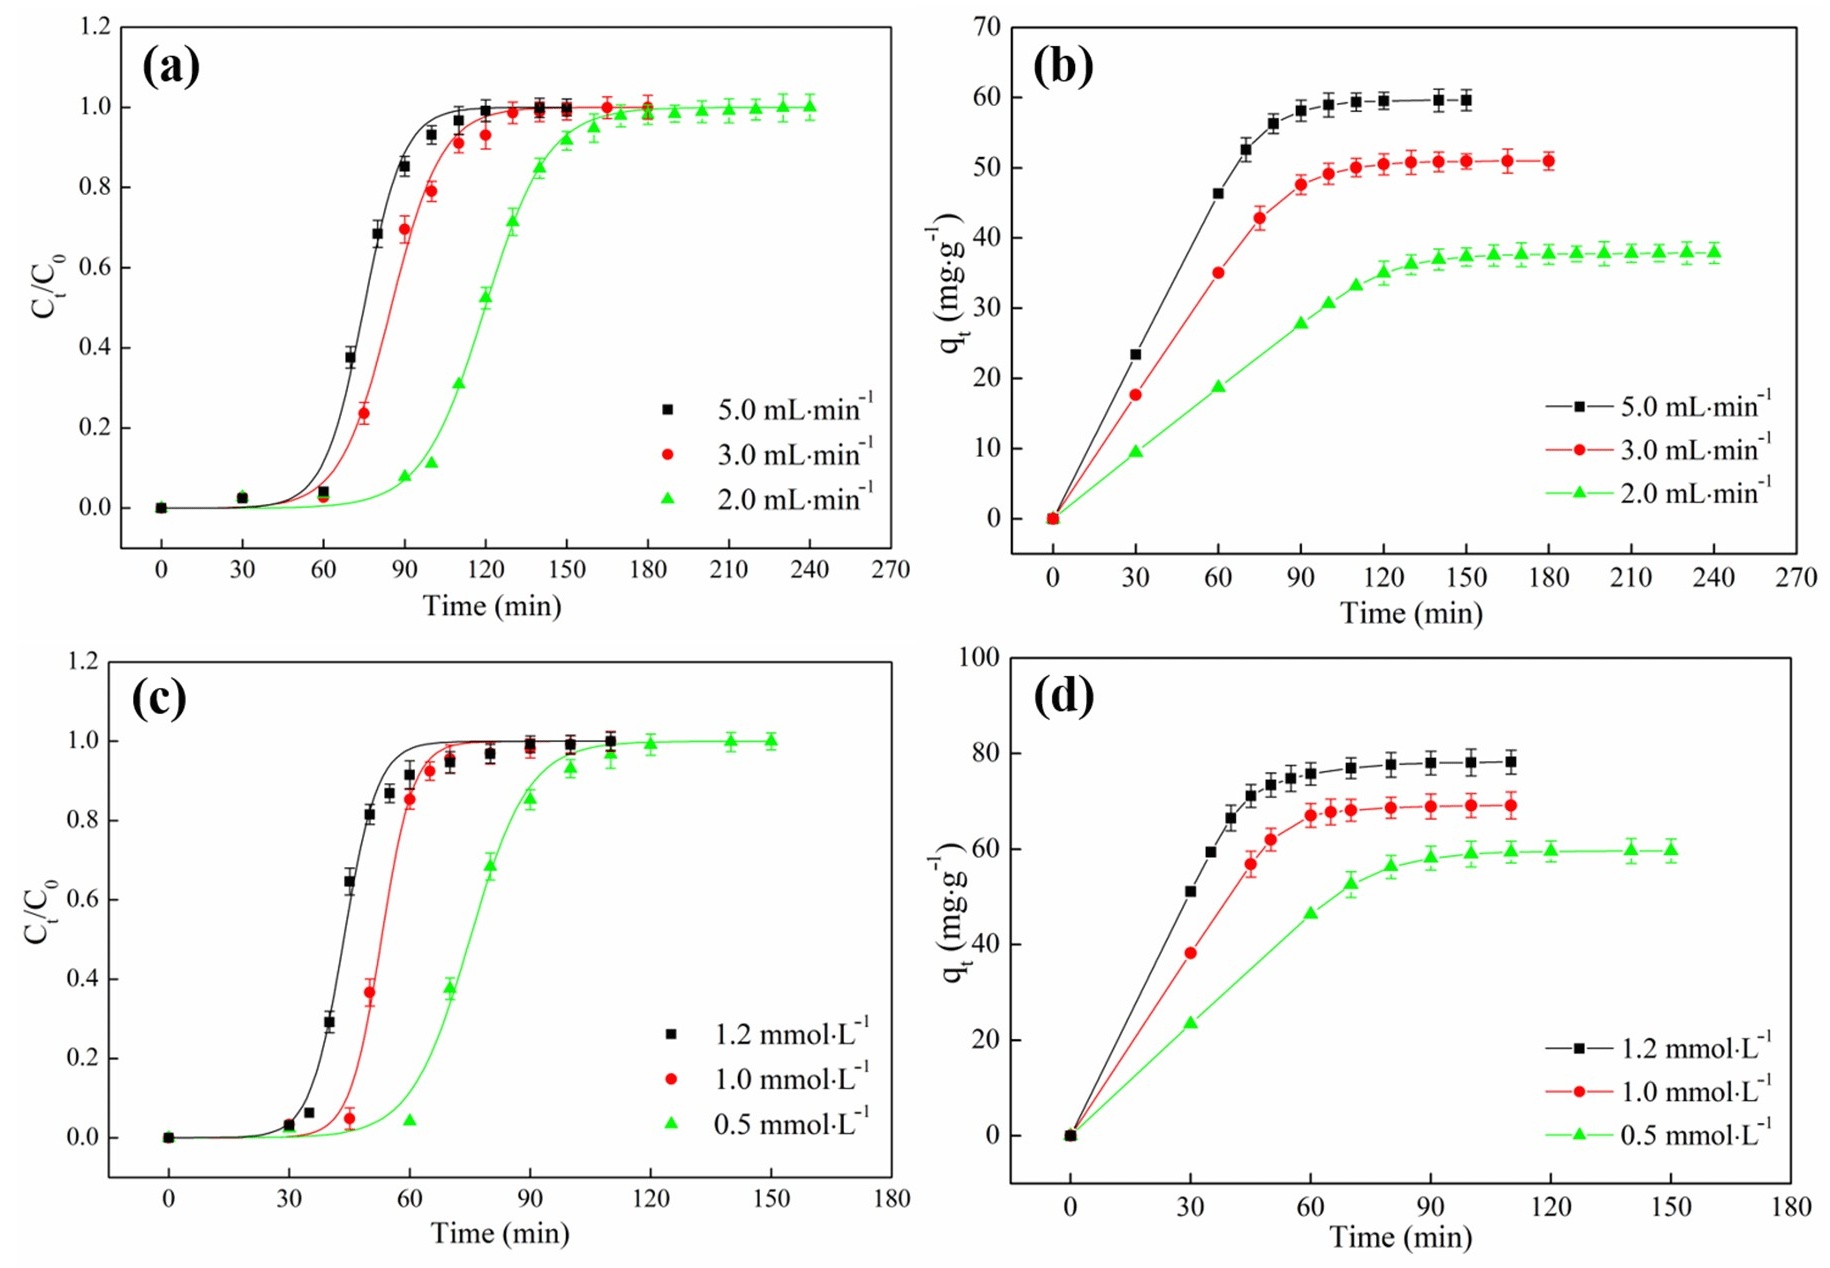
Dynamic adsorption is the predominant technique used in practical wastewater treatment processes, where flow rate and initial concentration are crucial factors influencing the effectiveness of glyphosate adsorption. The dynamic adsorption breakthrough curves of glyphosate on CeO
2/WHBC-3 at various flow rates and initial concentrations were examined, as shown in a,c. During the initial phase of dynamic adsorption, a significant number of active sites on the adsorbent surface were occupied by glyphosate, resulting in
Ct/
C0 values close to zero for the first 30 min.
As the active sites on the adsorbent surface became saturated with glyphosate, the packed column gradually approaching saturation, resulting in a rapid increase in
Ct/
C0 to 1, indicating the attainment of adsorption equilibrium. As a result, the adsorption and breakthrough curves displayed an S-shaped profile across varying concentrations and flow rates. The breakthrough time (
Ct/
C0 < 0.05) and the time to reach adsorption equilibrium decreased as the flow rate and initial concentration increased. For instance, increasing the flow rate from 2.0 mL·min⁻¹ to 3.0 mL·min⁻¹ and then to 5.0 mL·min⁻¹ reduced the breakthrough time from 84.8 min to 58.2 min and further to 53.1 min, while the time to reach saturation reduced from 174.5 min to 129.1 min and then to 109.1 min. Similarly, when the initial concentration increased from 0.5 mmol·L
−1 to 1.0 mmol·L
−1 and then to 1.2 mmol·L
−1, the breakthrough time decreased from 53.1 min to 41.1 min and then to 31.2 min, while the saturation adsorption time shortened from 109.1 min to 70.8 min and finally to 63.3 min.
The adsorption capacity of glyphosate on CeO
2/WHBC-3 column at various flow rates and concentrations was calculated using Equation (7), with adsorption capacity over time curves shown in b,d, respectively. As illustrated, the adsorption capacity of glyphosate on the CeO
2/WHBC-3 column initially increased linearly with time, then gradually levelled off as the column approached saturation and the adsorption equilibrium was achieved.
In a dynamic packed column, the adsorption capacity of glyphosate on CeO
2/WHBC-3 increased to 37.9, 51.0, and 59.6 mg·g⁻¹ at flow rates of 2.0, 3.0, and 5.0 mL·min⁻¹, respectively. Similarly, at glyphosate concentrations of 0.5, 1.0, and 1.2 mmol·L
−1, the adsorption capacities were 59.6, 69.2, and 78.2 mg·g
−1, respectively. The findings suggest that adsorption efficiency improves with higher flow rates and concentrations, indicating that CeO
2/WHBC-3 is effective for treating glyphosate-laden wastewater at high initial concentrations and rapid flow rates.
In a more in-depth analysis of the adsorption process in the dynamic packed column, we applied the Bohart-Adams and Yoon-Nelson models to various breakthrough curves (Equations (8) and (9)), with the results detailed in . The Yoon-Nelson model parameters indicated that the constant adsorption rate constant KYN dropped from 0.14 to 0.09 min
−1 with an increase in flow rate from 2.0 mL·min⁻¹ to 5 mL·min⁻¹. Additionally, the times (τ\tauτ) required for half of the adsorbate to be adsorbed at flow rates of 2.0, 3.0, and 5.0 mL·min
−1 were 119.7, 84.9, and 74.9 min, respectively. These findings suggest a direct relationship between the flow rate and the adsorption rate of glyphosate within the column.
. Effect of (<b>a</b>,<b>b</b>) flow rate and (<b>c</b>,<b>d</b>) initial concentration on the breakthrough curve and dynamic adsorption kinetics of glyphosate on the fixed bed column.
.
Fitted parameters of the breakthrough curves at different flow rates and initial concentrations.
| Model |
Bohart-Adams Model |
Yoon–Nelson Model |
| Flow rate (mL·min−1) |
KAB |
N0 |
R2 |
KYN |
τ |
R2 |
qe |
| L·mg−1·min−1 |
mg·L−1 |
min−1 |
min |
(mg·g−1) |
| 5.0 |
0.0018 |
352.6 |
0.9934 |
0.14 |
74.9 |
0.9934 |
59.6 |
| 3.0 |
0.0014 |
108.8 |
0.9941 |
0.11 |
84.9 |
0.9942 |
51.0 |
| 2.0 |
0.0011 |
396.9 |
0.9982 |
0.09 |
119.7 |
0.9982 |
37.9 |
| Concentration (mmol·L−1) |
KAB |
N0 |
R2 |
KYN |
τ |
R2 |
qe |
| L·mg−1·min−1 |
mg·L−1 |
min−1 |
min |
(mg·g−1) |
| 1.2 |
0.0011 |
150.7 |
0.9892 |
0.24 |
43.5 |
0.9892 |
78.2 |
| 1.0 |
0.0013 |
374.1 |
0.9937 |
0.25 |
52.9 |
0.9939 |
69.2 |
| 0.5 |
0.0018 |
352.6 |
0.9934 |
0.14 |
74.9 |
0.9934 |
59.6 |
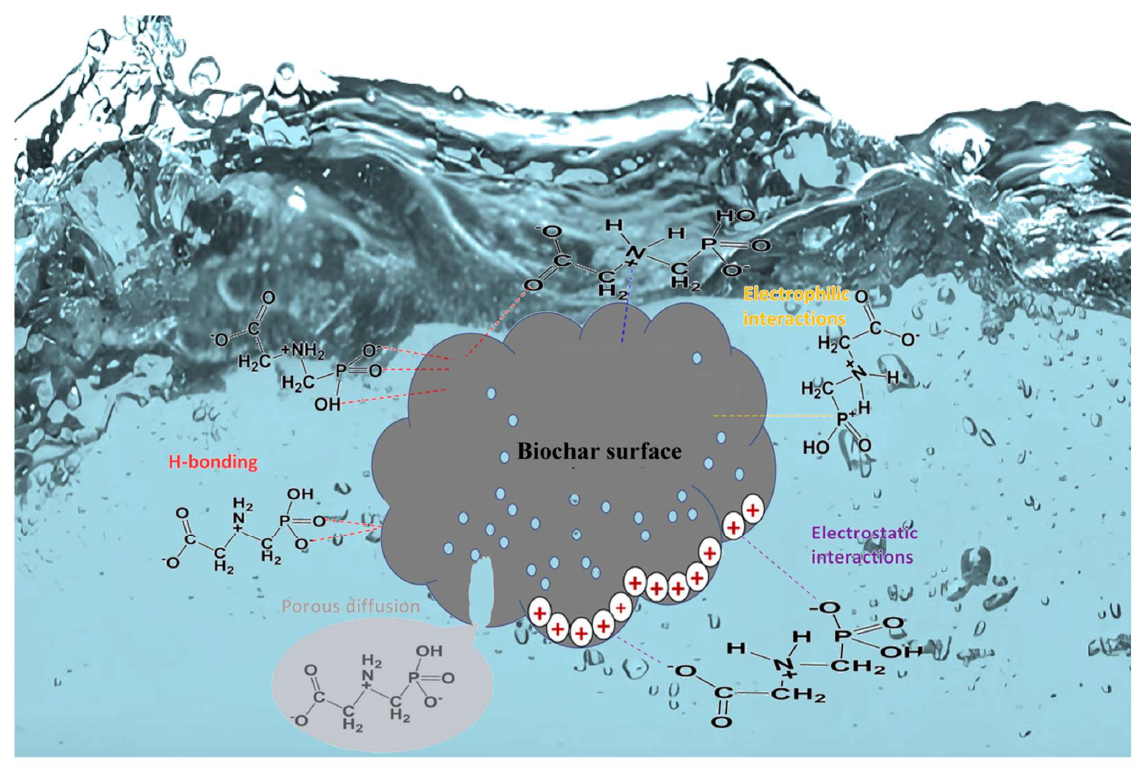
3.6. Adsorption Mechanisms
The adsorption purification method for glyphosate treatment in solution is shown in . Experiments on acidity and co-existing ions indicated that the adsorption of glyphosate by CeO
2/WHBC-3 primarily occurs through electrostatic attraction and inner-sphere complexation [
15]. CeO
2/WHBC-3 was characterized before and after adsorption using zeta potential analysis, FTIR and XPS to support the conclusions. Isothermal and kinetic data at different pH levels indicate that CeO
2/WHBC-3 exhibits superior adsorption performance for glyphosate at pH ≤ 4.0. However, when the system’s pH exceeds the isoelectric point of the adsorbent, the adsorption capacity for glyphosate significantly decreases, demonstrating a strong pH dependency in the adsorption process. Zeta potential analysis in g shows that the isoelectric point of the adsorbent decreased from 5.51 to 4.72 after adsorption, suggesting that the positively charged sites on the adsorbent surface are involved in the adsorption mechanism. This finding implies that the adsorption of glyphosate by CeO
2/WHBC-3 primarily occurs through electrostatic attraction. Additionally, FTIR and XPS characterization of CeO
2/WHBC-3 before and after adsorption further supports these findings. f shows noticeable changes in the absorption peak of Ce-O at 421 cm
−1 before and after adsorption, suggesting that Ce-OH and Ce-O groups on the adsorbent surface participate in the adsorption of glyphosate by hydrogen bonding [
15]. Additionally, the enhanced absorption peaks at 1046 cm
−1 and 878 cm
−1 may correspond to the H
2PO
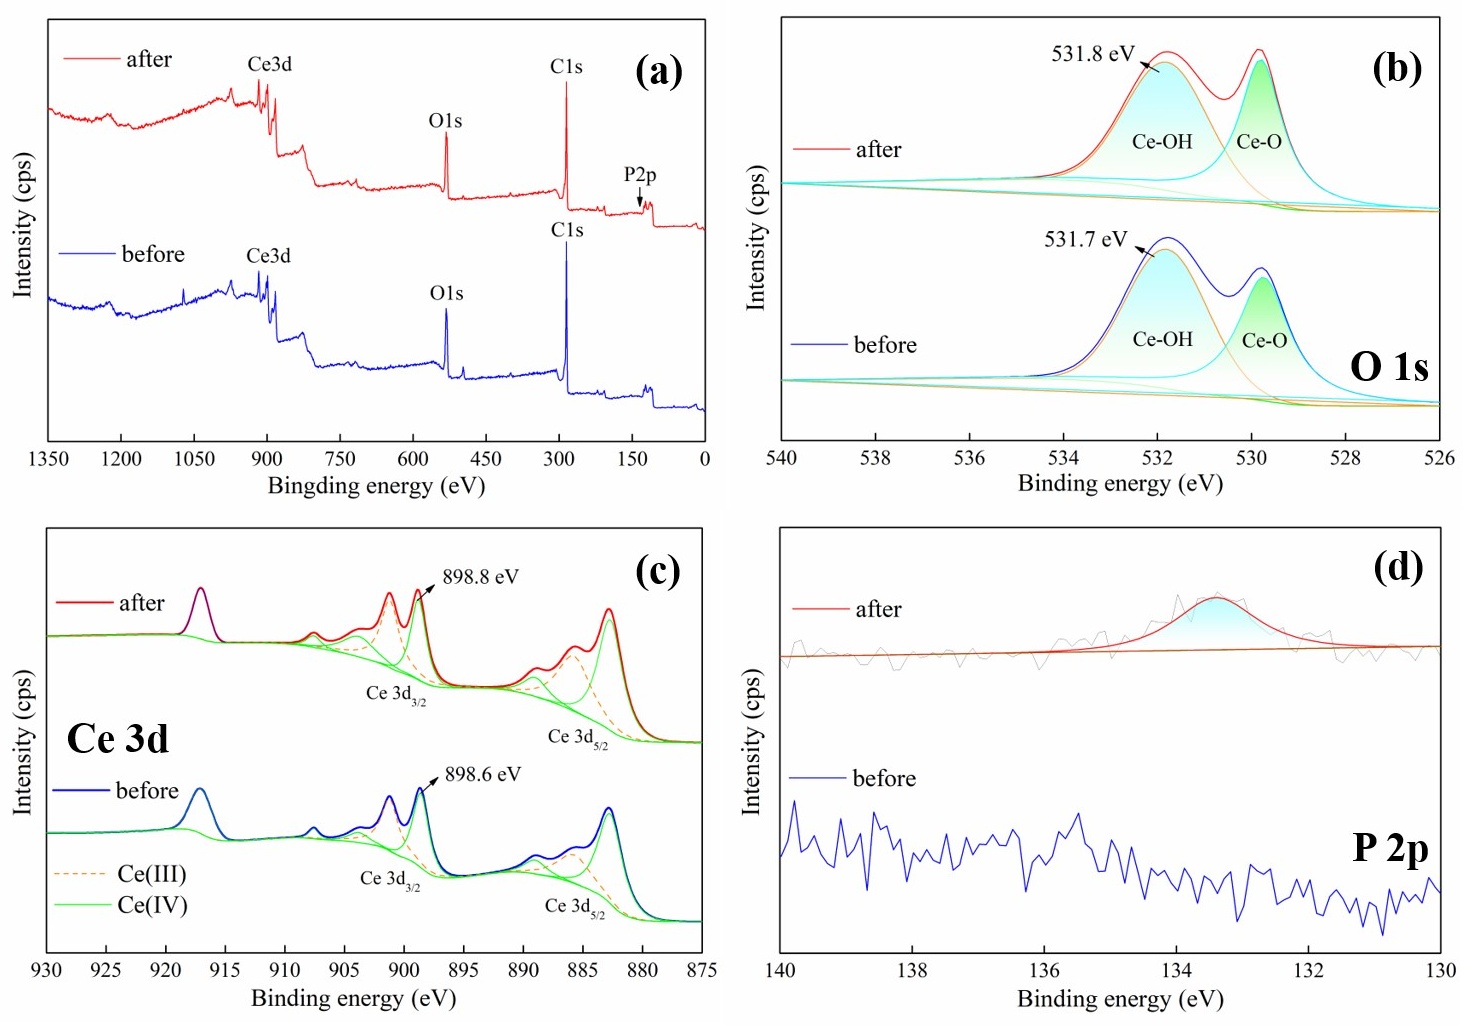
3− and P-OH structures present in glyphosate, suggesting the successful adsorption of glyphosate. The XPS spectrum of CeO
2/WHBC-3 before and after adsorption is shown in . In the Ce 3d spectrum shown in c, the binding energies at 882.7, 889.0, 898.6, 903.8, 907.58 and 917.0 eV are attributed to Ce
4+, while those at 901.2 and 885.7 eV correspond to Ce
3+. After adsorption, the Ce 3d peak at 898.6 eV shifted to 898.8 eV, indicating a higher binding energy, which suggests that Ce
4+ on the adsorbent surface may form a Ce-O-P complex structure. The peak at the binding energy of 531.7 eV in the O 1s XPS spectrum in b can be attributed to Ce-OH on the CeO
2 surface, while the peak at 529.8 eV corresponds to Ce-O within the lattice. After adsorption, the Ce-OH peak at 531.7 eV shifts to 531.8 eV, indicating a higher binding energy. Additionally, a new peak appears in the P 2p XPS spectrum in d at 133.3 eV. These results suggest that the hydroxyl groups on the surface of CeO
2 are involved in the glyphosate adsorption process [
21].
. The mechanism of glyphosate removal from solution by adsorption method.
. XPS survey spectra (<b>a</b>), O 1s (<b>b</b>), Ce 3d (<b>c</b>), P 2p (<b>d</b>) of CeO<sub>2</sub>/WHBC-3 before and after adsorption.
The authors express gratitude to the Joint Fund of National Natural Science Foundation (U24A2094), Hubei Natural Science Foundation Innovation and Development Joint Fund (2024AFD138), Hubei Three Gorges Laboratory Open Fund (SK240009) and Graduate Education Teaching Reform project of Wuhan Institute of Technology (NO. 2023JYXM09).for providing financial support for this study.
B.Z.: Writing-original draft, Methodology, Investigation, Datacuration, Conceptualization. R.W.: Validation, Investigation. J.W.: Writing—review& editing, Formal analysis, Data curation. J.Y.: Writing—review & editing. Project administration, Funding acquisition. X.L.: MethodologyFormal analysis. L.G.: Resources. Y.C.: Resources. Q.Z.: Resources. C.X.: Resources. R.C.: SupervisionResources, Project administration.
Not applicable.
Not applicable.
Data will be made available on request.
The work is funded by Joint Fund of National Natural Science Foundation (U24A2094), Hubei Natural Science Foundation Innovation and Development Joint Fund (2024AFD138), Hubei Three Gorges Laboratory Open Fund (SK240009) and Graduate Education Teaching Reform project of Wuhan Institute of Technology (NO. 2023JYXM09).
The authors declare that they have no known competing financial interests or personal relationships that could have appeared to influence the work reported in this paper.