Article Open Access
Received: 29 December 2024 Accepted: 19 February 2025 Published: 27 February 2025

© 2025 The authors. This is an open access article under the Creative Commons Attribution 4.0 International License (https://creativecommons.org/licenses/by/4.0/).
Intensive development of computer technology in recent decades has led to the mass production of components of electronic systems that are subjected to significant heating during their operation. At the same time, their continuous stable operation is possible up to a temperature of 125 °C. The latter, as well as the tightening of requirements for the semiconductor operating conditions, caused a sharp intensification of work in the field of creation and research of polymer composites with increased thermal conductivity and the growth of publications on the relevant subject [1,2,3,4,5].
The creation of competitive polymer composites with the required thermal conductivity is impossible without understanding the processes of heat transfer in polymers and knowledge of the regularities of the influence of various factors (composition, structure, temperature, interfacial adhesion, etc.) on it. At present, the mechanism of heat transfer in a solid dielectric crystalline body is satisfactorily described by the phonon theory. According to which heat transfer is realized due to collective vibrations of atoms, which take the form of displacement waves propagating throughout the body volume and creating related vibrations [6], i.e., thermal energy (energy of atomic vibrations) is transferred from the body region with a higher temperature to the region with a lower temperature by propagation of displacement waves through it. In the case of covalent bonding, the resistance to phonon propagation will be smaller the higher the bonding energy and hence the larger the elastic modulus of the molecular chain [7]. The energy of each fluctuation is quantized, and the minimum portion or quantum of the fluctuation energy is called a phonon. The above mechanism of heat transfer is the main one for dielectric materials.
It should be noted that, although the phonon model of thermal conductivity provides a satisfactory description of heat transfer in most real solids, with its help it is still impossible to determine with sufficient reliability either the absolute value of thermal conductivity or its dependence on temperature or on the composition of the material. This, in turn, predetermines the need to perform an empirical study in each specific case.
An important aspect to keep in mind when considering heat transfer in polymers is that energy transfer can take place along the macromolecule itself and between them. It has been experimentally established that the heat transfer coefficient of oriented polyethylene is 37 W/(m·K) [7], while the thermal conductivity coefficient for unoriented polyethylene is ≈100 times less than this value. This is due to the fact that thermal vibrations in the macromolecule on the main valences are transferred much faster than on the side valences, and in order to transfer the thermal impulse between molecules, it is necessary to overcome a certain barrier (thermal resistance), which is due to the presence of a weak van der Waals interaction.
For most of the polymers, the thermal conductivity coefficient is in the range of 0.1–0.5 W/(m·K), which is extremely insufficient for their wide practical application as thermal interface materials. One of the main ways to regulate this characteristic of polymers is the introduction of modifiers with high thermal conductivity into their composition. The obtained composites are very promising for the manufacturing of heat dissipating elements of small and medium capacities, as they make it possible to obtain products of complex configurations, provide high productivity of their processing, chemical resistance, ease of recycling and competitive prices in comparison with metals. However, with all the advantages mentioned above, the use of thermally conductive polymer composites is constrained in most cases by low mechanical properties, such as brittleness of the produced products, as well as high viscosity of the melt, which complicates the processing technology. This is due to the fact that achieving a thermal conductivity coefficient of more than 1.5 W/(m·K) usually requires a significant (more than 40 wt%) content of thermally conductive filler.
One of the possible ways to solve these problems is the use of blends of thermodynamically incompatible polymers as a polymer matrix, in which one of the components will contain a thermally conductive filler in an amount that provides the required level of thermal conductivity, and the second will guarantee the required level of mechanical and rheological properties of the composite. It should be noted that blend polymer composites are highly promising for use as constructional materials, which is confirmed by a noticeable activity of research in this area [8,9,10,11,12]. However, the application of blend systems as thermal conductive matrices, as well as the regularities of the influence of the polymer components properties, composition and temperature on the thermophysical properties of these materials, including thermal conductivity, are insufficiently studied. This, in turn, does not allow for the necessary understanding of the factors and mechanisms affecting the basic thermophysical properties of blends of thermodynamically incompatible polymers and the possibility of their regulation.
A classic example of a thermodynamically incompatible blend in which each of the phases is present separately is the polyamide 6/polyethylene blend. These high molecular weight compounds have significantly different thermophysical properties. This, as well as the fact that due to the introduction of compatibilizing additives in similar polymer blends, it is possible to regulate the intensity of interfacial interaction to a large extent [13,14,15,16], allows to attribute this matrix to very promising ones.
The above-mentioned determined the purpose of the work: to establish the regularities of the influence of polymer components concentration ratios and temperature on the most important thermophysical properties of the thermodynamically incompatible polyamide 6/polyethylene blend.
Polyamide 6 (PA6) for food contact products, corresponding to TU RB 500048054.037 (“GrodnoAzot”, Grodno, Belarus) was used as the object of the study. Some properties, according to the specification: melting point 213–215 °C, relative viscosity 3.3 ± 0.03 relative units determined in sulfuric acid.
High density polyethylene (HDPE) grade 276 GOST 16338 (“Lukoil”, Moscow, Russia). Some properties, according to specification: melting point 125–132 °C, MFI = 5.0–7.0 g/10 min at temperature (T) = 190 °C, load 49.0 N and capillary diameter 2.095 mm.
Before processing, PA6 was pre-dried in a Venticell 55 ECO forced-air drying oven (BMT Medical Technology s.r.o., Brno-Zábrdovice, Czech Republic) at 100 °C for 5 h. From the initial components (PA6 and HDPE) in a blade mixer, mechanical mixtures with the component ratios given in Table 1 were preliminarily obtained. The numbering of compositions in the text of the paper corresponds to the numbering in Table 1.
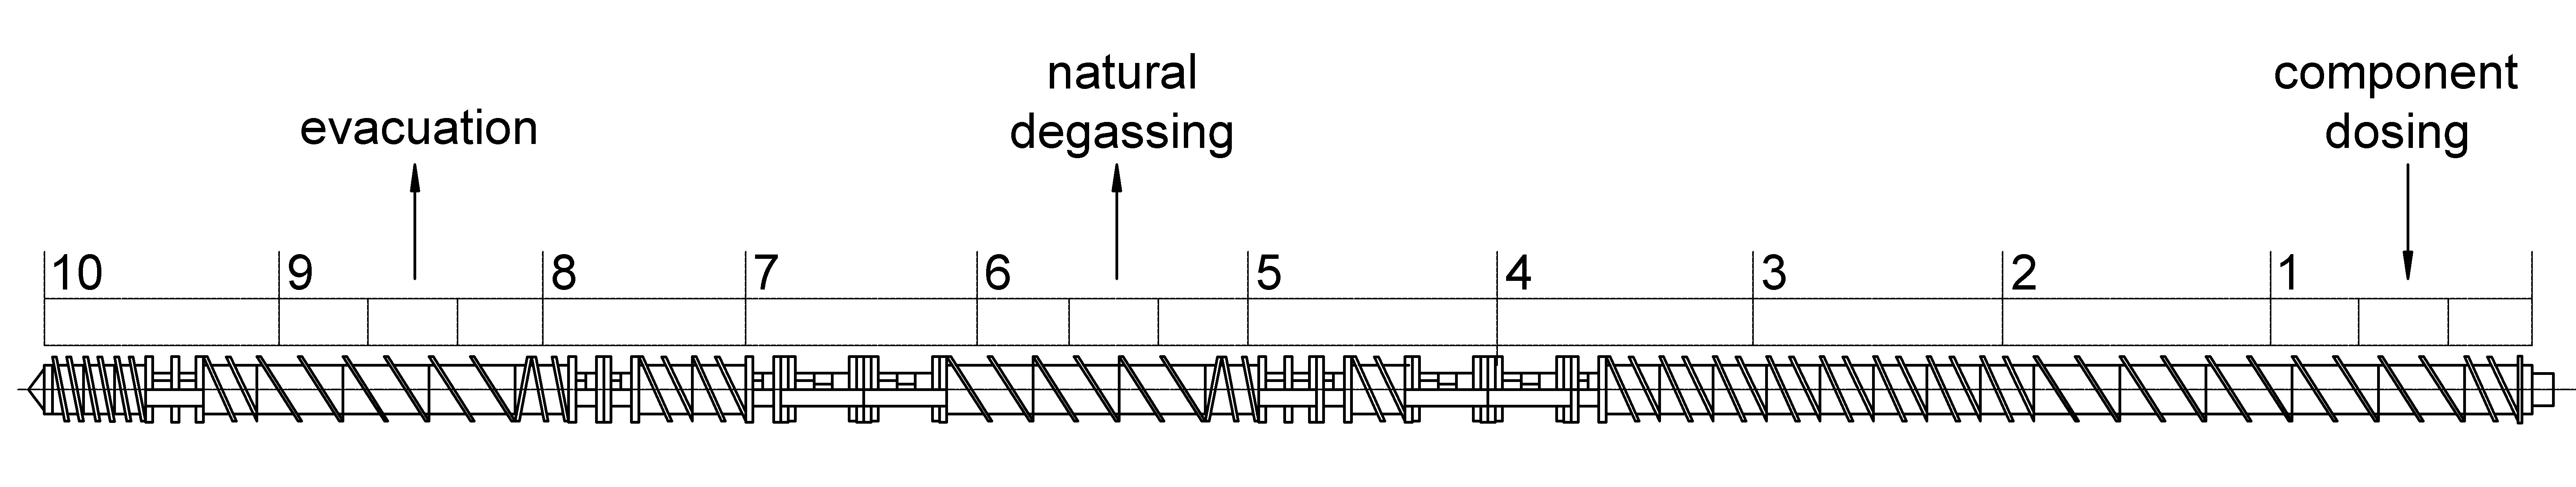
Immediately after preparation, the mechanical mixtures were compounded in the melt on the extrusion-granulation line based on a twin-screw extruder “TSSK-35/40” (Zhangjiagang Jorbin Machinery, Zhangjiagang, China) with unidirectional screw rotation (screw diameter 35 mm, L/D = 40, 10 sections of the material cylinder with independent heating and cooling and precise temperature control of each of them). The location scheme of individual sections of screws nos. 1–10 in the material cylinder of the extruder is shown in Figure 1. The temperature in the main mixing sections 4–8 of the material cylinder was maintained in the range of 190–240 °C. The screw rotation frequency was 300 rpm. The duration of polymer melt stay in the material cylinder did not exceed 30 s. In section 6, the gaseous products formed were removed from the melt naturally through the window designed for fiberglass introduction. In section 9, volatile substances were forcibly removed by vacuuming. After passing through the material cylinder of the extruder, the melt was extruded through the die in the form of four strands, which were cooled with water and pelletized.
Table 1. Compositions of test materials.
| Number of Compound | Components (here and after Concentration in wt%) | |
|---|---|---|
| PA6 | HDPE | |
| 0 ∗ | 100 | 0 |
| 1 | 100 | 0 |
| 2 | 70 | 30 |
| 3 | 45 | 55 |
| 4 | 30 | 70 |
| 5 | 0 | 100 |
* PA6 dried at 100 °C during 5 h.
The granulate of materials was dried in a Venticell 55 ECO forced-air drying oven at a temperature of 100 °C for 5 h and used to produce experimental samples by injection molding on the injection molding machine “EN-30” (“ATECH MACHINERY”, Hangzhou, China). The injection volume was 30 cm3 and the temperatures of the material cylinder were in the range of 210–240 °C.
Before testing, all the specimens were conditioned in a Memmert HPP110 climate chamber (Memmert, Schwabach, Germany) at 23 °C and 50% relative humidity for at least 30 days (which is fifteen times longer than the time required by the standards for mechanical testing and is sufficient to bring the tested composites to an equilibrium state).
Mechanical tests were performed using a universal testing machine model AGS-X (Shimadzu Corporation, Kyoto, Japan) in accordance with ISO 527-2. When determining the tensile modulus of elasticity (Et), the speed of movement of the movable clamp was 1 mm/min, for the determination of other tensile characteristics it was 50 mm/min. Type 5 blades with the length of the working part of 50 mm and the cross section of the working part of 3 × 5 mm were used as samples. The blades were produced according to the process of Section 2.3 by injecting melt into the molding cavity through one and two sprues (to obtain a junction area where the melt flows meet).
Charpy impact strength without and with a notch was determined according to ISO 179-1 using a PIT 560J pendulum-type hammer with GB4J pendulum (Wance, Shenzhen, China) at 23 °C. Bars with dimensions 4 × 10 × 80 mm were used as samples.
Differential scanning calorimetry (DSC) of composites was carried out in nitrogen gas using a DSC 214 Polyma instrument (Netzsch—Geratebau GmbH, Selb, Germany). The mass of the studied samples was within the range of 5–6 mg, the heating/cooling rate of the cell was +10/−10 °C/min, respectively. When the maximum heating temperature and minimum cooling temperature were reached, the sample was isothermally held at the mentioned temperatures for 1 min. Measurements were made during the scanning process of the second heating cycle in accordance with ISO 11357. Temperatures and thermal effects of phase transitions were determined according to ISO 11357.
The microstructure of the samples was investigated on chips obtained in liquid nitrogen using a VEGA II LSH scanning electron microscope (Tescan, Brno, Czech Republic). As samples for obtaining chips we used bars with dimensions 4 × 10 × 80 mm, which were pre-cooled in liquid nitrogen for 30 min.
To determine the thermal diffusivity (α), heat capacity (cp) and thermal conductivity coefficient (λ) the LFA 447 NanoFlash instrument (Netzsch—Geratebau GmbH, Selb, Germany) was used. The measurements were performed in the temperature range from +20 to +160 °C according to ISO 22007-4. The samples were disks with a diameter of 25.4 mm and a thickness of 2 mm.
The densities of the obtained composites (ρ) were determined by the immersion method according to ISO1183 (method A) in n-heptane (GOST 25828) on samples cut from the middle part of disks intended for thermophysical tests.
To determine the density of the studied blends (ρb, g/cm3) by immersion method, the formula was used:
where mS,A is the apparent mass of the specimen in air, g; mW is the apparent mass of the specimen in the immersion liquid, g; ρIL is the density of the immersion liquid at 23 °C, g/cm3.
To determine the calculated density of the investigated composites (ρbt, g/cm3), the formula was used:
where wPA6 is the amount of PA6 in the blend; ρPA6 is the density of PA6 determined by immersion method, g/cm3; wHDPE is the amount of HDPE in the blend; ρHDPE is the density of HPDE determined by immersion method, g/cm3.
To calculate the coefficient of thermal conductivity (λ, W/(m·K)), the formula was used:
where α is the thermal diffusion, mm2/s; cp is the specific heat capacity, J/(kg·K); ρ is the material density, g/cm3; T is the temperature of the sample, °C.
PA6 is one of the most common constructional plastics due to its combination of high strength properties, wear resistance, affordability, ease of producing composites based on it and ease of recycling. However, PA6 has a very significant disadvantage: It absorbs water from the environment, which has a plasticizing effect on it, noticeably changing the mechanical properties of both PA6 itself and composites based on it [17,18]. Water absorption reduces elastic modulus and tensile yield strength, increases relative elongation and electrical conductivity, etc. Therefore, a preliminary evaluation of the effect of water on the parameters of the most important mechanical properties of PA6 was fulfilled. For this purpose, PA6 pre-dried at 80 °C for 8 h and PA6 conditioned for more than 30 days at 23 °C and 50% RH were tested. The results are presented in Table 2, compositions 0 and 1.
It was found that water sorbed PA6 during conditioning leads to a sharp decrease in Et by ≈1.6 times, σy by ≈1.4 times and an increase in εB of samples with and without junction area by ≈2.7 and 2.4 times, respectively. The aiN value of the samples with a sharp notch also increases slightly (≈8.5%) after conditioning. Thus, water works as a very effective plasticizer, significantly reducing the stiffness and strength of PA6 and increasing its plasticity. This fact requires mandatory consideration in predicting the performance characteristics of products.
Since PA6 and HDPE are incompatible polymers, and water vapor has a high permeability, it should be expected that its sorption of PA6 in the PA6/HDPE composite should proceed in the same way as in the original PA6 and be accompanied by similar changes in properties. It should be noted that most parts operate in conditions in which the relative humidity of the environment is more than 50%. In view of this fact, as well as taking into account the recommendations of the standards for mechanical testing, it is of practical interest to study samples preconditioned according to the regime described in Section 2.4 and in equilibrium with respect to the water sorption parameter.
Table 2. Some important mechanical properties of PA6/HDPE blends.
| Compound Number according to Table 1 | Parameter Name ∗ | ||||||
|---|---|---|---|---|---|---|---|
| Еt, GPa | σy, MPa | а, kJ/m2 | aiN, kJ/m2 | εB, % | |||
| without Junction Area | with Junction Area | ||||||
| 0 | 2.11 ± 0.2 | 54.4 ± 2.6 | N/B | 26.5 ± 1.2 | 105.0 ± 5.1 | 98.2 ± 4.9 | |
| 1 | 1.36 ± 0.1 | 39.2 ± 1.9 | N/B | 28.8 ± 1.3 | 284.7 ± 10.2 | 236.9 ± 11.1 | |
| 2 | 1.23 ± 0.1 | 30.1 ± 1.5 | N/B | 19.6 ± 1.0 | 95.4 ± 4.4 | 0.9 ± 0.04 | |
| 3 | 1.14 ± 0.1 | 28.3 ± 1.4 | 23.6 ± 1.1 | 13.1 ± 0.6 | 20.1 ± 1.0 | 0.6 ± 0.03 | |
| 4 | 1.08 ± 0.1 | 26.2 ± 1.2 | 19.2 ± 1.0 | 9.8 ± 0.4 | 24.3 ± 1.1 | 0.5 ± 0.03 | |
| 5 | 1.04 ± 0.1 | 26.1 ± 1.1 | N/B | 14.7 ± 0.7 | 136.5 ± 6.7 | 142.1 ± 7.1 | |
* Et—tensile modulus; σy—tensile stresss at yield; а—Charpy impact strength on unnotched samples; aiN—Charpy impact toughness on specimens with sharp notch; εB—tensile stress at break; N/B—the specimen didn’t break down.
As a result of the mechanical tests, it was found that the higher the amount of polyolefin, the lower the values of Et and σy, and at the maximum content of HDPE in the mixture (70%) the reduction reaches ≈20% for Et and σy ≈ 33% for σy. This is due to both the weak interfacial interaction between PA6 and HDPE and the fact that HDPE has strength characteristics significantly lower than PA6. At the same time, εB for PA6/HDPE blends drops dramatically, reaching a maximum decrease of ≈14 times when the “interpenetrating network” structure is formed in the blend at the polyolefin content of 55%. Since the relative elongations of PA6 and HDPE for both the samples without and with a junction are, respectively, more than 230 and 130%, this effect can only be explained by the lack of compatibility between polar PA6 and nonpolar HDPE.
Due to the very low interfacial interaction between the two types of polymers under study, the junction region formed during injection molding of test samples (tensile blades) has a very low deformation ability and breaks at εB values of less than 1%. This level of εB is characteristic of very brittle materials and seriously limits the possibility of using PA6/HDPE composite, or makes it impossible at all.
Additional confirmation of the almost complete absence of interfacial interaction is the change in the value of impact strength, which also decreases. It is especially well observed on the samples with a sharp notch. Thus, with the increase of the polyolefin fraction up to 70% aiN drops almost 3 times.
The problem of increasing the intensity of interfacial adhesion is easily solved by the introduction of compatibilizing additives that have a high degree of compatibility with both components of the polymer blend and are located at their interface, enhancing the interaction between them. In this case, the level of mechanical properties is significantly increased.
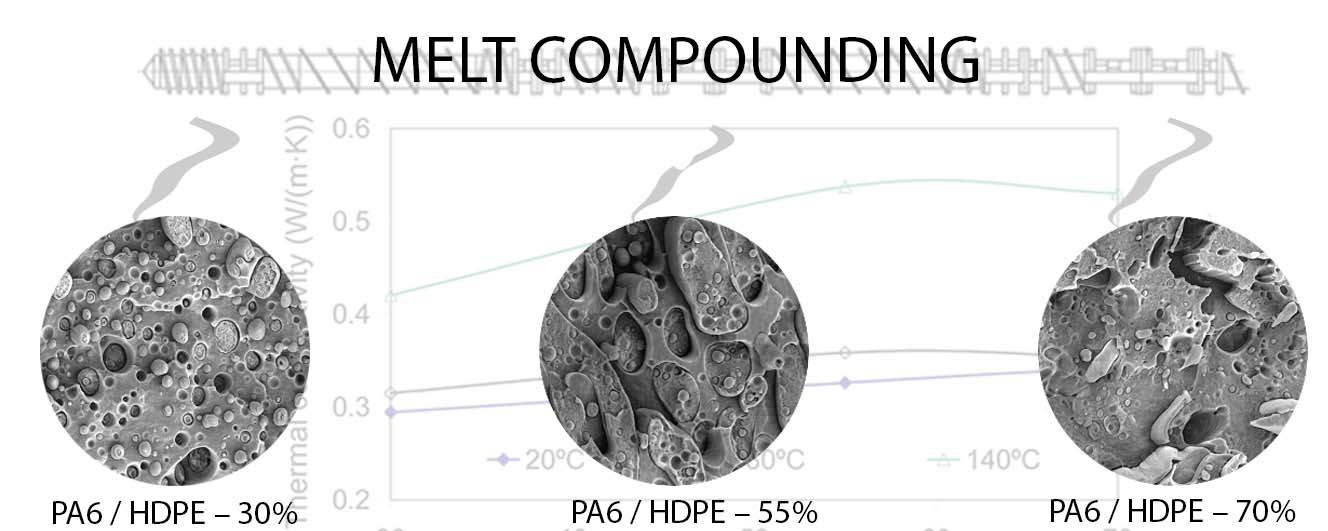
Scanning electron microscopy (SEM) was used to better understand the forming structure of the PA6/HDPE blend, especially since the range of HDPE concentrations investigated allows for obtaining not only phase inversion (HDPE content of 30 and 70%), but also an interpenetrating network structure at HDPE concentration of 55%.
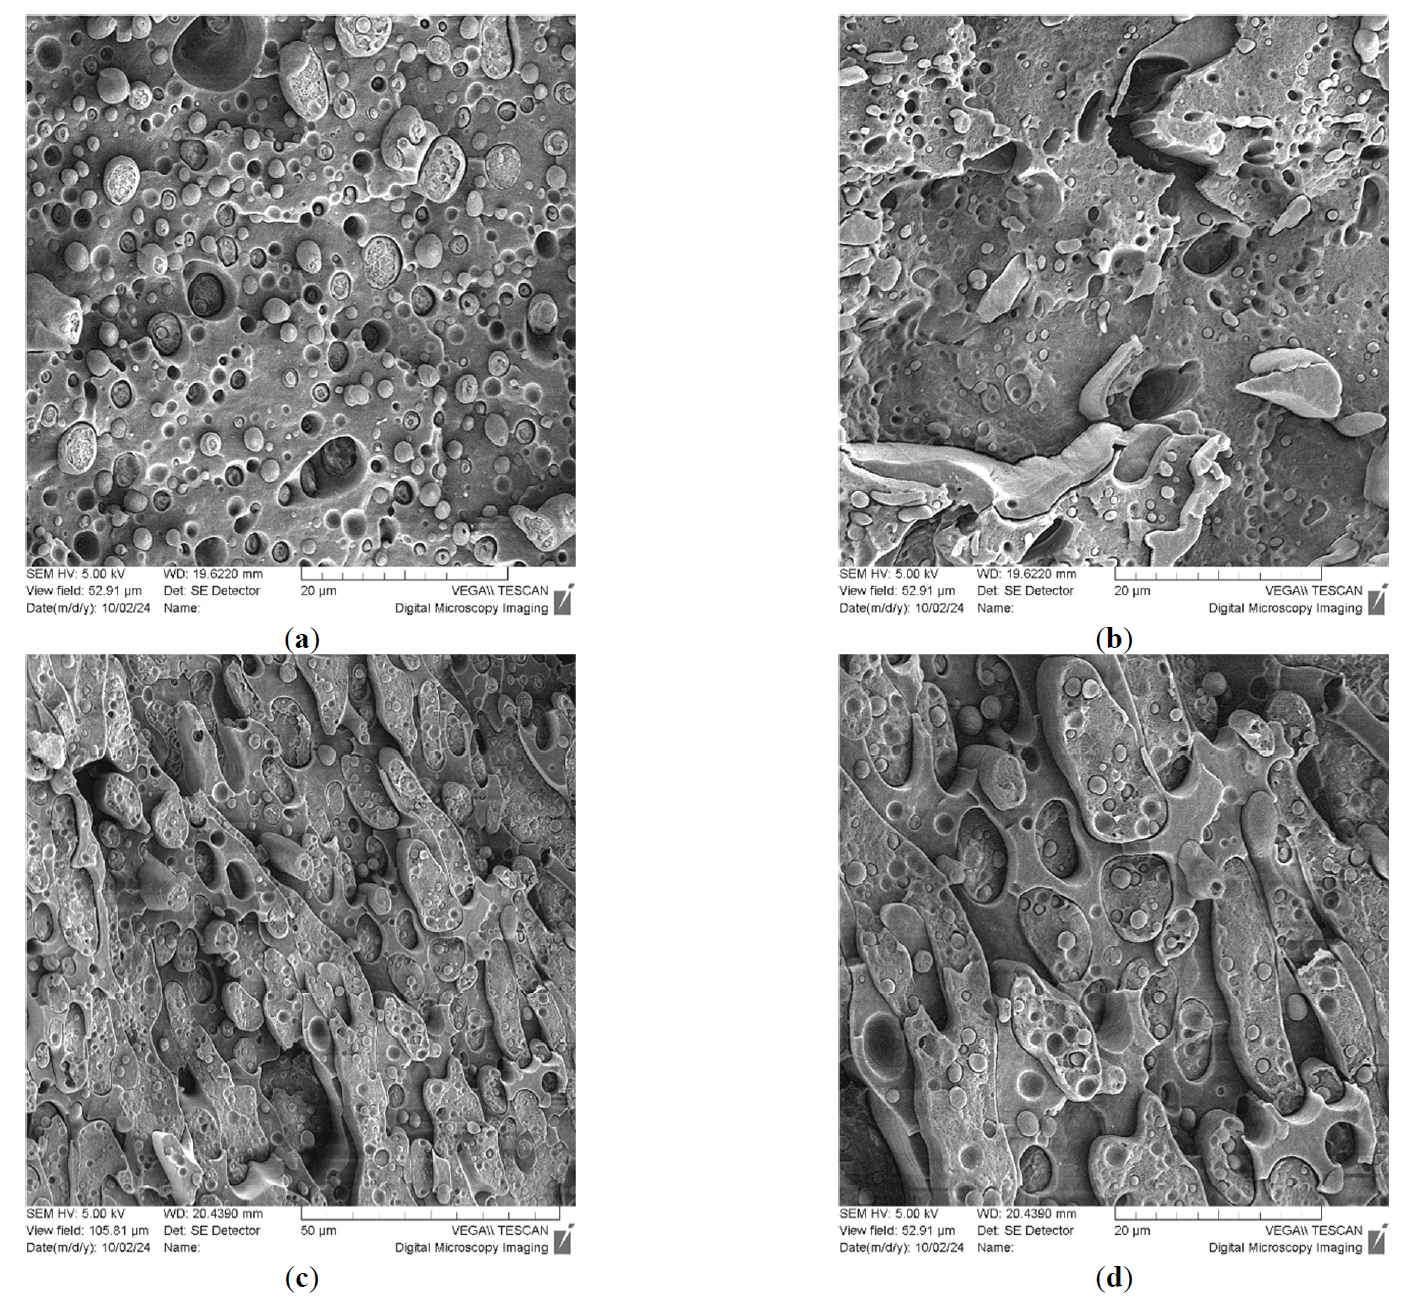
By SEM method, it was found that in case of significant predominance of the fraction of one of the polymers, it forms a continuous phase (dispersion medium), Figure 2a,b, in which the second polymer (dispersed phase) is distributed. The shape of the particles of the dispersed phase is different and presumably depends on its rheological properties. Thus, in the case of polyolefin, which has a substantially higher viscosity, it forms spherical-like particles with sizes mostly in the range of 1 to 8 μm (Figure 2a), uniformly dispersed in the PA6 volume. In turn, PA6 forms both spherical-like particles with sizes ranging from 1 to 3 μm and very large elongated plate-like inclusions of the polyamide phase with lengths up to 22 μm or more and widths of about 6 μm. The visually smoother surface on the chips is formed by PA6, while the rougher surface is formed by HDPE.
It should be noted that when the dispersion medium is formed from both PA6 and HDPE, a clear boundary is observed between the phases of the blends. In the case when the disperse phase is HDPE, when the sample cooled in liquid nitrogen is spalled, the crack propagates through the volume of the matrix polymer and almost always along the PA6/HDPE interface. The resulting surfaces are smooth. If the dispersed phase is PA6, the surface at the polymer particle breakout sites is also smooth. These results are an additional confirmation of weak interfacial interaction in the PA6/HDPE blend and, as a result, its low mechanical properties.
It is known that at close concentrations of the blended polymers a structure of the so-called “interpenetrating network” is formed when both components form a continuous phase in each other [9]. The study of chipping of the blend PA6/HDPE–55% revealed a rather complex spatial distribution of its components, presented in Figure 2c,d, which is most likely due to the rheological properties of polymers, flow and interaction of their melts during compounding and subsequent injection molding. The resulting structure is multilevel and it represents practically continuous alternating layers of blended polymers, approximately 5–30 μm thick. Along with this, in each of the continuous phases there are inclusions of the second component. Thus, in the volume of polyolefin there are mainly spherical-like (size ≈2 μm) particles of PA6. At the same time, both spherical-like (sizes 3–15 μm) and ellipsoid-like (sizes 3–16 μm, by 6–24 μm) HDPE particles are present in the PA6 phase. In turn, these HDPE particles contain spherical-like (size ≈2 μm) PA6 inclusions. The detected structure of the polymer interpenetrating network is very complex, which makes the calculation of some of its most important thermophysical characteristics (e.g., α and λ) a very difficult task.
The interface interaction of the blended phases should affect the density of the resulting composite, since the interfacial layer will have properties different from both components. In order to evaluate the indicated influence, a comparison of the estimated density calculated by formula (2) and experimentally determined by the immersion method was used (Table 3).
Table 3. Calculated and experimentally determined by immersion method density of PA6/HDPE blends.
| Compound Number according to Table 1 | Density, g/cm3 | Difference between ρb and ρbt, % | |
|---|---|---|---|
| Calculated | Experimental | ||
| 1 | 1.1230 | 1.1230 | 0.00 |
| 2 | 1.0702 | 1.0700 | 0.02 |
| 3 | 1.0262 | 1.0260 | 0.02 |
| 4 | 0.9998 | 1.0000 | −0.02 |
| 5 | 0.9470 | 0.9470 | 0.00 |
As follows from the obtained data, despite the fact that PA6/HDPE blends are incompatible and characterized by a very low level of interfacial interaction, the values of calculated and experimental densities are practically equal. The existing deviation is considerably less than the experimental error and is not statistically significant. Two reasons for this phenomenon seem to be the most probable. The first one is that no interfacial layer is formed, and both components during cooling from the melt practically do not influence the supramolecular structure of each other. The result is the matching of the calculated and measured densities. The second one, an interfacial layer is formed, but there is no change in the final density of the blend due to the difference between the densities of the layer and the polymer matrix. This is possible if there is an influence of polymers on the amorphous-crystalline structure formation of one or both of these components, which is compensated by the contribution of the interfacial layer to the final value of the composite density. To verify these assumptions, DSC analysis of the studied blends was performed, and the results are presented in Figure 3.
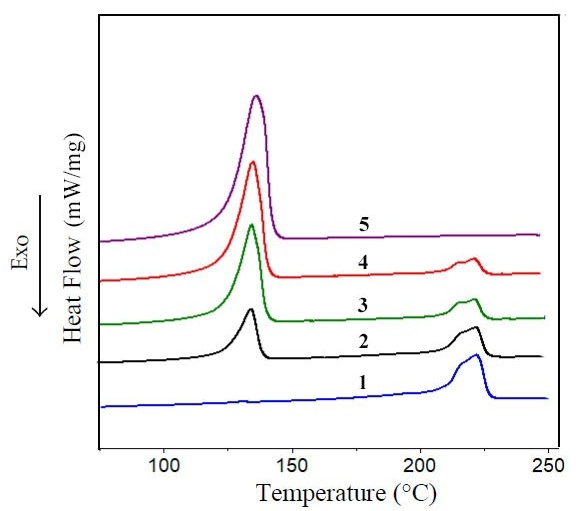
On heating curves 1 and 5, Figure 3, there are melting peaks of PA6 and HDPE. Moreover, PA6 has a double peak with maximums at temperatures ≈214.8 and ≈224.0 °C, which indicates the complex structure of the PA6 crystalline phase. HDPE has a single melting peak with a maximum at 137.6 °C.
It should be noted that the DSC heating curves of PA6/HDPE blends show both melting peaks of these polymers, which have the shape and location of the maxima close to those of the original components. The temperature variations of the maximum melting peaks of both PA6 and HDPE do not exceed 2%, which is less than the error of this method. In addition, after complete melting of the crystalline phase of polymers and isothermal holding at 250 °C (to exclude the thermal prehistory of samples) with subsequent cooling at the same rate and under almost identical conditions, the difference in the temperatures of the crystallization peak maxima of the above materials also does not exceed 2%. This, in turn, is one of the signs that the two components of the blend practically do not interact with each other either through physical or chemical bonds.
The analysis of the energy change (ΔHm) required for melting of the crystalline phase of polymers revealed the following features. The enthalpy of melting of polyolefin is weakly affected by the ratios of PA6 and HDPE components of the blend, Table 4. Thus, the fluctuations of this parameter in the whole range of concentrations studied do not exceed ≈7%. Moreover, the maximum increase in ΔHm is achieved when HDPE forms a continuous phase in the PA6/HDPE blend. From this it can be concluded that although the conditions of HDPE crystallization change (polyolefin passes through the state of dispersed phase—interpenetrating network—dispersion medium with PA6 particles uniformly distributed in it, and this, at least, should change the conditions of heat dissipation), still it does not significantly affect the course of HDPE crystallization and, as a result, its crystallinity. This fact can be related to the high crystallization ability of HDPE.
Table 4. Results of DSC analysis of PA6/HDPE blends.
| Compound Number according to Table 1 | HDPE—Component | PA6—Component | |||||
|---|---|---|---|---|---|---|---|
| Parameter Name ∗ | |||||||
| Tm, °С | Tcr, °С | ΔHm, J/g | Tm, °C | Tcr, °С | ΔHm, J/g | ||
| 1st Melting Peak | 2nd Melting Peak | ||||||
| 1 | - | - | - | 214.8 | 224.0 | 187.6 | 77.1 |
| 2 | 133.6 | 115.70 | 212.3 | 214.8 | 222.9 | 187.3 | 68.3 |
| 3 | 134.6 | 115.70 | 205.3 | 214.8 | 222.2 | 187.3 | 74.6 |
| 4 | 135.9 | 115.20 | 216.4 | 214.5 | 223.5 | 187.7 | 95.0 |
| 5 | 137.6 | 112.80 | 203.2 | - | - | - | - |
* Tm—melting peak maximum temperature; Tcr—crystallization peak maximum temperature; ΔHm—enthalpy of material melting, taking into account the proportion of component of the blend.
For PA6, an ambiguous change in ΔHm from the HDPE fraction in the blend is observed. Thus, at 30% polyolefin content, the ΔHm of PA6 decreases by ≈11% compared to the ΔHm of unfilled PA6. However, as the HDPE concentration in the blend increases further, the enthalpy of melting of polyamide increases by up to ≈23% compared to the initial PA6. Any significant participation in the above process of the polyolefin component of the blend through interfacial interaction seems very unlikely. The influence of geometrical factors (e.g., PA6 particle size), heat dissipation conditions in the blend, etc. on the PA6 crystallization process cannot be excluded. This question requires a more detailed study with the involvement of additional methods for analyzing the structure of polymers.
Since the density of the crystalline phase of PA6 is higher than that of the amorphous phase, the data obtained testify in favor of the previously stated assumption about the compensation of the underdensity of the interfacial layer by increasing the density of one of the components. Summarizing the above, it can be assumed that if chemical and physical interactions between the components of the blend PA6/HDPE are practically absent, and the interfacial layer itself is underdense, the interface between PA6 and HDPE should have a high thermal resistance.
In view of the fact that the use of polymer blends seems to be very promising for the creation of thermally conductive composites with an increased coefficient of thermal conductivity, due to the selective redistribution of the thermally conductive filler between the components of the blend [19,20], it was of considerable interest to study the effect of the ratio of PA6 and HDPE in the PA6/HDPE composite and temperature on the thermal conductivity coefficient of the above blend and related parameters (thermal diffusivity and heat capacity).
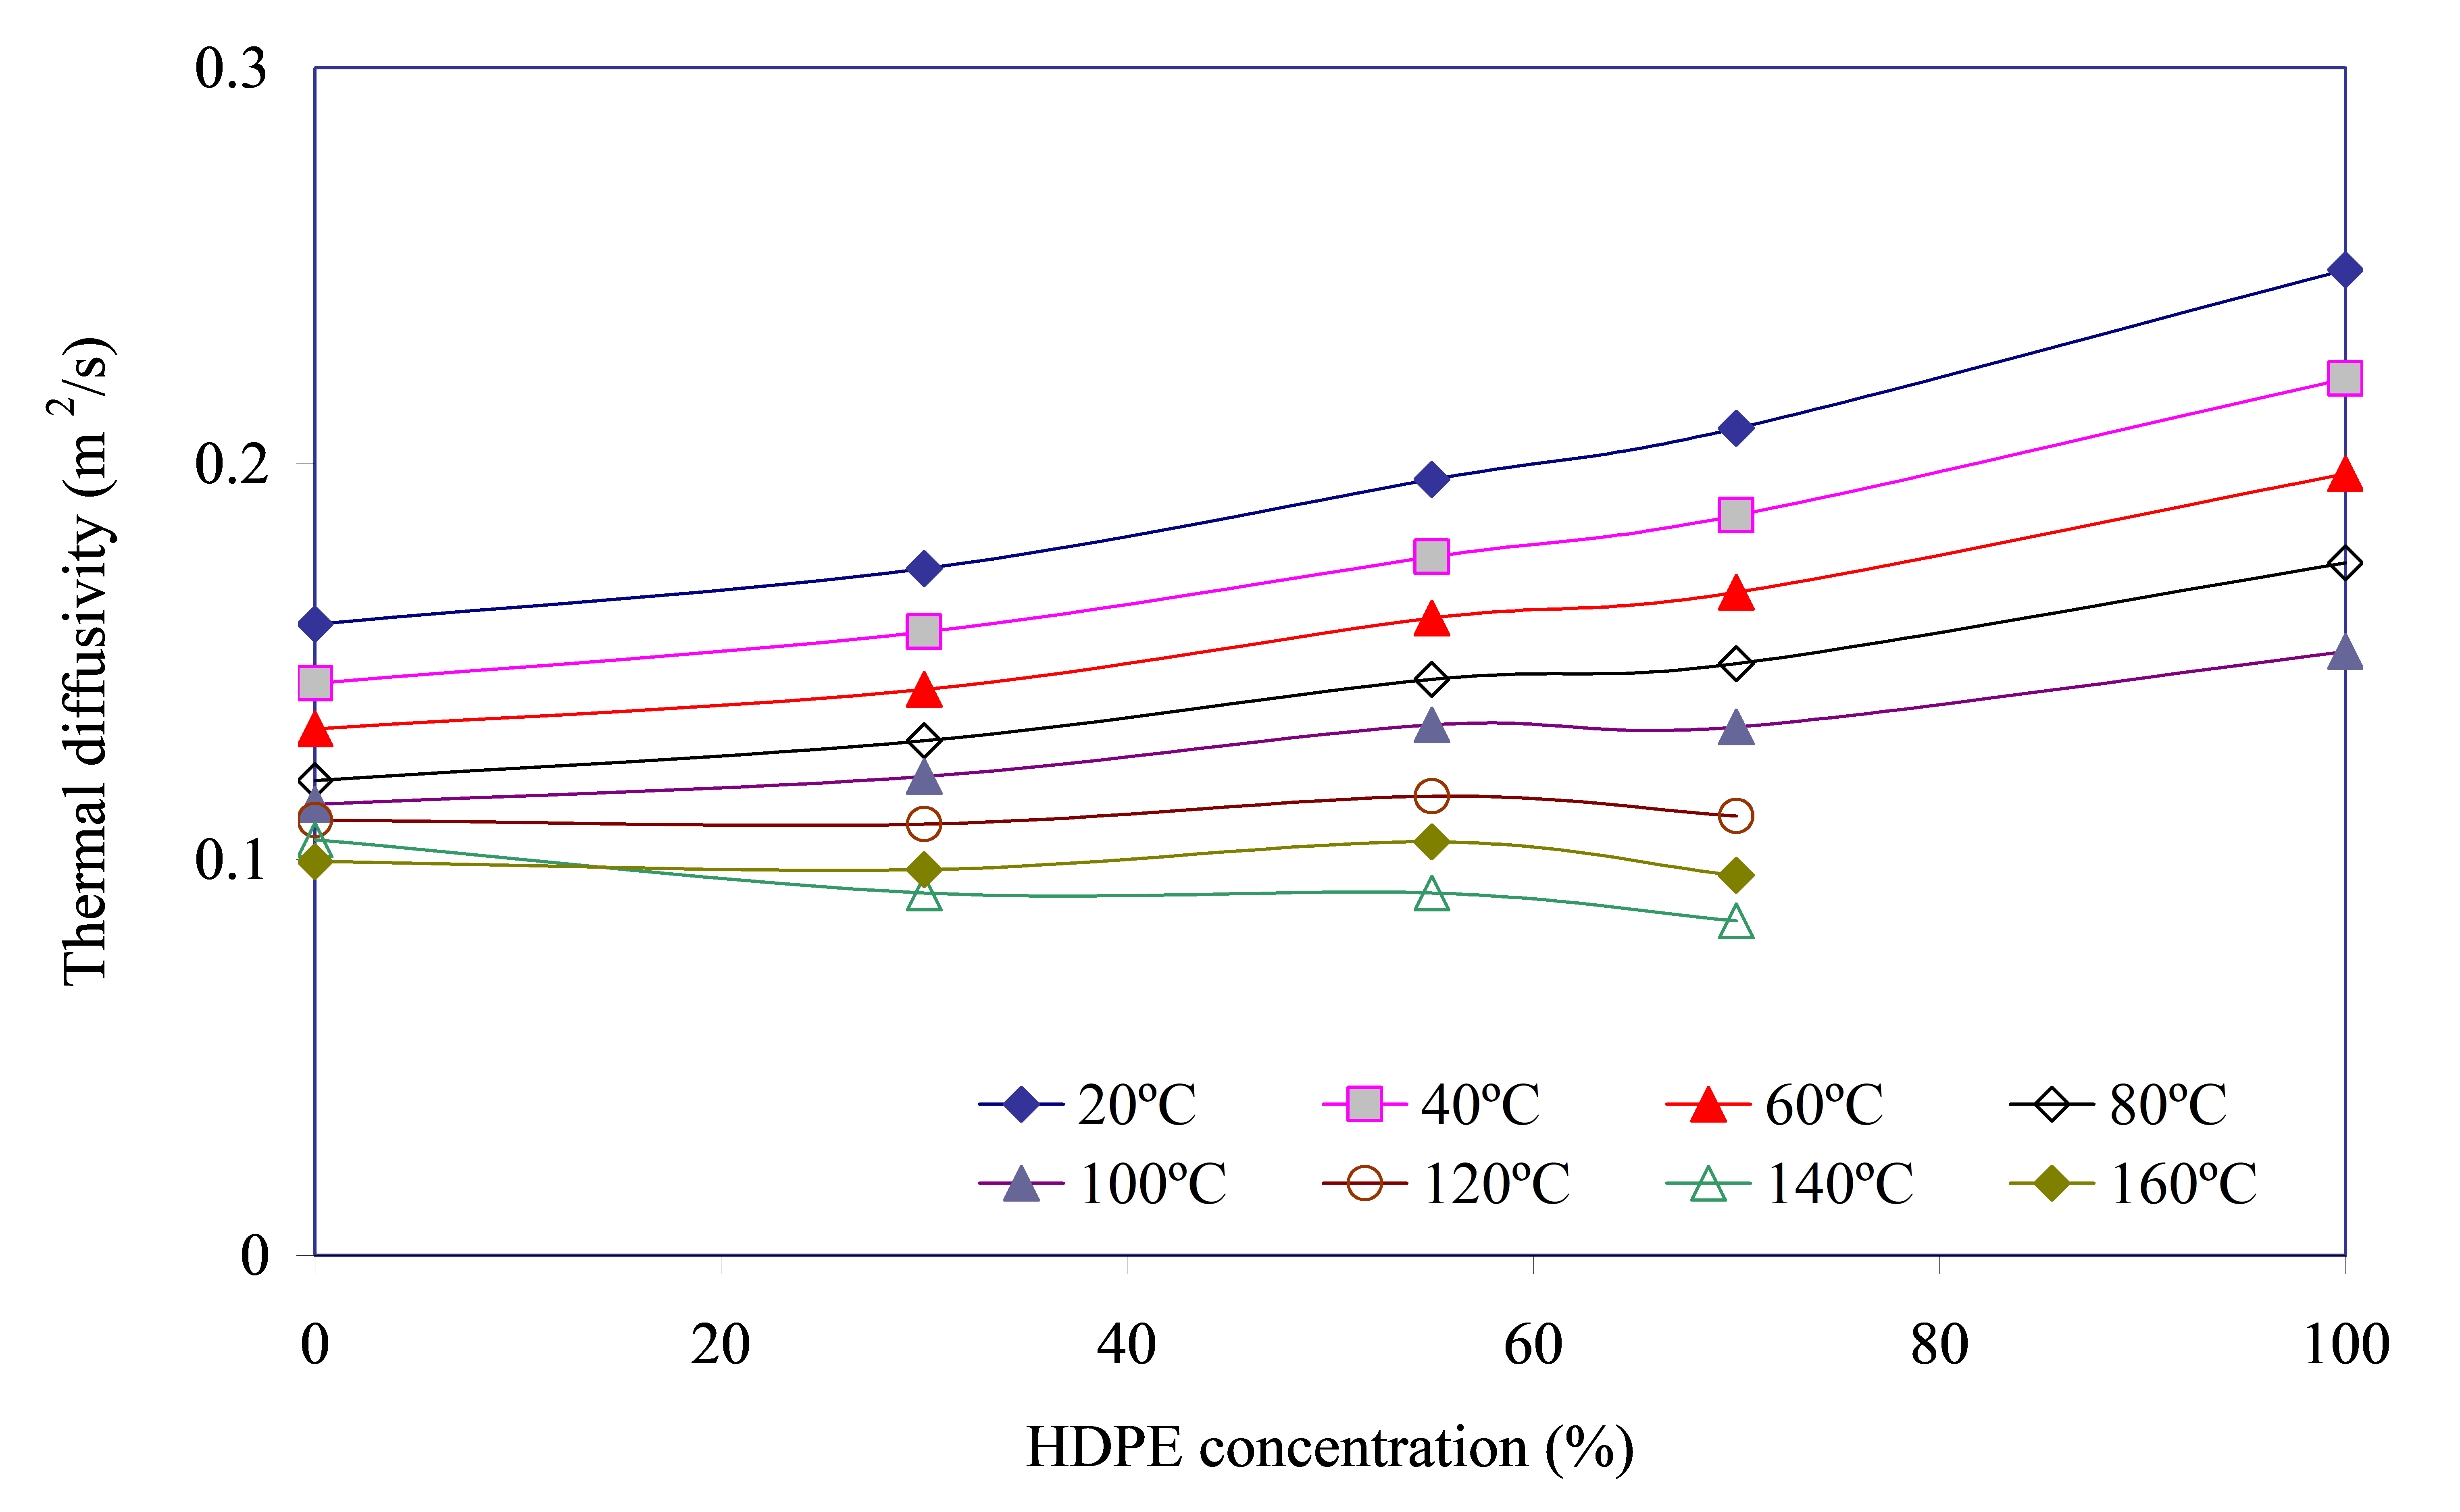
The data on the values of α and cp of initial polymers and their blends were obtained by the light flash method, Figure 4, Figure 5 and Figure 6. The value of λ was calculated by formula (3) using NETZSCH LFA Analysis Version v. 6.1.2.
It should be noted that α increases with increasing HDPE fraction in the blend. It is caused by a higher level of α values of polyolefin itself. So, at 20 °C α of HDPE is greater than that of PA6 by ≈1.6 times. As a result the value of α for blends is higher compared to unfilled PA6. Studies of HDPE by laser flash method at temperatures above 120 °C were not carried out due to the risk of heat destruction of the sample and damage to the LFA measuring cell.
Temperature ranges from 20 to 80 °C (almost no changes in the crystalline phase of HDPE and PA6, Figure 3). The parameter α of PA6, HDPE and PA6/HDPE blends decreases almost linearly with increasing temperature, Figure 4. The observed changes can be attributed to the following factors: Increasing temperature leads to the weakening of intermolecular bonds and the intensification of segmental mobility of both PA6 and HDPE macromolecules. This, in turn, leads to an increase in the scattering of phonons carrying thermal energy and thus reduces α. Moreover, for the initial PA6 and HDPE, the magnitude of the decrease in thermal diffusion (Δα) with increasing temperature for every 20 °C is ≈10±1%. This may indicate in favor of the fact that the cause of the indicated decrease is the same, regardless of the nature of the polymer: the destruction of intermolecular bonds.
Temperature ranges from 80 to 100 °C (the start of changes (melting) of the HDPE crystalline phase changes of PA6 crystalline phase are absent, Figure 3). As T increases up to 100 °C, the value of Δα decreases almost twice. Since at the indicated temperature the HDPE crystalline phase only begins to transition into the melt (Figure 3), it can be assumed that this process, although it affects thermal diffusion, is not determinant. In addition, probably, the rate of decrease in the intensity of intermolecular interaction in polyolefin in the state close to melting reduces and, as a result, the contribution of this factor to the value of α also weakens. Based on the above, it can be assumed that the value of Δα is determined, to a greater extent, by the destruction of intermolecular bonds in PA6.
Temperature ranges from 100 to 140 °C (a significant part of the crystalline phase of polyolefin passes into the melt and the temperature of HDPE melting peak maximum is reached, there are no changes in the crystalline phase of PA6, Figure 3, Table 4). It should be noted that the fastest and with minimal losses phonon propagation pathway in polymers is its crystalline (ordered) phase [21]. Heating of HDPE above 100 °C leads to the consequent destruction of polyolefin crystallites, i.e., to an increase in the portion of the amorphous phase. The phonon propagation velocity in disordered (amorphized) regions is significantly lower than in crystalline ones. This is reflected in the sharp growth of Δα up to ≈12% when heating the blend from 100 to 120 °C and up to 23% when further increasing the temperature of the blend sample up to 140 °C. It is most likely that the additional increase of Δα from 12% to 23% at the growth of T from 120 to 140 °C is caused by the maximum intensity of the processes of crystallite destruction, which affects the thermal diffusion, reducing it.
At T = 160 °C (HDPE crystalline phase is almost completely destroyed and is in the melt state, there are no changes in the PA6 crystalline phase, Figure 3, Table 4). The value of Δα decreases to the level observed at T = 120 °C, i.e., the temperature at which there was no appreciable destruction of crystallites, which confirms the assumption of a significant effect of crystallite destruction on thermal diffusion.
Interestingly, at a polyolefin concentration of 55% in the blend, a low gentle peak is observed on the curves α = f([HDPE]) at all T, the height of which increases with increasing temperature. Moreover, the value of α, which characterizes the top of this peak, has higher values than one would expect from the course of the curve α = f([HDPE]). Since the only principal difference of the blend PA6/HDPE–55% from other investigated blends with higher and lower content of polyolefin is the formation of the structure “interpenetrating network”, it is reasonable to assume that it provides higher thermal diffusion due to simultaneously existing continuous phases of two polymers on which phonon motion can be carried out with lower losses.
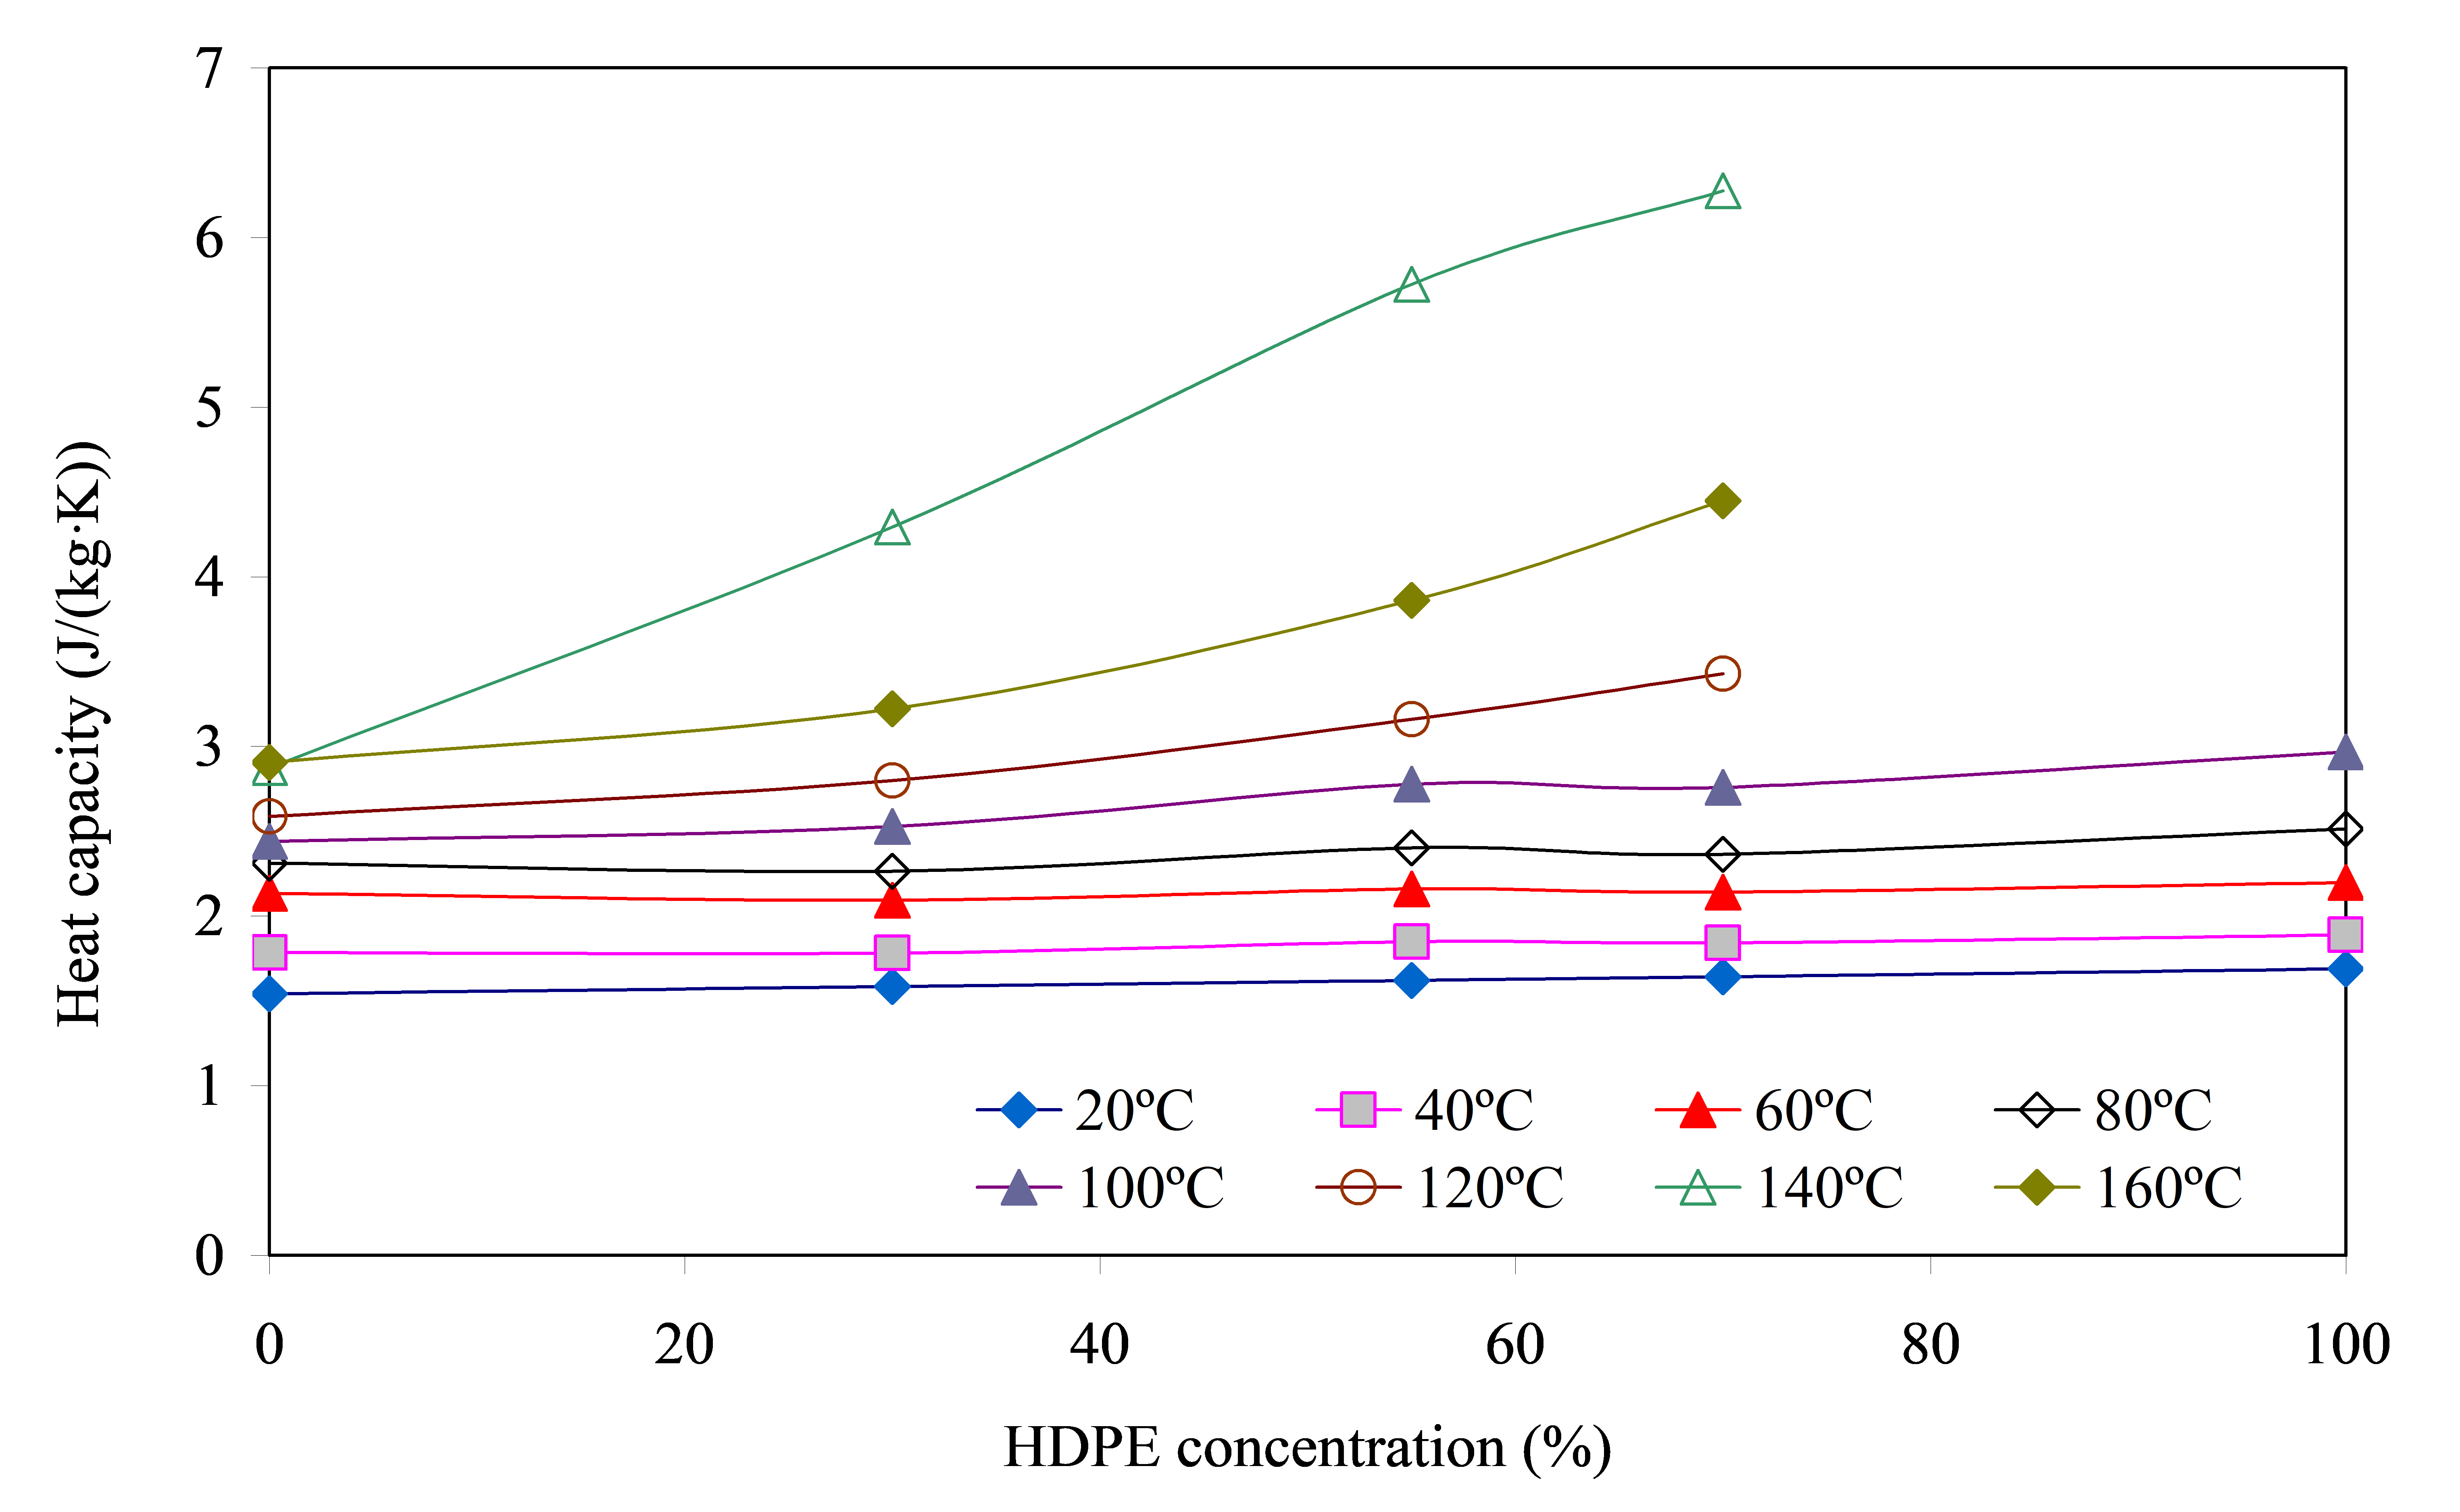
The second most important thermophysical characteristic that determines the level of thermal conductivity of the material is heat capacity. The results of the study of this parameter of blended compositions are presented in Figure 5.
Temperature ranges from 20 to 60 °C. The value of cp depends weakly and almost linearly on HDPE concentration and is determined, first of all, by the sample temperature: the higher it is, the larger is cp, Figure 5. The insignificant increase of cp with the increase of polyolefin fraction in the blend is explained by a slightly higher heat capacity of HDPE (≈0.18 J/(kg·K)) compared to PA6 (≈0.16 J/(kg·K)).
Temperature ranges from 80 to 100 °C. An increase in the slope of the curves cp = f([HDPE]) is observed, and the heat capacity increase (Δcp) becomes noticeably larger with increasing temperature. This can be attributed to the fact that the number of melted HDPE crystallites also grows with increasing temperature, which requires more energy input and leads to a greater increase in cp values. Although the fraction of the crystalline phase transferred into the melt is small, the contribution of this factor is clearly identified in the plots cp = f([HDPE]).
Temperature ranges from 120 to 140 °C. There is an intensive destruction of the crystalline phase of HDPE, accompanied by significant energy consumption, which is expressed in a sharp increase in cp, Figure 6. It should be noted that the more polyolefin component, the greater the increase in cp and the slope of the curve cp = f([HDPE]). Thus, the heat capacities of blends containing 30, 55 and 70% HDPE and at increasing temperature from 100 to 140 °C increase, respectively, by ≈1.7, 2.1 and 2.3 times.
At T 160 °C, the energy consumption for melting of the polyolefin crystalline phase decreases significantly due to its almost complete destruction earlier, which leads to a sharp drop (up to 1.5 times) in cp values. At the same time, however, the values of heat capacity for all ratios of components of the blend remain at a quite high level.
Interestingly, for the blend PA6/HDPE–55%, a low gentle peak is observed on the curves cp = f([HDPE]), as well as in the case of α = f([HDPE]), Figure 5, which is one more confirmation of the unusual behavior of polymer phases when they form interpenetrating networks. Understanding the reasons for this effect, taking into account that the level of interfacial interaction between components of the blend is very low, requires more thorough studies. It is possible the influence of the specific developing structure (interpenetrating network) on the value of cp.
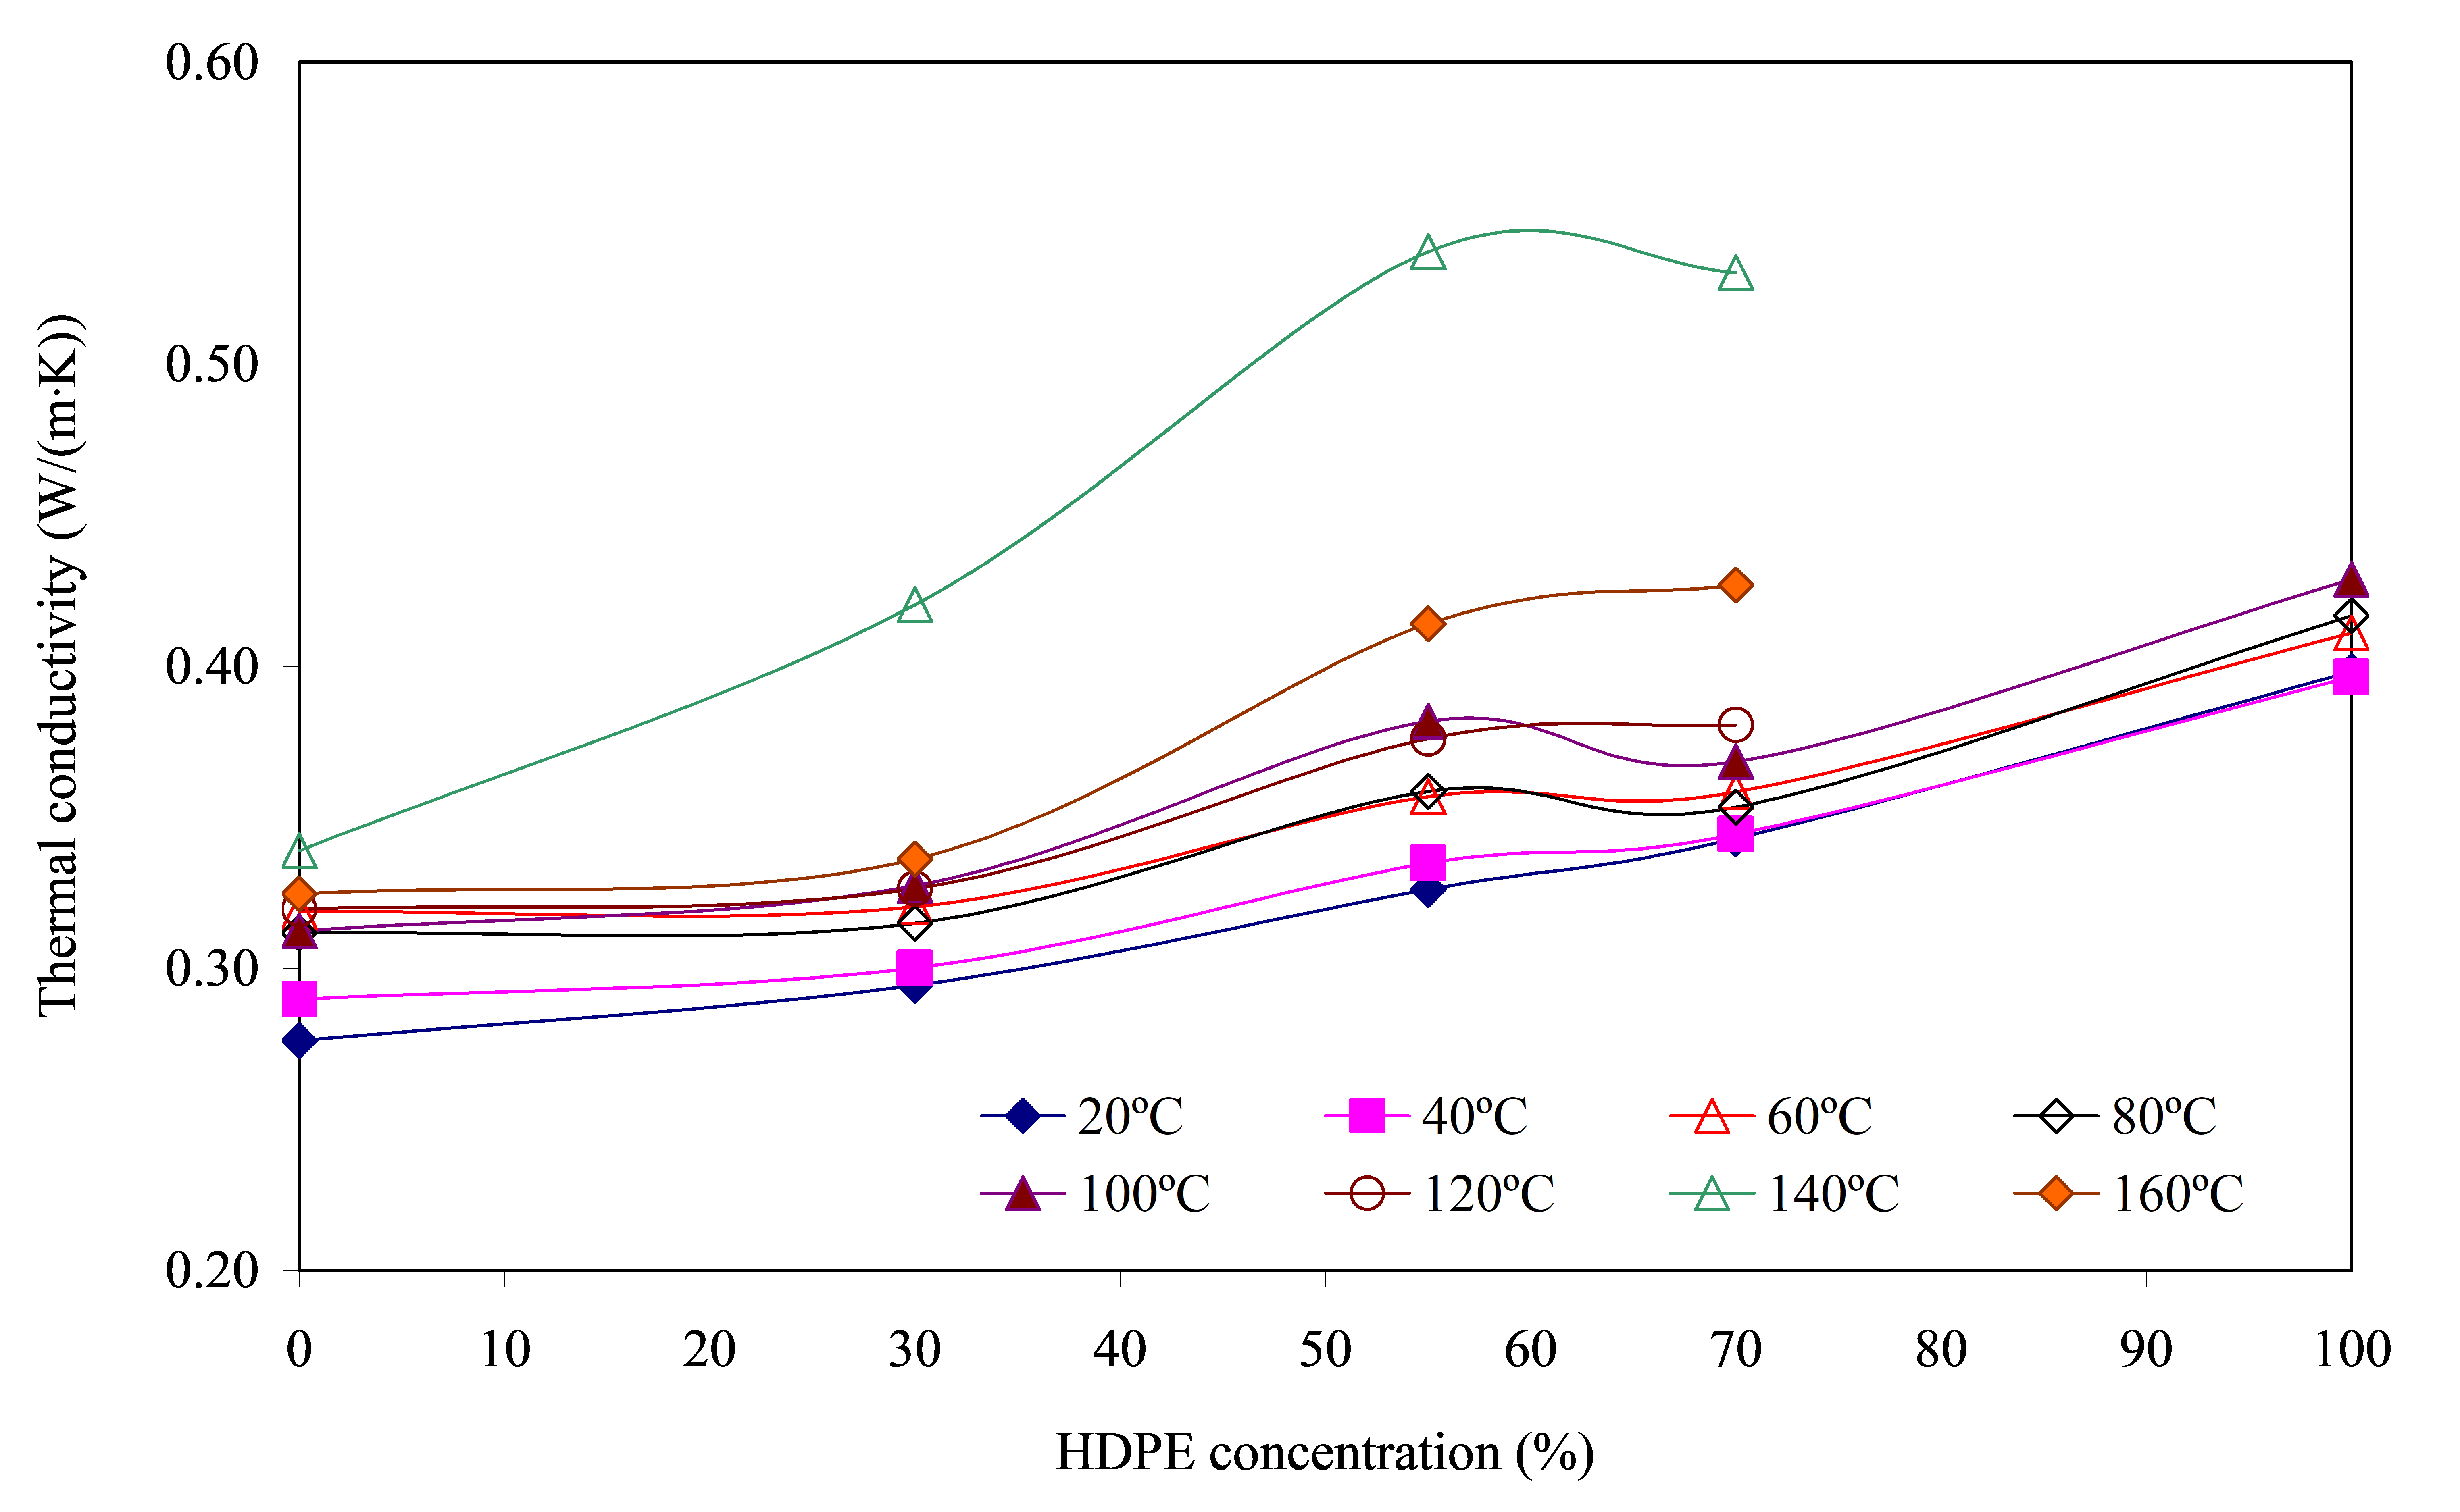
The results of the effect of the polyolefin concentration in the blend and its temperature on the thermal conductivity coefficient are shown in Figure 6.
From the obtained data it follows that with increasing temperature up to T = 120 °C λ also gradually increases. At further heating up to T = 140 ºС a sharp increase in the value of thermal conductivity coefficient is observed, and λ is the higher, the higher the polyolefin portion in the blend. The maximum increase of the specified parameter is observed for the blend PA6/HDPE–55% and reaches ≈1.4 times. Further increase of temperature up to 160 ºС leads to decrease of λ up to ≈1.3 times. At the same time, however, for all ratios of components of the blend, the level of this characteristic remains higher than at 120 °C and below.
Proceeding from the fact that the density of polymers before melting changes insignificantly upon heating, it can be considered that λ is directly proportional to α and cp, and the dependence λ = f([HDPE]) is actually their product at different temperatures, formula (3), which determines the shape of the curve and the level of λ values. This suggests that the observed effects are directly related to the causes affecting the values of α and cp, which were described earlier. At the same time, the obtained noticeable increase in the thermal conductivity coefficient at T = 140 °C is somewhat unexpected. The point is that at this temperature, the PA6 component of the blend does not undergo any significant changes (Figure 3) to have a noticeable effect on the value of λ. HDPE at this temperature is in the melt state and its crystalline phase is almost completely transformed to the amorphous state, i.e., the ordered structure, which has a higher phonon conducting ability than the amorphous one, is disrupted. This is confirmed by the sharp decrease in α, Figure 4. As follows from Equation (3), the final value of λ will be determined by the competition of two factors: the decrease in α and the increase in cp. When the polyolefin component transitions into the melt, the intensity of the increase in cp far exceeds the decrease in α. This determines the sharp increase in λ. It should be noted that the detected effect is potentially suitable for the development of adaptive thermally conductive materials that are capable of a dramatic increase in heat transfer capacity when reaching their design operating temperatures.
As a result of mechanical tests, it was found that the introduction of HDPE into PA6 leads to a sharp decrease in its mechanical properties: Et up to ≈20%, σy up to ≈33%, εB up to ≈14 times. One of the main reasons for this is the weak interfacial interaction between PA6 and HDPE. It was shown that practically the greatest deterioration of the whole complex of investigated indicators of mechanical characteristics is observed at formation of the “interpenetrating network” structure in the blend.
The SEM method revealed that the forming structure and the shape of inclusions of one polymer in another in the PA6/HDPE blend is determined by the ratio of its components and is related to the rheological properties of the polymers. The formation of the “interpenetrating network” type structure was confirmed at the HDPE content of 55% in PA6 and its multilevel structure was revealed: Continuous phases of PA6 and HDPE distributed in each other, each of the phases contains particles of the second one, and PA6 particles additionally contain smaller HDPE particles.
The DSC method showed that the shape of the melting and crystallization peaks of PA6 and HDPE in the blends and the position of their maxima are very close to those of the original components. It is revealed that the enthalpy of melting of polyolefin is weakly influenced by the ratio of components of the blend PA6/HDPE, at the same time, the influence of the proportion of HDPE on the crystallization of PA6 is ambiguous. Thus, at HDPE concentration of 30% ΔHm of PA6 decreases by ≈11%, but with further increase of HDPE content increases up to ≈23%. Presumably, this effect may be due to geometric factors (PA6 particle size), heat dissipation conditions in the blend, etc. This problem requires more detailed study.
It was found that the calculated and measured by immersion method densities of PA6/HDPE blends at all investigated ratios of components practically coincide. This, together with the DSC results, according to which there is an increase in crystallinity of PA6, allows us to assume that the chemical and physical interactions between the components of the blend PA6/HDPE are practically absent, and the interfacial layer itself is underdense. As a result, the interface between PA6 and HDPE should have high thermal resistance.
It was shown that increasing the temperature of the PA6/HDPE blend and the concentration of HDPE in it led to:
It has been found that a low gentle peak in the dependences α = f([HDPE]) and cp = f([HDPE]) is observed during the formation of the interpenetrating network structure in the PA6/HDPE blend. Moreover, the values of α and cp are noticeably higher than could be expected from the course of the indicated curves.
It was shown that the total value of the thermal conductivity coefficient is determined by the competition between two thermophysical characteristics of the blend: reduction of thermal diffusion and growth of heat capacity. A nonlinear growth of the thermal conductivity coefficient of blends (up to ≈1.3 times) at the transition of the crystalline phase of HDPE into the melt was found. This effect can be used in the creation of composites with adaptive thermal conductivity.
Conceptualization, S.P.B.; Methodology, S.P.B. and V.V.S.; Investigation, S.P.B. and V.V.S.; Writing—Original Draft Preparation, S.P.B. and V.V.S.; Writing—Review & Editing, S.P.B.
Not applicable.
The data used to support the results of this study are available from the corresponding author upon request.
The authors declare that they have no known competing financial interests or personal relationships that could have appeared to influence the work reported in this article.