Volatile organic compounds (VOCs) are widely recognized as hazardous air pollutants due to their high volatility, irritant properties, and toxic nature, posing substantial risks to human health and the environment [
1,
2,
3]. It is desirable to develop sustainable technologies for the remediation of VOCs pollution, such as condensation, membrane separation, adsorption, plasma treatment, and photocatalytic oxidation (POC) [
4,
5,
6]. Among these, photocatalytic technology is expected to be a cheap and feasible way to destroy a broad range of VOCs to carbon dioxide (CO
2) and water (H
2O), which utilizes oxide semiconductor materials (TiO
2, WO
3, ZnO) [
7,
8,
9,
10], to harvest solar light at ambient temperature. The photo-generated hole-electron pairs (h
+/e
−) in these materials can directly oxidize the pollutant molecules or produce reactive oxygen species radicals (•OH and •O
2−). These reactive radicals further participate in the surface-catalyzed reaction, which then causes the oxidation of organic pollutants to CO
2 and H
2O [
11,
12,
13,
14,
15]. Up to now, TiO
2 has been the most promising photocatalyst for the removal of VOCs due to the fact that TiO
2 exhibits relatively high photocatalytic activity, chemical stability, low cost, and environmental friendliness [
16,
17,
18].
Recently, altering the nanostructure and morphology has been proven to be a useful strategy in enhancing the performance of TiO
2 materials [
19,
20]. Since the first reports demonstrated the feasibility of synthesizing ordered TiO
2 nanotube arrays with unique electronic properties and large specific surface area, it has attracted significant attention and extensive study [
21,
22,
23]. Our previous work has also presented a TiO
2 nanotube arrays (TNA) photocatalyst possessing a high degree of crystallinity, many exposed reactive sites, as well as high charge carriers’ separation efficiency, leading to a highly efficient performance for the photocatalytic degradation of gaseous toluene [
22].
Unfortunately, TiO
2 only absorbs UV light (~4% of the solar spectrum) because of its large band gap energy (~3.2 eV). To overcome this limitation, one of the major strategies for inducing visible light response is element doping [
12,
15,
16,
17,
18,
19,
20,
21,
22]. It has been demonstrated that doping TiO
2 with rare earth elements can significantly improve the visible-light-driven photocatalytic performance of TiO
2. In addition to the visible light response caused by doping, introducing Gadolinium (Gd) has other advantages because Gd possesses a special 4f electronic structure that could act as an efficient electron trap center to facilitate the electron migration to the surface making available free carriers to take part in photocatalysis [
23,
24,
25,
26,
27]. However, metal doping may suffer from thermal instability, leading to decreased photocatalytic efficiency. In contrast to metal doping, non-metal doping, such as nitrogen or boron incorporation, not only modifies the electronic structure of TiO
2 by introducing impurity states within the bandgap or narrowing the bandgap but also exhibits superior thermal stability due to strong covalent bonding between dopants and the TiO
2 lattice [
28,
29,
30]. Notably, recent studies highlight synergistic effects can be achieved through co-doping strategies. For instance, co-doping TiO
2 with metal-nonmetal pairs (e.g., Sm-N or W-N) combines the advantages of both dopants: metal ions (e.g., Sm
3+) enhance charge separation via electron trapping, while non-metal dopants (e.g., N) extend visible light absorption and stabilize the lattice against thermal degradation [
31,
32,
33,
34,
35,
36,
37,
38,
39,
40,
41]. Such findings strongly encourage the adoption of metal-nonmetal co-doping strategies to optimize both stability and efficiency in advanced photocatalysts simultaneously.
Although TiO
2 nanotubes have many advantages mentioned above, there are few reports on co-doping based on TNA, because TNA is difficult to maintain the regular and crystalline structural characteristics of TiO
2 after multi-element doping. In this work, a structurally stable B, Gd doped TiO
2 nanotube arrays photocatalyst was prepared via a controllable electrochemistry method. The doping order and concentration were optimized to achieve a considerable photocatalytic performance for the degradation of gaseous toluene under visible light irradiation. Based on physicochemical characterization, the doping sites of B and Gd in TNA and the effects of the doping sequence were analyzed. The results indicate that the sequential doping of B followed by Gd is beneficial to the formation of stable structure and the rapid separation of photogenerated carriers, leading to optimal photocatalytic performance. Additionally, combined with
in-situ diffuse reflectance infrared Fourier transform spectroscopy (DRIFTS) results, the mechanism of adsorption and degradation of gaseous toluene over B, Gd doped TiO
2 nanotube arrays was proposed.
2.1. Chemicals and Materials
The chemicals used in the experiments, including titanium (Ti) mesh (99.9%), were purchased from Wako Pure Chemical Industries, Ltd., Osaka, Japan. NH
4F (99.9%) was purchased from Aladdin Ltd., Bolton, UK. Toluene (>99.0%), ethanol (>99.0%), ethylene glycol (>99.0%), and acetone (>99.5%) were purchased from Sinopharm Chemical Reagent Co., Ltd., Shanghai, China. Deionized water (resistivity of 18.2 MΩ cm) was purified using a Millipore filtration system.
2.2. Preparation of Samples
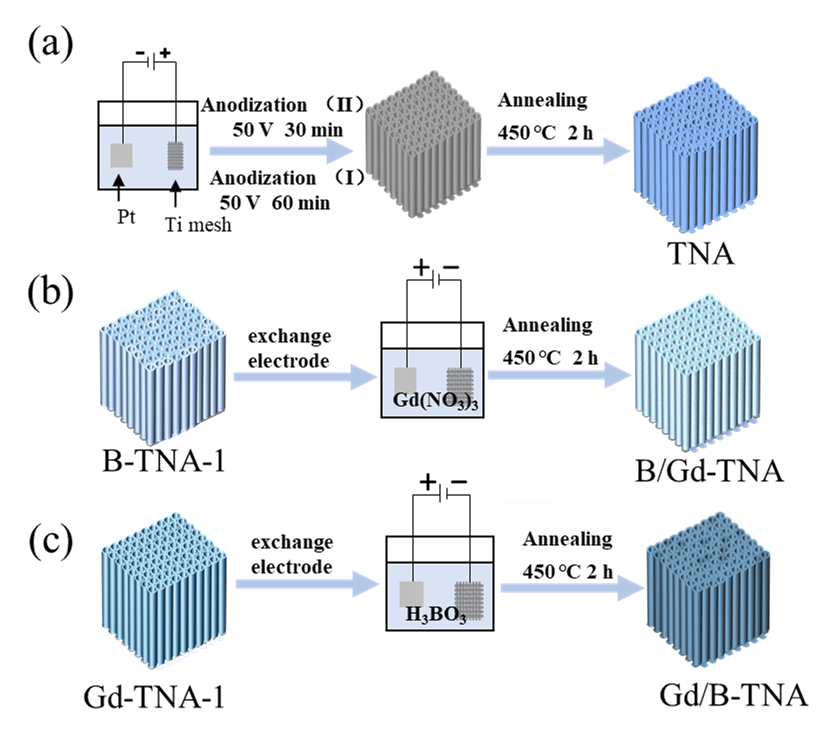
Two-step electrochemical anodization was used to fabricate TiO
2 nanotube arrays samples, as the scheme shown in
. Prior to anodization, the titanium mesh was cleaned sequentially with acetone, ethanol, and distilled water in the ultrasonic bath for 20 min, followed by drying in a desiccator. The anodization experiments were carried out in a conventional two-electrode system with Ti mesh as the anode and Pt foil as the cathode, respectively. Electrolyte solution consisted of 0.3 wt% NH
4F in an aqueous ethylene glycol solution with 2 vol% water. In the first-step anodization, the Ti mesh was anodized at 50 V for 1 h, the pretreated Ti would grow on the mesh surface, and then the grown nanotube layer was removed by sonicating in ethanol and deionized water. Whereafter, the second-step anodization was conducted at 50 V for 30 min. The as-obtained TiO
2 precursor was thoroughly rinsed with ethanol and deionized water, followed by annealing at 450 °C for 2 h in an oxygen atmosphere (heating step of 5 °C/min) in a tube furnace and allowed to naturally cool to room temperature for forming well-ordered TiO
2 nanotube arrays. This annealed TiO
2 nanotube arrays sample was denoted as TNA.
The preparation process of B doped TiO
2 (B-TiO
2), and Gd doped TiO
2 (Gd-TiO
2) is shown in
Figure S1. To obtain B, Gd co-doped TiO
2 nanotube arrays (B/Gd-TNA), the Pt electrode was used as anode. Meanwhile, B-TNA-1 was used as a cathode. The electrolyte was 100 mL aqueous solution of Gd (NO
3)
3 at the applied current density of 5.5 mA/cm
2 for 30 min. Finally, the as-obtained B/Gd-TNA precursor was ultrasonicated with ethanol and deionized water for 15 min. Then, the B/Gd-TNA was obtained by annealing at 450 °C for 2 h in a tube furnace. As for Gd, B co-doped TiO
2 nanotube arrays (Gd/B-TNA), Gd-TNA-1 was used as cathode, the Pt electrode was used as anode in the electrolyte was 100 mL aqueous solution of H
3BO
3 for 30 min, followed by annealing at 450 °C for 2 h to obtain Gd/B-TNA.
. Schematic of the sample preparation.
X-ray diffraction (XRD) patterns were recorded on a SmartLab 9 kW X-ray diffractometer with Cu Kα radiation (λ = 1.5418 Å). The scanning rate of 0.5° s
–1 and the scanning step width of 0.02° were applied in the 2θ range of 20-80°. X-ray photoelectron spectroscopy (XPS) was carried out on an X-ray photoelectron spectrometer (Thermo Fisher ESCALAB 250Xi, Waltham, MA, USA). The binding energy was calibrated by the C 1s peak (284.8 eV). Scanning electron microscopy (SEM) was performed on a Zeiss Supra 40 scanning electron microscope at an acceleration voltage of 5 kV. Transmission electron microscopy (TEM) and high-resolution TEM (HR-TEM). UV-Vis spectra of photocatalysts were recorded using a UV-Vis spectrophotometer equipped with a diffuse reflectance attachment (SolidSpec-3600, Shimadzu, Kyoto, Japan), with BaSO
4 serving as the reflectance standard. Electrochemical impedance spectra (EIS) and transient photocurrent mapping were conducted by employing a CHI660E instrument featuring a standard three-electrode system. O K-edge X-ray absorption near-edge structure (XANES) spectra were conducted at the Photoemission Endstations (beamline BL10B) of the National Synchrotron Radiation Laboratory (NSRL) in Hefei, China. Ti K-edge X-ray absorption fine structure (XAFS) spectra were collected at the National Synchrotron Radiation Research Centre (NSRRC) BL16A1 beamline.
2.4. Photocatalytic Activity Tests
The performance of the photocatalyst was evaluated in a kettle reactor. The whole evaluation system mainly consists of reactant gas, photocatalytic sealed reaction kettle, xenon lamp, and gas chromatography (GC5190E, Anhui Chromatographic Co., Ltd., Hefei, China). The reaction device is shown in
Figure S2. The photocatalyst of 2 × 1 cm size was put into the reactor, and the reactor was purged with air for 30 min after sealing, and the flow rate was controlled at 12 sccm. The initial concentration of 1.0 µL of toluene was injected into the reaction kettle with a micro sampler, and the toluene was completely vaporized by standing in an oven at 80 °C for 30 min. The Cell’s relative humidity level (RH) was fixed at 56% by a bypass with an electronic hygrometer. Take out the reaction kettle from the oven and cool it at room temperature for 30 min. Then the sample was kept in the dark for 30 min to reach the adsorption/desorption equilibrium on the photocatalyst surface. During the reaction, an Xe lamp equipped with a UV cut-off filter (λ > 380 nm) was used to irradiate the photocatalyst. At intervals, the concentration of toluene in the reactor was detected by a gas chromatograph equipped with a flame ionization detector (FID) and a chromatographic column. The sample was irradiated with a Xe lamp under visible light irradiation for 2 h, and analyzed by chromatography every 30 min. The toluene degradation rate was calculated by the formula:
where
C₀ is the initial concentration of toluene, and
Cₜ is the concentration of toluene at reaction time
t.
2.5. In-Situ DRIFTS Test
Figure S3 illustrates the experimental setup for DRIFTS conducted on a Thermo iS50 FTIR instrument equipped with a custom-made
in situ DRIFTS unit. The reaction system is mainly composed of diffuse reflectance infrared spectroscopy accessories and reaction cells (HVC) provided by Harrick Scientific Company, Pleasantville, NY, USA. This instrument features a semiconductor-cooled mercury−cadmium−telluride (MCT) detector that operates with OMNIC 9.2 software. The recycled condensate water is connected to the bottom of the
in-situ cell to ensure rapid cooling of the reaction tank and temperature regulation. IR spectra in the range of 650−4000 cm
−1 were generated from 64 scans at a resolution of 4 cm
−1. Before measurement, place the photocatalyst in a high-temperature and high-pressure reaction cell (equipped with a heater) with two ZnSe windows. Then purge with argon for 30 min to remove impurities adsorbed on photocatalyst surfaces. When purging was complete, in order to simulate the real situation in adsorption and photocatalytic reactions, synthetic air of 20% O
2 and 80% N
2 was introduced into the reaction gas path to carry toluene vapor out of liquid toluene. An equilibrium was established between the adsorption and desorption in the absence of light. The mixture was then switched to air and purged for 10 min to remove physically adsorbed toluene. Subsequently, the Xe lamp is equipped with a UV cut-off filter (λ > 380 nm), and the spectrum is recorded in real-time by OMNIC software on the computer.
3.1. X-ray Diffraction Analysis
XRD patterns of TiO
2 and doped TiO
2 nanotube arrays samples prepared at different conditions are shown in
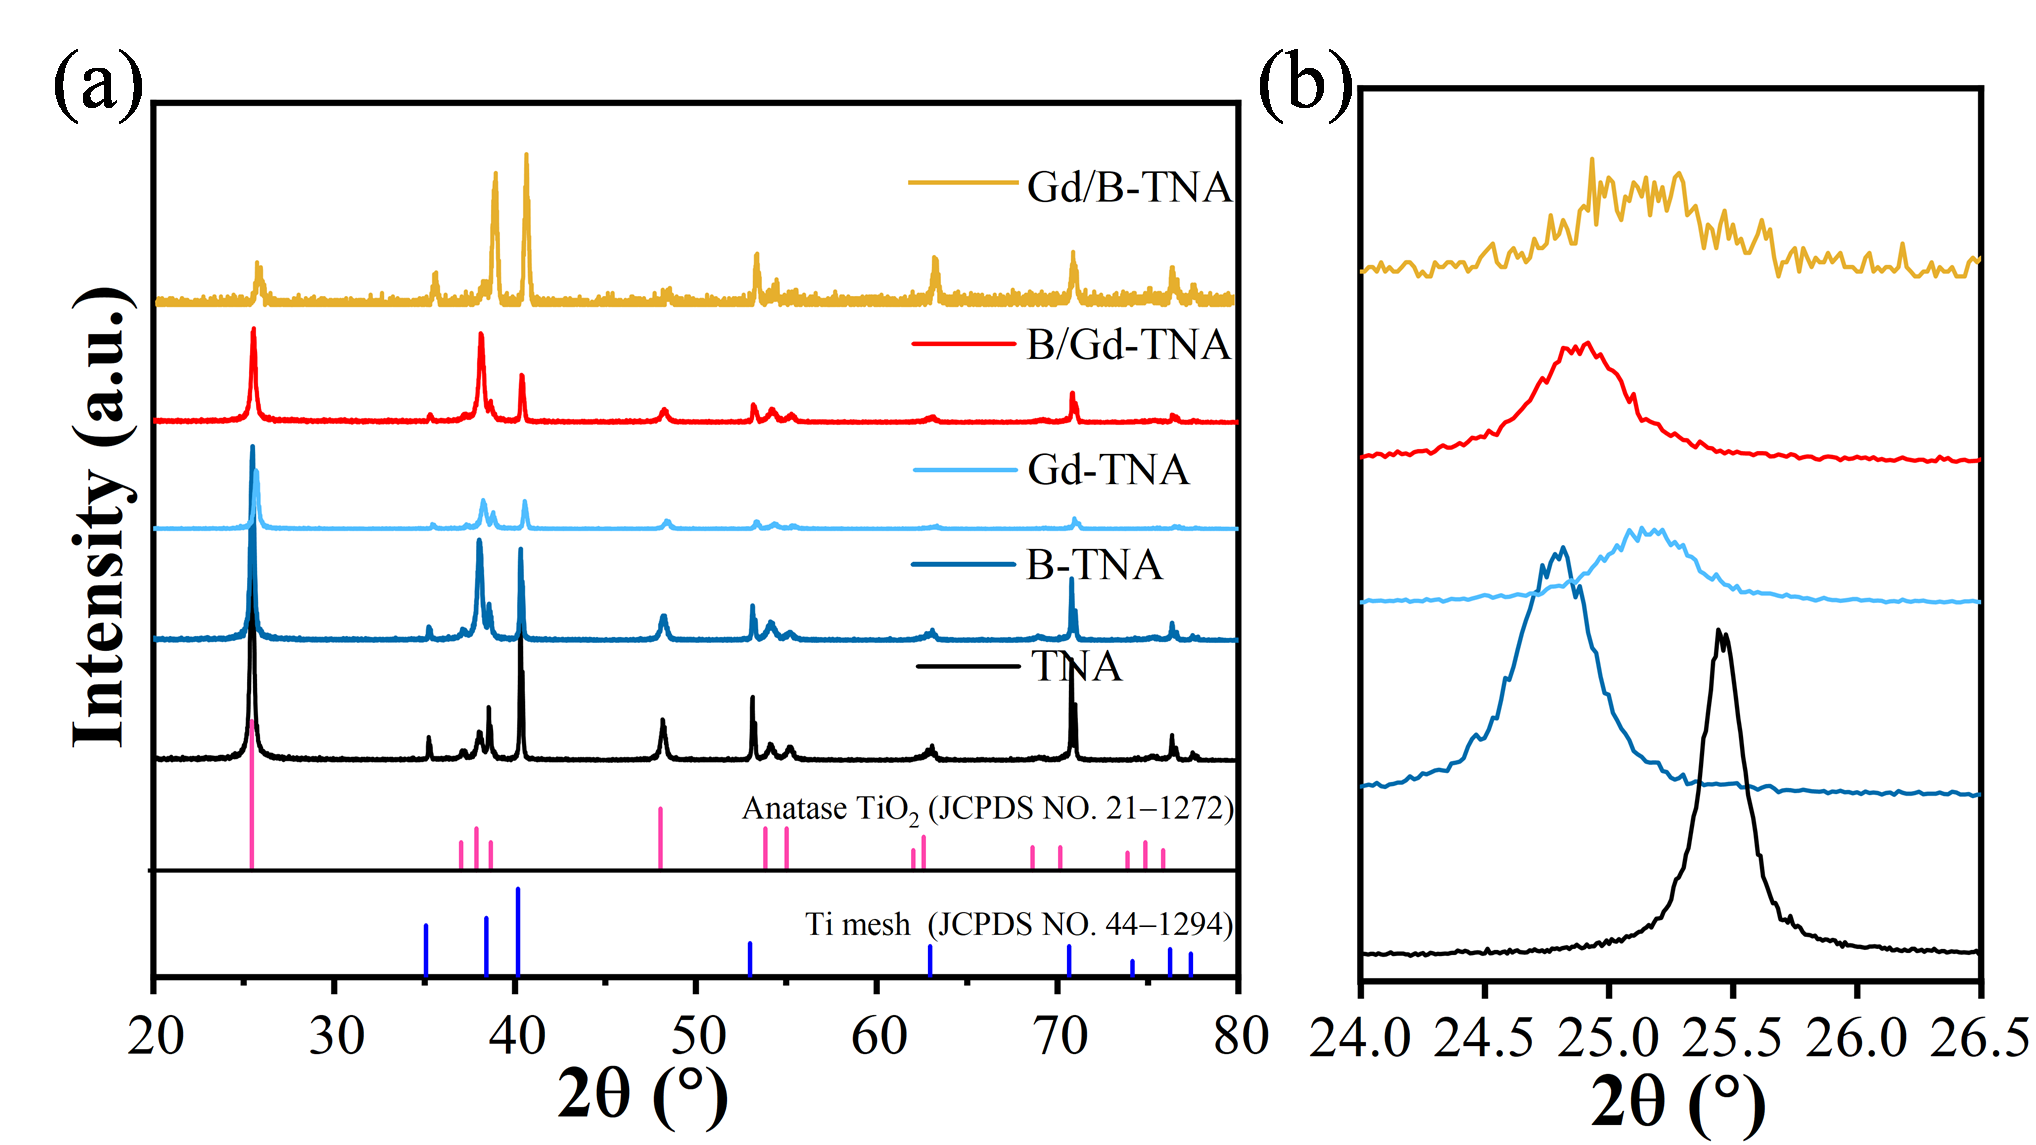
. As illustrated in
a, the diffraction peaks of TiO
2 and doped TiO
2 nanotubes at 38.43°, 40.35°, 53.10°, and 62.96° correspond to the (002), (101), (102), and (110) crystal planes of titanium (standard card PDF NO. 44−1294), respectively. The diffraction peaks at 25.49°, 37.95°, 48.21°, 54.09°, 55.16°, and 69.02° correspond to the (101), (004), (200), (105), (211), and (116) crystal planes of anatase TiO
2, respectively. All the fabricated doped TNA samples show similar diffraction peaks to TiO
2. That means the Ti substrate converted to the anatase TiO
2 phase after electrochemical anodization. There is no peak related to TiB
2, B
2O
3, or Gd
2O
3, which shows the purity of the sample. As shown in
b, the (101) peaks of doped TNA were broader and weaker than the undoped TNA sample. Moreover, the anatase peak of B-TNA’s (101) plane shifted to a lower angle side, indicating that structural rearrangement happened when B was doped into TNA. The results (
b) reveal that the TiO
2 (101) peak progressively shifts to a lower angle with the Gd doping. This blue shift can be attributed to the larger radius of Gd
3+ (0.94 Å) compared to Ti
4+ (0.68 Å), leading to an expansion of the lattice expansion of TiO
2. These findings indicated the successful doping of Gd into the TiO
2 lattice. Compared to B-TNA, after Gd was doped into the lattice of B-TNA, the intensity of (101) planes was further decreased, while the intensities of (004) and (220) planes were increased. This might be due to the fact that the (101) plane was sensitive to surface fabrication when doping Gd into B-TNA. Therefore, Gd was successfully doped into B-TNA.
. (<b>a</b>) XRD patterns and (<b>b</b>) Partial enlarged XRD patterns of TNA, B-TNA, Gd-TNA, B/Gd-TNA and Gd/B-TNA.
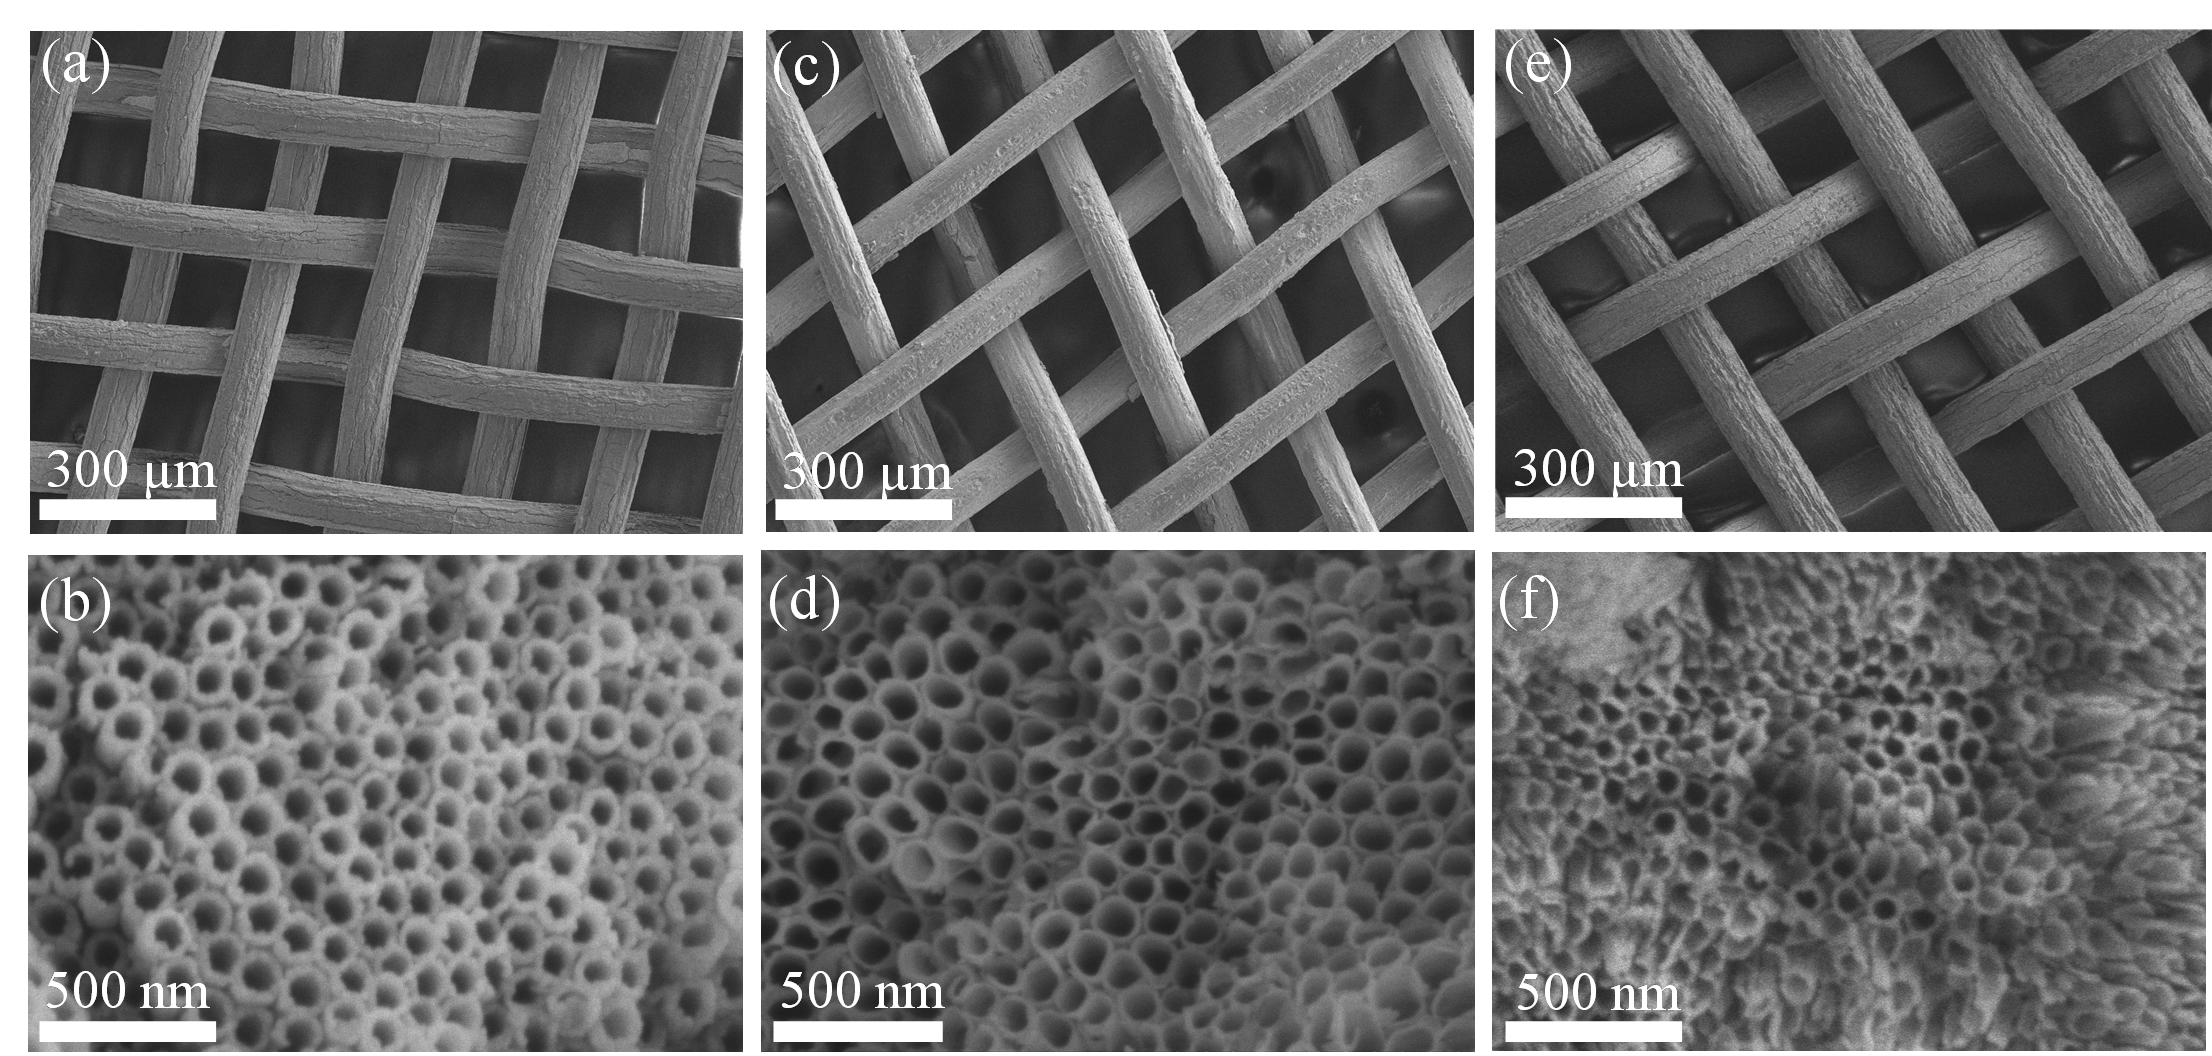
As shown in
, the morphological structure of the samples was investigated after anodization treatment in ethylene glycol electrolyte, uniform and compact TiO
2 nanotube arrays were successfully grown on the Ti mesh. The structure of the nanotube enhanced the specific surface area, and more reaction sites could be supplied to degrade the toluene. It is clear that uniform and well-aligned nanotubes were observed on the surface morphology of TNA, B/Gd-TNA, and Gd/B-TNA. Although B, Gd doping slightly affected the surface morphology of the nanotubes (
c,e), it did not damage the structure of the nanotubes. The top view images of the samples reveal that the surface morphology of undoped TNA changed and transformed through structural modification with Gd, B co-doped for TNA. As shown in
d–f the order of introduction of B and Gd also affects the morphology of TNA. The pore diameter of B/Gd-TNA nanotube arrays increases, and the wall becomes thinner. However, Gd/B-TNA decreases the pore diameter and the wall of the tube, causing agglomeration and damage. Gd/B-TNA causes lattice disorder of TiO
2 to a greater extent than B/Gd-TNA, which is also consistent with XRD results.
. SEM images of (<b>a</b>) TNA, (<b>c</b>) B/Gd-TNA, (<b>e</b>) Gd/B-TNA, and the magnified areas from the top view of (<b>b</b>) TNA, (<b>d</b>) B/Gd-TNA, (<b>f</b>) Gd/B-TNA.
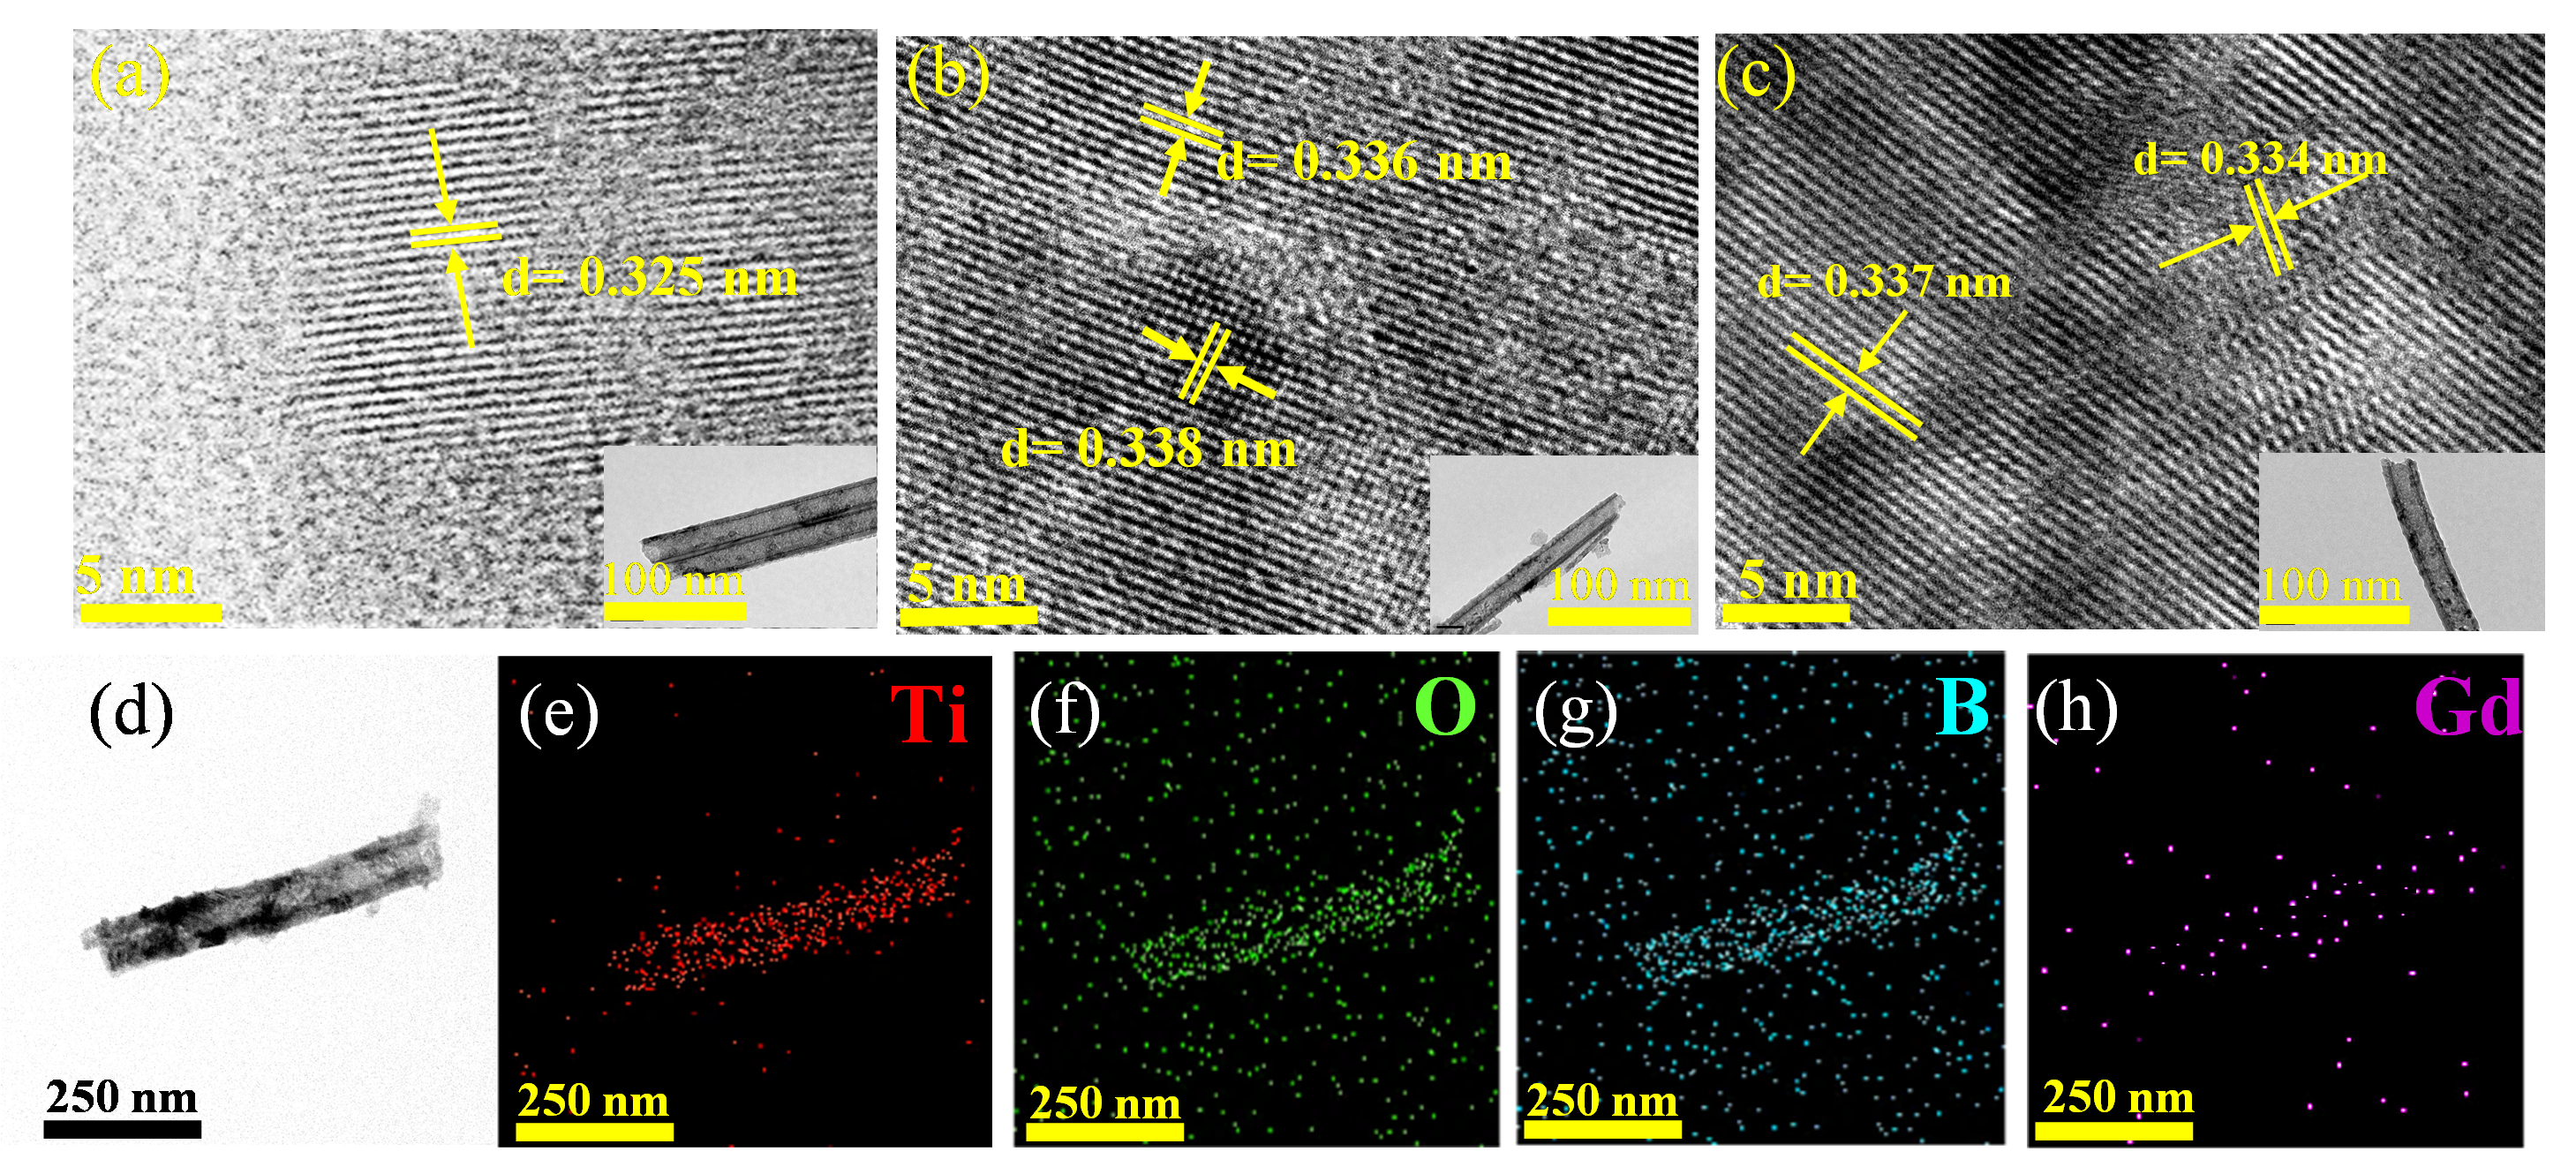
The microstructures of photocatalysts were examined by TEM.
a–c shows high-resolution TEM images of doped TNA, the lattice spacing of about 0.33 nm corresponds to the (101) crystal plane of anatase TiO
2. B/Gd-TNA and Gd/B-TNA, with the incorporation of B, Gd ions, showed increased fringe spacing compared to undoped TiO
2. This may be because the difference between the ionic radius and electronegativity of Gd
3+ (0.94 Å) and Ti
4+ (0.68 Å) will cause the charge redistribution in the lattice, thus forming different lattice stripes. The presence of B and Gd atoms in B/Gd-TNA was confirmed by EDX mapping analysis (
d–h). It can further indicate that B and Gd may enter the TiO
2 lattice by doping, which slightly increases the stripe spacing.
Figure 4. Crystal microstructure and components. TEM and HR-TEM images for (<b>a</b>) TNA, (<b>b</b>) B/Gd-TNA, and (<b>c</b>) Gd/B-TNA; (<b>d</b>) TEM image of the B/Gd-TNA, and the EDX mapping images of its (<b>e</b>) Ti, (<b>f</b>) O, (<b>g</b>) B, and (<b>h</b>) Gd atmos.
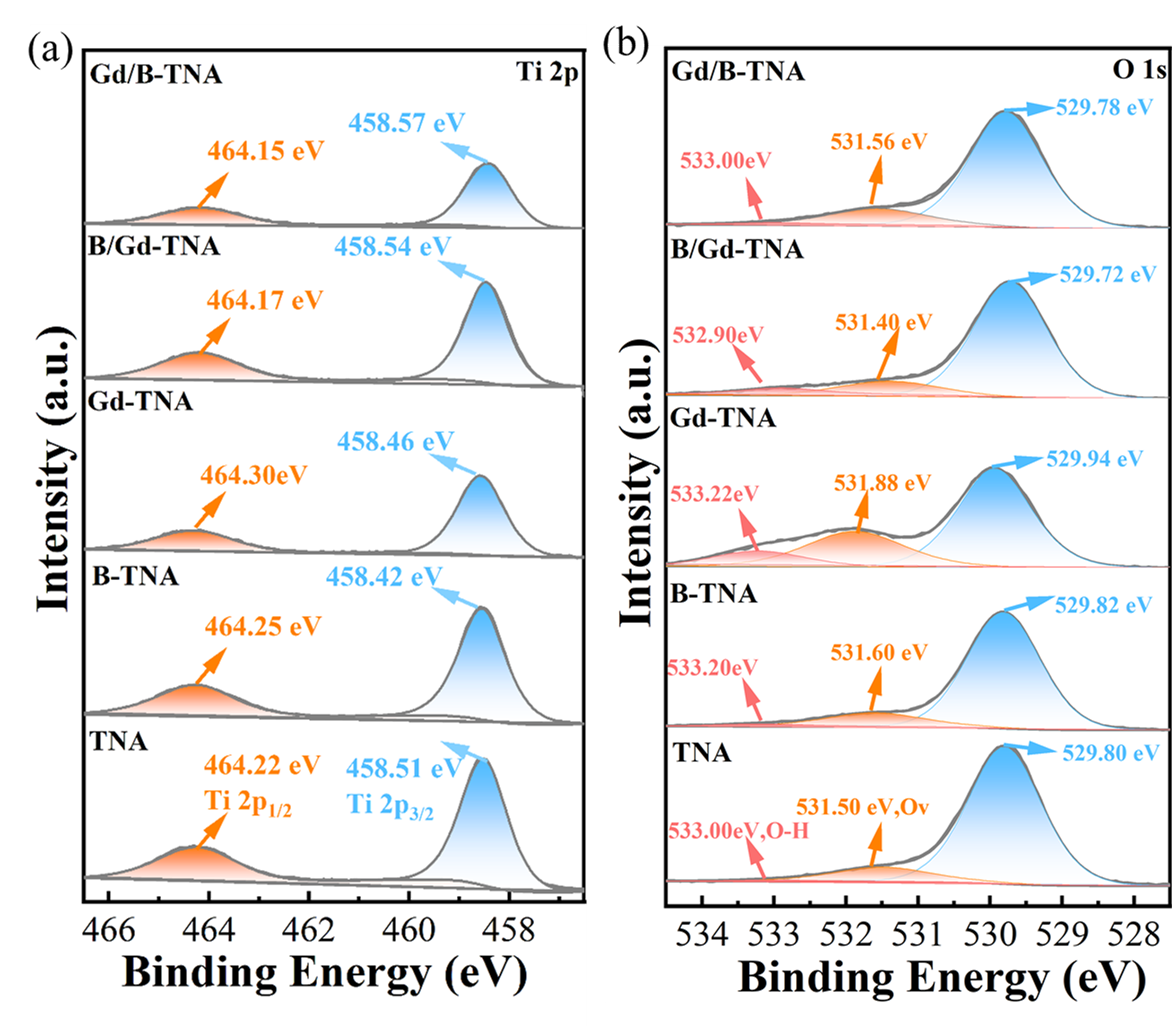
XPS method was used to determine the changes in valence states and chemical compositions of doped electrode surfaces.
shows Ti 2p and O 1s XPS spectra of TNA, B-TNA, Gd-TNA, B/Gd-TNA, and Gd/B-TNA.
Figure S5a shows the XPS survey scan spectra of the samples, revealing that there are Ti, O, B, and Gd elements in B/Gd-TNA, meaning that B, Gd is successfully doped into TiO
2 lattice during electrochemical anodization. As shown in
a, the Ti 2p XPS spectrum of TNA and doped TNA show two peaks at 458.5 eV and 464.2 eV, corresponding to Ti 2p
1/2 and Ti 2p
3/2. the peaks may be assigned to the O-Ti-O bonding in TiO
2. As shown in
b, A broad band of O 1s XPS spectra can be resolved into three peaks, corresponding to lattice oxygen (O
L, 529.80 eV), oxygen vacancy (Ov, 531.50 eV), which was the surface absorbed oxygen (533.00 eV) [
24,
25,
26,
27,
42]. As for the doped Gd-TNA, the formation of oxygen vacancies could be explained by the replacement of Ti
4+ by Gd
3+. However, previous studies show more oxygen vacancies will become recombination centers and reduce the photocatalytic performance of the catalyst. Therefore, we expect that the introduction of B can improve the defects caused by Gd doping. XPS of O1s spectra for B/Gd-TNA and Gd/B-TNA results show that the oxygen vacancies caused by Gd doping are suppressed by the incorporation of B and Gd. This is owing to the presence of B dopant, which could facilitate the incorporation of Gd
3+ into the TiO
2 lattice and reduce the concentration of Gd
3+ on the surface, thus suppressing the formation of oxygen vacancies. For Gd/B-TNA, introducing the Gd element first will not only inhibit the generation of oxygen vacancies but also greatly reduce the surface-OH groups/oxygen species, which is not conducive to improving the photocatalytic activity of TNA.
Figure S5b showed that the Gd 4d peak in Gd doped TNA samples could be fitted into three peaks. The peaks at 144.06 and 141.75 eV were deconvoluted from the Gd 4d
5/2 peak, which indicated that Gd
3+ in Gd doped TNA samples [
26,
27,
28,
29,
30,
31,
32,
33,
34].
. (<b>a</b>) Ti 2p (<b>b</b>) O 1s XPS spectra of TNA, B-TNA, Gd-TNA, B/Gd-TNA, and Gd/B-TNA.
To identify the surface oxygen vacancies and bulk oxygen vacancies in the TNA structure, the O K-edge X-ray absorption near-edge structure (XANES) spectra were adopted to investigate the electronic structures of all the samples [
43]. As shown in
Figure S6a, two energy regions can be distinguished. The two relatively sharp features in the region from 530 to 535 eV correspond to the electron transitions from the O 1s orbital to the
t2g (Ti 3d + O 2pπ) and
eg (Ti 3d + O 2pσ) orbitals [
44,
45,
46]. The higher energy broad features between 535 and 547 eV originate from the transitions to hybridized orbitals involving the antibonding orbitals Ti 4sp and O 2p. Notably, the t
2g peak intensity in B/Gd-TNA decreased compared to pristine TNA, directly evidencing surface oxygen vacancy formation through ligand field distortion. Studies have shown that surface oxygen vacancies function as active centers [
47,
48,
49,
50], enhancing toluene adsorption capacity through promoting •OH generation via water dissociation kinetics, leading to enhanced photocatalytic performance. Complementary Ti K-edge XANES (
Figure S6b) probed bulk coordination environments, where a slight blueshift in the Ti 4d absorption edge indicated limited bulk oxygen vacancy formation resulting from the introduction of doped atoms [
43]. Such controlled bulk defect engineering maintains structural integrity while avoiding detrimental carrier recombination.
3.4. Characterization
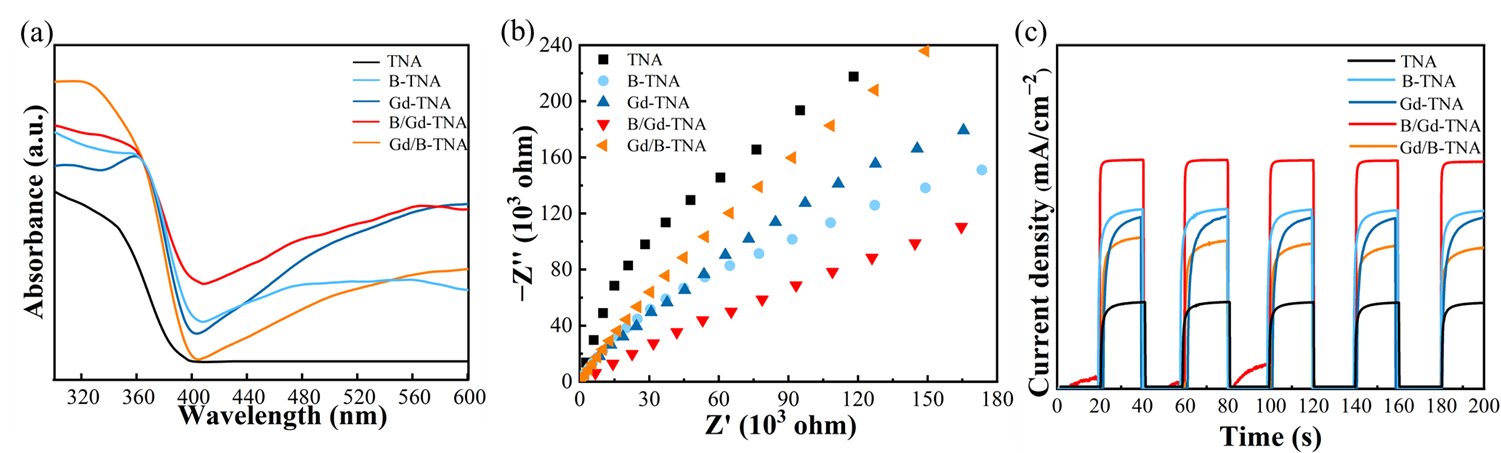
The absorption spectra were recorded in diffuse reflectance mode for the synthesized TNA and doped TNA. As displayed in
a, it can be noticed that in comparison with that of pure TNA, the doped TNA can shift the absorption edge toward the visible light. To deeply understand the separation ability of photogenerated electrons and holes in photocatalysts, the transient photocurrent and electrochemical impedance were carried out.
b,c are electrochemical impedance tests and transient photocurrent results, respectively. Generally, the arc with a smaller radius in the EIS Nyquist diagram represents a smaller charge transfer resistance with a higher carrier separation ability. In addition, the higher the photocurrent density is in the transient photocurrent diagram, the faster the separation speed of photogenerated carriers. As can be seen, B/Gd-TNA has the smallest radius (
b) and the highest photocurrent density (
c), which indicates that the photogenerated carrier separation ability is the strongest.
. (<b>a</b>) UV-vis diffuse reflectance spectrum, (<b>b</b>) EIS Nyquist plots of catalytic agent, (<b>c</b>) Transient photocurrent responses of TNA, B-TNA, Gd-TNA, B/Gd-TNA, and Gd/B-TNA.
The photocatalytic activities of as-synthesized TNA and doped TNA samples for the degradation of gaseous toluene were investigated.
Figure S8a shows the photocatalytic degradation of gaseous toluene on different B-TNA photocatalysts. The photocatalytic performance varied with the amount of B doping.
Table S1 shows the doping concentrations corresponding to the sample names. Among all B-TNA, B
3-TNA performed the highest photocatalytic activity with a degradation efficiency of 52.2% in 120 min.
Figure S8b shows the photocatalytic degradation of gaseous toluene on different Gd-TNA photocatalysts. The photocatalytic performance varied with the Gd doping amount. Among all Gd-TNA, Gd
3-TNA performed the highest photocatalytic activity with a degradation efficiency of 41.8% in 120 min. With the optimum Gd doping amount of Gd
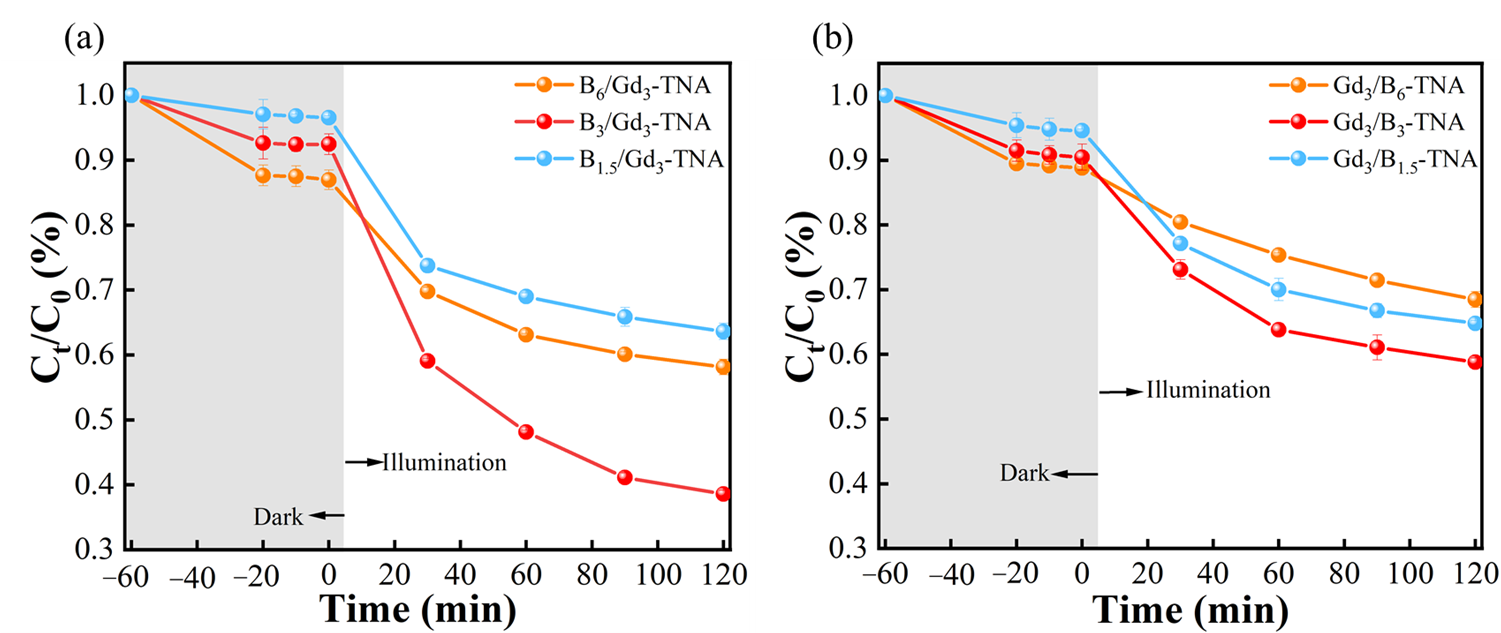
3-TNA, the B doping concentration and doping sequence of B and Gd were investigated for photocatalytic degradation of gaseous toluene under visible light (
). It can be found that the B
3/Gd
3-TNA exhibited the highest degradation efficiency of 62.0% in 120 min, even better than Gd
3/B
3-TNA (44.3%). This suggests that co-doping TiO
2 with B and Gd is an effective way to improve its photocatalytic activity. The highest photocatalytic activity of B
3/Gd
3-TNA on the degradation of toluene under visible-light irradiation could be ascribed to the synergistic effect of B and Gd co-doping can improved visible-light absorption, suppressed recombination of photogenerated carriers, introducing proper oxygen vacancies and increased surface areas. In addition, the order of B and Gd doping also affects the photocatalytic activity of TNA. First-principles calculations combined with experimental verification reveal that the doping sequence fundamentally governs defect configuration and photocatalytic activity. Initial boron doping induces preferential interstitial site occupation (
Figure S7), driven by B’s small atomic radius (0.87 Å) and non-valence matching with Ti
4+ sites, leading to more surface oxygen vacancies. As shown in
Table S2, the B interstitial doping followed by Gd doping achieves minimal formation energy, indicating thermodynamic stability. This sequential doping strategy creates a hierarchical defect architecture: interstitial B generates surface oxygen vacancies, while Gd substitution introduces controlled bulk defects. This spatially resolved defect distribution synergistically enhances toluene adsorption and degradation.
. Photocatalytic degradation activity of gaseous toluene (<b>a</b>) B/Gd-TNA, and (<b>b</b>) Gd/B-TNA.
The
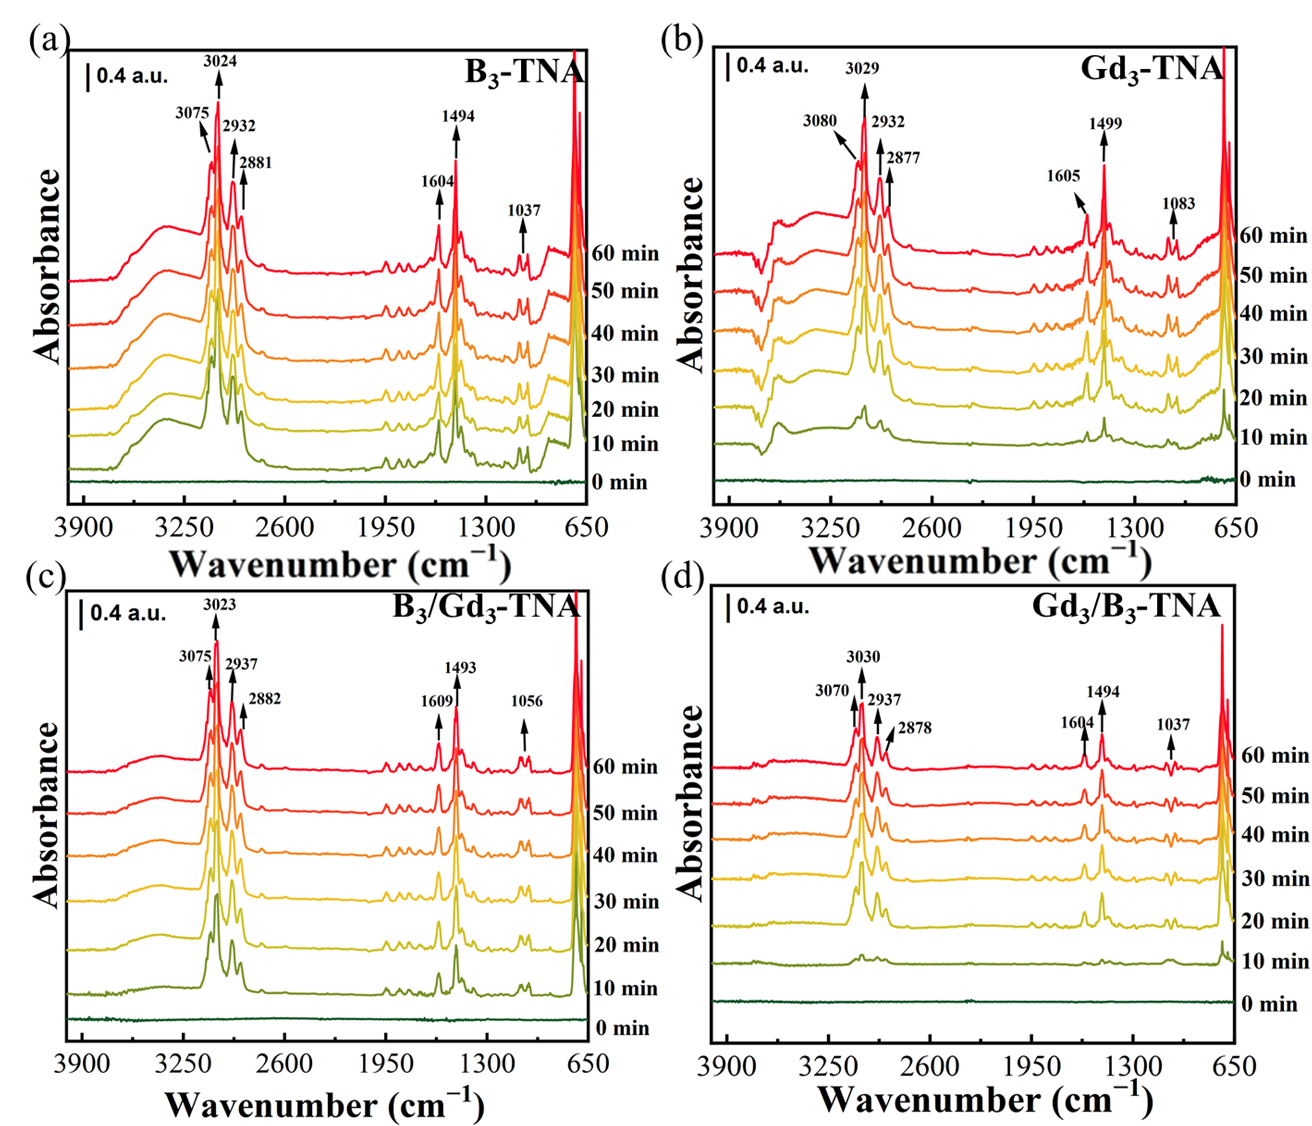
In-situ DRIFTS technique was used to monitor the adsorption, reaction intermediates, and products in real-time. The DRIFTS spectra of toluene degradation at the oxidation reaction stage over B
3-TNA, Gd
3-TNA, B
3/Gd
3-TNA, and Gd
3/B
3-TNA were presented in
and
, respectively. The DRIFTS spectra of other B and Gd concentrations in B/Gd-TNA and Gd/B-TNA were shown in
Figure S9 and
Figure S10. When samples were exposed to toluene gas, new peaks appeared at about 3075, 3024, 2932, 2881 1604, 1494, and 1037 cm
−1. The bands observed at 3075 and 3024 cm
−1 corresponded to the ν
C-H of the aromatic ring, and the bands observed at 2932 and 2881 cm
−1 responded to the C-H stretching vibration of the methyl group of toluene. The bands observed at 1494 cm
−1 corresponded to the in-plane skeletal vibrations of aromatic rings, and those observed at 1431 and 1408 cm
−1 corresponded to asymmetric and symmetric bending vibrations of the methyl group, respectively. A broad band observed at 3400–2600 cm
−1 corresponded to the stretching mode of adsorbed water Ti–OH
2 species. The bands at 1609, 1605, and 1604 cm
−1 corresponded to the typical molecular water bending mode [
51,
52,
53,
54,
55,
56]. The band intensities increased and reached a stable level after 30 min. B
3-TNA and Gd
3-TNA exhibited stronger absorption at 3400–2600 cm
−1 than B
3/Gd
3-TNA and Gd
3/B
3-TNA, indicating that B, Gd co-doping led to the desorption of a substantial amount of water weakly bounded on the TiO
2 surface. It could be seen that this broadband was recovered after B, Gd co-doped. This result indicated that the surface structure of TiO
2 after B and Gd co-doping is the beneficial recovery of hydroxyl groups by the exposure of the hydrogenated samples to air, including water vapor. It could be seen that the adsorption capacity of B
3/Gd
3-TNA for toluene was higher than that of Gd
3/B
3-TNA. This might be due to the collapse and damage of the TiO
2 nanotube structure caused by doping Gd first compared with doping B first, resulting in decreased adsorption sites.
. <i>In-situ</i> DRIFTS spectra for the adsorption of toluene on (<b>a</b>) B<sub>3</sub>-TNA (<b>b</b>) Gd<sub>3</sub>-TNA (<b>c</b>) B<sub>3</sub>/Gd<sub>3</sub>-TNA (<b>d</b>) Gd<sub>3</sub>/B<sub>3</sub>-TNA.
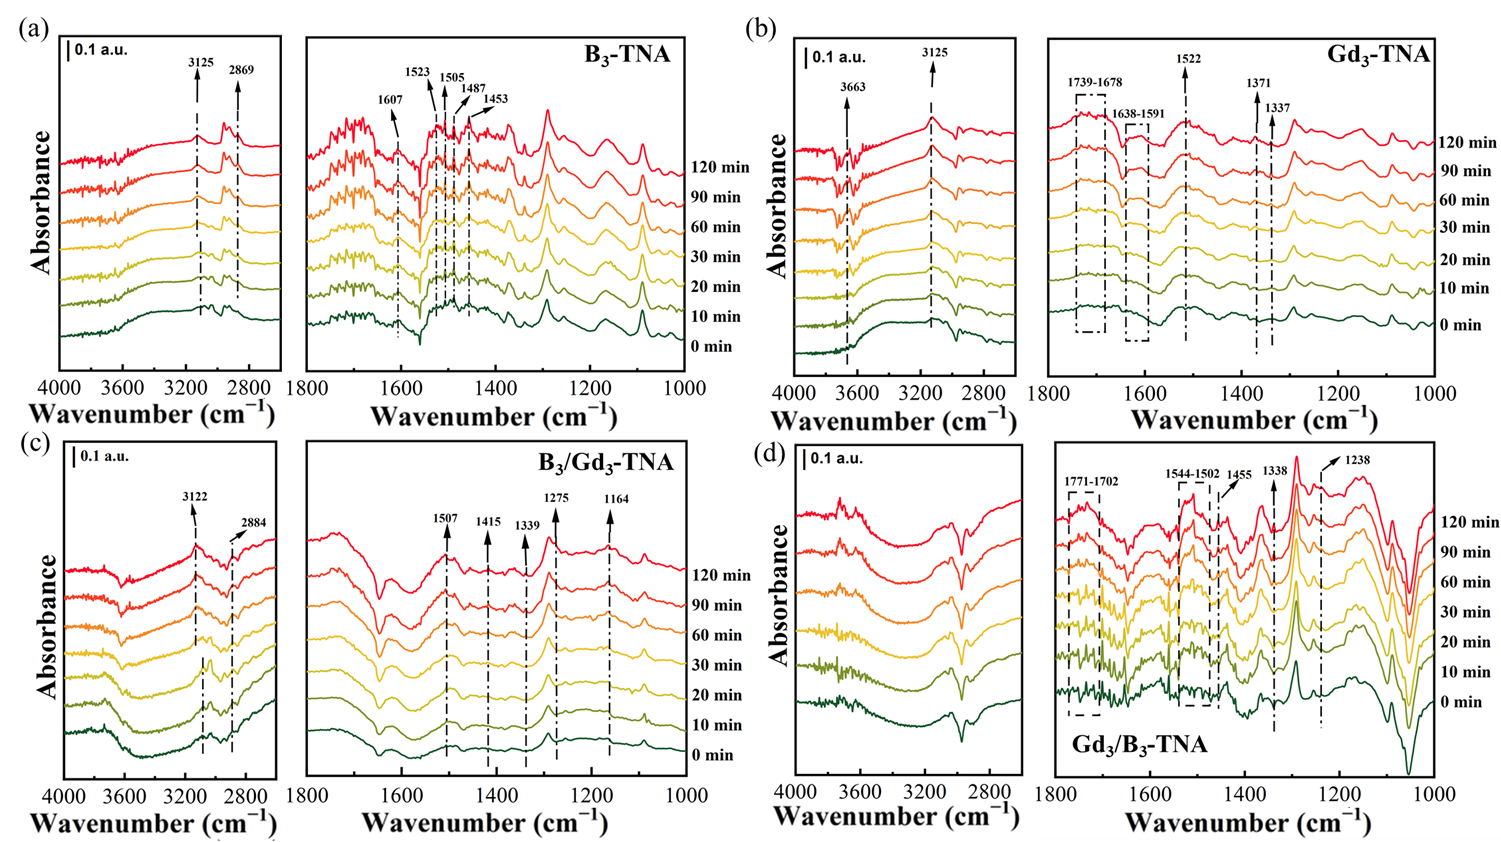
shows the
in-situ DRIFTS spectra of photocatalytic toluene oxidation reaction under visible light irradiation. With the increased irradiation time, the IR characteristic peaks of toluene decreased. Meanwhile, some new peaks were in the 1800−1100 cm
−1 range. The appearance of peaks at 2869 cm
−1 and 2884 cm
−1 during the catalytic oxidation of toluene over B
3-TNA and B
3/Gd
3-TNA catalysts can be attributed to the formation of benzaldehyde, as shown in
a,d. The peaks at 1505, 1502, and 1507cm
−1 were attributed to the out-of-plane and in-plane vibrations of the aromatic ring. The peaks at 1164 and 1049 cm
−1 were assigned to the alcohol salt species (C-O stretching vibrations). This implies that the C-H bond of the methyl (–CH
3) group in the adsorbed toluene was broken to produce benzyl alcohol. The peaks at 1523, 1563, 1453, 1415 and 1455 cm
−1 were attributed to the asymmetric and symmetric stretching vibration of the carboxylate group, respectively, indicating the formation of carboxylate species. The peaks at 1341,1339 and 1338 cm
−1 were the characteristic peaks of the benzoate species. For B
3/Gd
3-TNA and Gd
3/B
3-TNA, a new characteristic peak associated with maleic anhydride species appeared at 1252 cm
−1.Peaks at 1650−1759 cm
−1 are assigned to carbonyl vibrations (ν
C=O). Peaks at 1500−1600 cm
−1 belong to benzaldehyde adsorption. Peaks at 1487, 1456, and 1454cm
−1 belong to unpaired methyl bending vibration. Peaks at 1466−1403 cm
−1 are assigned to ν
OH in-plane bending vibrations of benzoic acid.1507−1489 cm
−1 skeleton vibration attributed to toluene. Peaks at 1544−1502 cm
−1 belong to benzoates [
57,
58,
59,
60,
61,
62]. All these results indicated that toluene adsorbed on B
3-TNA, Gd
3-TNA, and Gd
3/B
3-TNA was decomposed by the formation of benzoic acid and benzaldehyde as an intermediate product.
. <i>In-situ</i> DRIFTS spectra of (<b>a</b>) B<sub>3</sub>-TNA (<b>b</b>) Gd<sub>3</sub>-TNA (<b>c</b>) B<sub>3</sub>/Gd<sub>3</sub>-TNA (<b>d</b>) Gd<sub>3</sub>/B<sub>3</sub>-TNA photocatalysts with visible light irradiation.
The possible degradation mechanism of toluene over the doped TNA catalysts is proposed. According to the above analysis, the fast pre-activation of toluene first occurs on –CH
3 through the following reaction route: toluene → benzaldehyde → benzoic acid → benzene over B-TNA, Gd-TNA, Gd/B-TNA. As for B/Gd-TNA, the production of phenol intermediates can be further attacked by the •OH to form anhydride or carbon chain intermediates in the ring-opening process of toluene over B/Gd-TNA. This implies that the B/Gd-TNA interface can more efficiently catalyze the direct opening of the benzene ring. Toluene molecules adsorbed on the surface of the B
3/Gd
3-TNA catalyst can be oxidized in the following order: toluene → benzyl alcohol → acid anhydride → H
2O and CO
2. This indicates that TNA was modified by first B, and then Gd provided more oxygen vacancies on the catalyst surface due to the synergistic effect of B and Gd. The oxygen vacancies could be used as adsorption sites or further oxidized to produce active oxygen species to attack toluene. This leads to the B, Gd co-doped TNA having better degradation activity.
In-situ DRIFTS spectra results show that the doping order of B and Gd also affects the catalytic performance of the catalyst. The introduction of Gd atoms first results in the reduction of oxygen vacancies and the collapse of the nanotube structure, which leads to the lower photocatalytic degradation performance of Gd/B-TNA.
Conceptualization, J.D. and S.S.; Methodology, P.W.; Software, J.G. and F.C.; Validation, S.S.A.S. and T.D.; Formal Analysis, X.W. and J.B.; Investigation, Y.X. and L.G.; Resources, Y.W., M.C.; Writing—Original Draft Preparation, J.D.; Writing—Review & Editing, S.S.; Funding Acquisition, S.S.
Not applicable.
Not applicable.
The data that support the findings of this study are available from the corresponding author upon reasonable request.
This research was funded by the National Natural Science Foundation of China (21902001, 22179001 and 22308001), Distinguished Young Research Project of Anhui Higher Education Institution (2022AH020007), Higher Education Natural Science Foundation of Anhui Province (2023AH050114, KJ2021A0029 and KJ2021A0027), The University Synergy Innovation Program of Anhui Province (GXXT-2023-009), Anhui Province Engineering Research Center of Critical Electronic Materials, and the High-end Chemicals and Cutting-edge New Materials Technology Innovation Center of Hefei (HCHC202210).
The authors declare that they have no known competing financial interests or personal relationships that could have appeared to influence the work reported in this paper.