The investigation of the crystallography of apatite can be traced back to nearly a century ago [
1,
2]. At present, apatite can be classified into four types: fluorapatite (Ca
5(PO
4)
3F), hydroxyapatite (Ca
5(PO
4)
3OH), chlorapatite (Ca
5(PO
4)
3Cl), and oxyapatite (Ca
10(PO
4)
6O) [
3]. Typically, all apatite crystallizes in the space group
P6
3/
m except that the synthetic Ca
5(PO
4)
3Cl [
4] and Ca
5(PO
4)
3OH [
5] have been refined with lower symmetry space groups. To the best of our knowledge, the crystal structures of these apatite have been determined by utilizing powder X-ray diffraction methods.
Recently, a Cu-doped lead apatite sample denoted LK-99 was claimed to have room temperature ambient-pressure superconductivity [
6,
7]. Such a report has inspired extensive immediate experimental and theoretical works, as summarized in the latest developments [
8] and reports [
9]. Among the extensive following efforts, Hlinka quickly provides symmetry analysis and suggests a symmetry-breaking phase transition from
P6
3/
m (176) to a polar and chiral phase with
P6
3 (173) space group symmetry [
10]. As most DFT studies are based upon crystallographic data for Pb
10(PO
4)
6O published over 20 years ago, hereinafter denoted as Pb
10(PO
4)
6O—KB [
11], the crystal structure of Pb
10(PO
4)
6O has been re-investigated 20 years later, hereinafter denoted as Pb
10(PO
4)
6O—WE [
12]. Krivovichev reported that the crystal structure of Pb
10(PO
4)
6O—WE should be a superstructure with space group
P-3 (147) and doubled
c unit-cell. In addition, he also states that Pb
10(PO
4)
6O—KB was in fact quite likely an intermediate member of the Pb
10(PO
4)
6O–Pb
10(PO
4)
6(OH)
2 solid solution,
i.e., Pb
10(PO
4)
6O
x(OH)
2−x with x ~ 0.4 [
12]. Jiang et al. reported the synthesis of LK-99 and consider the synthesized phase to be consistent with doped Pb
10(PO
4)
6(OH)
2, and the Cu substitution is highly thermodynamically disfavored [
13]. In another experimental work, Puphal et al. have successfully grown large single crystals of LK-99 and solved the crystal structure with Cu substituting Pb 4
f and 6
h sites while two type oxygen atoms in 6
h sites are partially occupied [
14]. Kim et al. have established that the crystal structure of Cu-doped lead apatite can be stable at room temperature due to anharmonic phonon-phonon interactions [
15]. Additionally, the structure may undergo a phase transition to a lower-symmetry structure at low temperatures [
15,
16], leading to drastically different properties in crystal structure, electronic structure, and transport properties [
17,
18].
In summary, there is a substantial body of literature on apatite and its association with room-temperature superconductivity; however, the crystal structure of apatite and copper-doped apatite is still elusive. The present study provides a detailed examination of apatite samples obtained through various methods. Firstly, we examined the crystal structure of natural apatite using SXRD technology. Secondly, sintered copper powder with natural apatite at high temperature to investigate whether Cu doped into the apatite lattice. Finally, copper-doped lead apatite was synthesized via a three-step solid-state reaction, and its crystal structure was characterized using SXRD, SEM/EDX, and transmission electron microscopy (TEM).
2.1. Synthesis Method
Four types of natural apatite samples were purchased from Shi-kong-dui-wang minerals, SNQP-yu-he minerals Jingdong Co., China; Jing-hua-shang-mao minerals, Xun-cheng-kuang-wu minerals Taobao Co., China. Suitable single crystal particles are selected and installed on glass fiber for SXRD experiments to determine apatite crystal structure.
The high-purity element Cooper (Cu, Aladdin Industrial Corporation, Shanghai, China), with an indicated purity of 99.9%, and the natural apatite sample from Shi-kong-dui-wang minerals, were combined at a weight ratio of 1:1, weighing 2 g in total. The mixture was thoroughly ground in an agate mortar. The mixture sample was then placed in a quartz tube with a diameter of 6 mm and vacuum-sealed. The sealed glass tube was then subjected to heat treatment in a heat treatment furnace. Among them, the heat treatment condition was maintained at 1100 °C for 24 h. The heating rate is consistently set at 10 °C per minute. Afterward, the temperature of the furnaces equilibrates to room temperature.
For copper-doped lead apatite, the synthesis method is consistent with that reported by Lee et al. using the three-step solid-state method [
6,
7]. The high-purity elements Cu (99.5%), P (98.5%), PbO (99.999%), PbSO
4 (98.0%) are purchased from Aladdin Industrial Corporation (Shanghai, China). Firstly, to obtain Pb
2(SO
4)O, PbO and PbSO
4 powders were uniformly mixed in an agate mortar with a molar ratio of 1:1. The mixed powder was then placed in a quartz tube with a diameter of 6 mm and vacuum-sealed. The sealed glass tube was then subjected to heat treatment in a heat treatment furnace. Among them, the heat treatment condition is maintained at 725 °C for 24 h. Afterward, the temperature of the furnaces equilibrates to room temperature. Secondly, to synthesize Cu
3P, Cu and P powders were mixed in an agate mortar with a molar ratio of 3:1. The mixed powder was then placed in a quartz tube with a diameter of 6 mm and vacuum-sealed. The sealed glass tube was then subjected to heat treatment in a heat treatment furnace. Among them, the heat treatment condition is maintained at 550 °C for 48 h. The true phases of the intermediates Pb
2(SO
4)O and Cu
3P were determined by the Phi360 diffraction pattern collected by SXRD, which confirmed that the intermediates were indeed Pb
2(SO
4)O and Cu
3P. For the phase identification of the intermediates Pb
2(SO
4)O and Cu
3P, see the
Figure S1 and
Figure S2 in the supplementary material. Finally, Pb
2(SO
4)O and Cu
3P were uniformly mixed in a molar ratio of 1:1 in an agate mortar. The evenly mixed powder sample was divided into two parts, and they were vacuum sealed and then heat treated, respectively. The heat treatment condition of one part was held at 925 °C for 12 h, and the other part was held at 925 °C for 24 h.
2.2. Characterization
The Four types of natural apatite samples, Copper powder and apatite sintered at high temperature, copper-doped lead apatite were subsequently tested using SXRD. The diffraction was measured using a four-circle single-crystal X-ray diffractometer (Bruker D8 Ventures, Bruker AXS GmbH, Karlsruhe, Germany). The samples were also measured by powder XRD, powder XRD data was collected with Rigaku (SmartLab, Okinawa, Japan). In order to verify the accuracy of phase measurement by SXRD, SEM, and EDX tests were conducted by the electron microscope Hitachi S-3400N type equipped with EDX (EDAX Inc., Mahwah, NJ, USA) at a cathode voltage of 20 kV was used to characterize the morphology and chemical composition. TEM (Talos F200X) equipped with energy dispersive X-ray spectrometer (EDX) operated at 200 kV. For the TEM observation, the sample was prepared using the powder dispersion method. The powder sample dispersed in anhydrous alcohol was sonicated to prepare a suspension, and then part of the suspension was sucked by a rubber dropper and dropped on a molybdenum grid. After drying, a TEM test was performed. X-ray photoelectron spectroscopy (XPS) tests were conducted on Cu-doped lead apatite samples, for copper-doped lead apatite samples sintered for 12 h, the XPS equipment used was the Thermo Scientific ESCALAB 250Xi, for copper-doped lead apatite samples sintered for 24 h, the XPS equipment utilized was the Thermo Scientific K-Alpha.
All datasets from SXRD were processed by the APEX5 program [
19], including indexing, integration, scaling, absorption correction [
20], space group determination [
21], structure solving, and refinement [
22,
23]. Structural models were plotted with the Diamond program (Version 4.6.8) [
24]. Building clusters for the studied phases were analyzed by the ToposPro software package (Version 5.5.2.0) [
25].
3.1. Crystal Structure of Natural Apatite
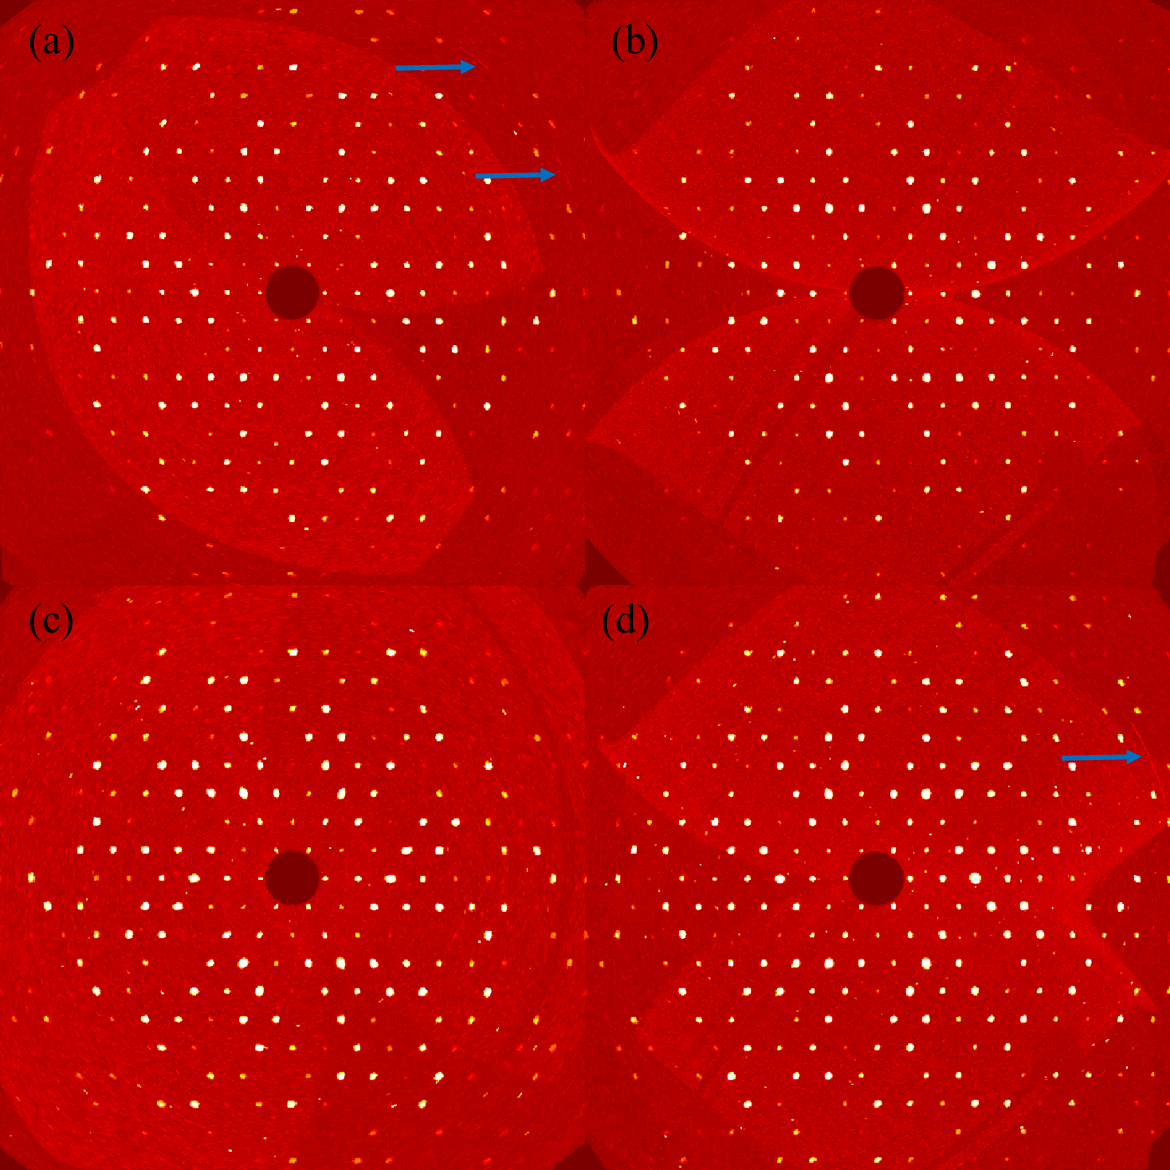
For convenience, we have designated the four different sources of apatite as A1, A2, A3, and A4. A1 represents apatite purchased from Shi-kong-dui-wang mineral, A2 represents apatite purchased from SNQP-yu-he mineral, A3 represents apatite purchased from Jing-hua-shang-mao mineral, while A4 represents apatite purchased from Xun-cheng-kuang-wu mineral. To further estimate the quality of single crystals of four types of natural apatite, the precession image of (
hk0) plane in the reciprocal space of the measured sample has been reconstructed, as shown in
.
a,b,c,d illustrate the precession images of the four types of apatite (
hk0) planes: A1, A2, A3, and A4, respectively. From
one can deduce that the measured single crystals have high quality and only tiny defects, as revealed by the feature of diffuse scattering (streaks) denoted by arrows.
. (<b>a</b>–<b>d</b>): The precession images of the four types apatite (<i>hk</i>0) planes: A1, A2, A3, and A4, respectively. The arrows indicate the streak of diffuse scattering.
The crystallographic information, data collection, and structure refinement details for the A1, A2, A3, and A4 phases are outlined in
. The crystallographic parameters of both phases conform to the standards set by international crystallography for the rationalization of crystal structures.
illustrates that among the four types of natural apatite, A1 is fluorapatite, while A2, A3, and A4 are classified as hydroxyapatite. The
Figure S3,
Figure S4,
Figure S5 and
Figure S6 and
Table S1,
Table S2,
Table S3 and
Table S4 in the supplementary material illustrate the SEM and EDX analyses of the A1, A2, A3, and A4 phases, confirming the accuracy of the structure refinement results. In addition, the crystallographic information files, check cif reports, and the crystallographic information sheets for the four phases A1, A2, A3, and A4 are also included in the supplementary material.
.
Crystallographic and experimental data of four natural apatite.
|
A1 |
A2 |
A3 |
A4 |
| Chemical formula |
Ca5(PO4)3F |
Ca5(PO4)3OH |
Ca5(PO4)3OH |
Ca5(PO4)3OH |
| a/Å |
9.3849(3) |
9.3654(4) |
9.3731(4) |
9.3801(3) |
| b/Å |
9.3849(3) |
9.3654(4) |
9.3731(4) |
9.3801(3) |
| c/Å |
6.8814(3) |
6.8786(3) |
6.8769(3) |
6.8748(3) |
| α, β, γ/° |
90, 90, 120 |
90, 90, 120 |
90, 90, 120 |
90, 90, 120 |
| V/Å3 |
524.89(4) |
522.50(5) |
523.23(5) |
523.85(4) |
| Z |
8 |
8 |
1 |
1 |
| Space group |
P63/m |
| Crystal system |
Hexagonal |
| Diffractometer |
Bruker D8 Venture Photon 100 COMS |
| Monochromator |
Graphite |
| Tmeas/K |
300(2) |
| Radiation |
Mo-Kα, λ = 0.71073 (Å) |
| Scan mode |
φ and ω scan |
| Absorption correction |
Multi-scan |
| F(000) |
500 |
500 |
500 |
500 |
| Time per step/s |
3 |
3 |
8 |
8 |
| θ range/° |
2.51~29.78 |
2.51~27.35 |
2.51~27.47 |
2.51~27.48 |
| μ/mm−1 |
3.095 |
3.102 |
3.097 |
3.094 |
| No. measured reflections |
20,794 |
13,717 |
26,729 |
18,610 |
| No. unique reflections |
586 |
432 |
438 |
438 |
| No. observed reflections (I > 2σ(I)) |
490 |
382 |
388 |
401 |
| No. reflections used in refinement |
586 |
432 |
438 |
438 |
| No. parameters used in refinement |
40 |
42 |
42 |
41 |
| Reflection range |
−13 ≤ h ≤ 13,
−13 ≤ k ≤ 13,
−9 ≤ l ≤ 9
|
−12 ≤ h ≤ 12,
−12 ≤ k ≤ 12,
−8 ≤ l ≤ 8
|
−12 ≤ h ≤ 12,
−12 ≤ k ≤ 12,
−8 ≤ l ≤ 8
|
−12 ≤ h ≤ 12,
−12 ≤ k ≤ 12,
−8 ≤ l ≤ 8
|
| Rint |
0.1187 |
0.0664 |
0.0868 |
0.0542 |
| R(σ) |
0.0288 |
0.0179 |
0.0149 |
0.0118 |
| Final R indices (Fobs > 4σ(Fobs)) |
R1 = 0.0265,
ωR2 = 0.0542
|
R1 = 0.0248,
ωR2 = 0.0569
|
R1 = 0.0220,
ωR2 = 0.0480
|
R1 = 0.0207,
ωR2 = 0.0490
|
| R indices (all data) |
R1 = 0.0399,
ωR2 = 0.0571
|
R1 = 0.0328,
ωR2 = 0.0592
|
R1 = 0.0283,
ωR2 = 0.0492
|
R1 = 0.0240,
ωR2 = 0.0510
|
| Goodness of fit |
1.049 |
1.157 |
1.125 |
1.137 |
| The maximum residual electron densities |
0.81
(0.61 Å from Ca2)
|
0.84
(0.17 Å from H1)
|
0.88
(0.12 Å from H1)
|
0.53
(0.17 Å from H1)
|
| The minimum residual electron densities |
−0.57
(0.43 Å from F1)
|
−0.56
(0.59 Å from P1)
|
−0.50
(0.54 Å from P1)
|
−0.48
(0.50 Å from P1)
|
Because the primary distinction between fluorapatite and hydroxyapatite lies in the position and occupancy of fluorine atoms and hydroxyl groups within the crystal structure,
illustrates the atomic coordinates and occupancy information at 4
e or 2
a in four natural apatite species. It is evident that fluorine atoms in fluorapatite occupy the 2
a position, with an occupancy rate of 1. In the three types of hydroxyapatite, the O4 and H1 atoms occupy the 4
e position, each with an occupancy rate of 0.5. For specific atomic coordinates and atom occupancy information for the four phases A1, A2, A3, and A4, please refer to
Table S5,
Table S6,
Table S7 and
Table S8 in the Supplementary Materials.
.
Atomic coordinates and occupancy information at 4e or 2a in four natural apatite species.
|
Atom |
Site |
x |
y |
z |
Occ. |
| A1 |
F1 |
2a |
0 |
0 |
0.2500 |
1 |
| A2 |
O4 |
4e |
0 |
0 |
0.2709(15) |
0.5 |
| H1 |
4e |
0 |
0 |
0.154(3) |
0.5 |
| A3 |
O4 |
4e |
0 |
0 |
0.2700(14) |
0.5 |
| H1 |
4e |
0 |
0 |
0.155(3) |
0.5 |
| A4 |
O4 |
4e |
0 |
0 |
0.272(4) |
0.5 |
| H1 |
4e |
0 |
0 |
0.153(5) |
0.5 |
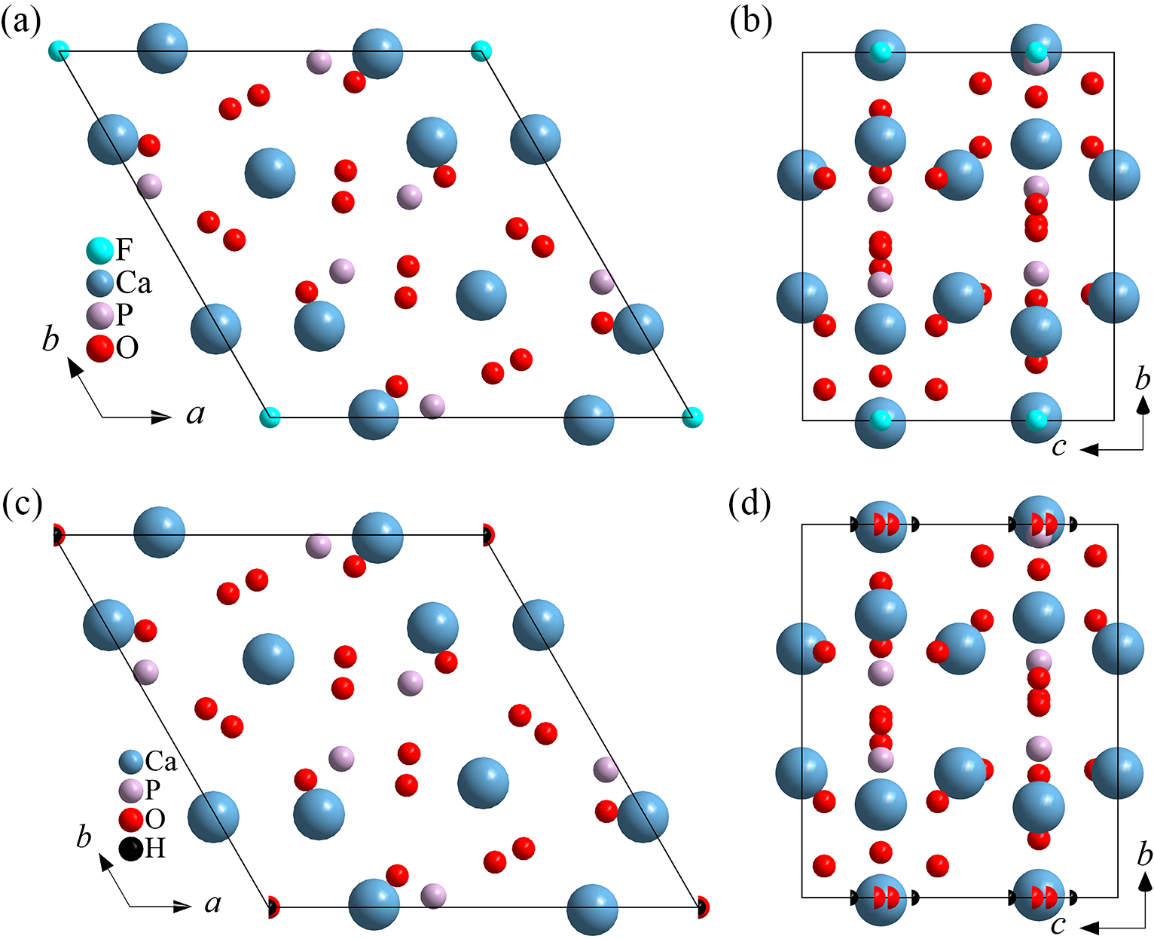
illustrates crystal structures of fluorapatite (A1) and hydroxyapatite (A2, A3, and A4) projected in different directions.
illustrates that fluorapatite and hydroxyapatite possess highly similar crystal structures. The primary distinction between the two is that the fluorine atoms and hydroxyl groups differ in their occupation and occupancy.
. Crystal structures of fluorapatite (A1) and hydroxyapatite (A2, A3, and A4) projected in different directions: (<b>a</b>) c axis of fluorapatite; (<b>b</b>) a axis of fluorapatite; (<b>c</b>) c axis of hydroxyapatite; (<b>d</b>) a axis of hydroxyapatite.
Influenced by the recent surge in interest surrounding “room temperature superconductivity”, many research groups have pursued further investigations. While numerous researchers have concentrated on the synthesis and characterization of copper-doped lead apatite, there is comparatively limited research on copper-doped calcium apatite. As far as we know, Veselinovic et al. [
26] reported the crystal structure of cobalt-doped calcium apatite in 2010 and found that the cobalt and calcium atoms occupy the same position. Therefore, this chapter will present the results of high-temperature sintering of copper powder and A1 (fluorapatite).
Firstly, the powder XRD pattern of the original fluorapatite samples, copper powder and fluorapatite sintered at 1100 °C for 24 h were analyzed, with the results presented in
. The gray line in
a represents the XRD pattern of the fluorapatite sample, while the black line corresponds to the PDF card #98-000-0215 for fluorapatite. The diffraction peaks of the PDF #98-000-0215 align closely with those of the fluorapatite sample, indicating that the original fluorapatite sample is of high purity.
b displays the powder XRD pattern of the copper powder and the fluorapatite sintered at 1100 °C for 24 h. After phase calibration, it was determined that the sintered sample contains three phases: Ca
5(PO
4)
3F, Cu
2O, and CuO. It is preliminarily concluded that copper has not doped into the crystal lattice of Ca
5(PO
4)
3F.
Secondly, the SXRD measurement of the products of copper powder and fluorapatite that were sintered at 1100 °C for 24 h were analyzed, and presented the crystallographic information of both primitive fluorapatite, fluorapatite and copper powder after sintering in
. From
, it is evident that the single crystal sample sintered at high temperature remains fluorapatite. Additionally, we attempted to add copper atoms at various potential positions during the crystal structure refinement process but were unsuccessful. Furthermore, as shown in
, the cell parameters of the sample sintered after high temperature are smaller compared to the original fluorapatite. Considering these findings comprehensively, we conclude that copper atoms do not doped into the crystal lattice of fluorapatite following the high-temperature sintering. This observation underscores the thermodynamic stability of fluorapatite, which aligns with the research conducted by Surendran et al. [
27]
. They discovered that fluorapatite does not melt until it reaches approximately 1174 °C, as indicated by differential scanning calorimetry (DSC) tests, thereby demonstrating the high-temperature thermal stability of fluorapatite. The Co source in Veselinovic et al.’s synthesis of Co-doped apatite is Co(NO
3)
2, which is Co
2+. In contrast, the Cu source in this section is Cu powder. It is speculated that the use of Cu powder, rather than Cu
2+ in this pilot experiment contributed to the failure of Cu doping.
. Powder XRD partern: (<b>a</b>) fluorapatite, (<b>b</b>) High-temperature sintering products of copper powder and fluorapatite.
.
Crystallographic and experimental data of Primitive fluorapatite, fluorapatite and copper powder after sintering.
|
Primitive Fluorapatite |
High-Temperature Sintering of Fluorapatite and Copper Powder |
| Chemical formula |
Ca5(PO4)3F |
Ca5(PO4)3F |
| a, c/Å |
9.3849(3), 6.8814(3) |
9.3667(4), 6.8795(5) |
| α, β, γ/° |
90, 90, 120 |
90, 90, 120 |
| V/Å3 |
524.89(4) |
522.71(6) |
| Z |
8 |
4 |
| Space group |
P63/m |
| Crystal system |
Hexagonal |
| Diffractometer |
Bruker D8 Venture Photon 100 COMS |
| Monochromator |
Graphite |
| Tmeas/K |
300(2) |
| Radiation |
Mo-Kα, λ = 0.71073 (Å) |
| Scan mode |
φ and ω scan |
| Absorption correction |
Multi-scan |
| F(000) |
500 |
500 |
| Time per step/s |
3 |
7 |
| θ range/° |
2.51~29.78 |
2.51~27.53 |
| μ/mm−1 |
3.095 |
3.107 |
| No. measured reflections |
20,794 |
16,633 |
| No. unique reflections |
586 |
438 |
| No. observed reflections (I > 2σ(I)) |
490 |
379 |
| No. reflections used in refinement |
586 |
438 |
| No. parameters used in refinement |
40 |
39 |
| Reflection range |
−13 ≤ h ≤ 13,
−13 ≤ k ≤ 13,
−9 ≤ l ≤ 9
|
−12 ≤ h ≤ 12,
−12 ≤ k ≤ 11,
−8 ≤ l ≤ 8
|
| Rint |
0.1187 |
0.0903 |
| R(σ) |
0.0288 |
0.0220 |
| Final R indices (Fobs > 4σ(Fobs)) |
R1 = 0.0265,
ωR2 = 0.0542
|
R1 = 0.0292,
ωR2 = 0.0561
|
| R indices (all data) |
R1 = 0.0399,
ωR2 = 0.0571
|
R1 = 0.0384,
ωR2 = 0.0586
|
| Goodness of fit |
1.049 |
1.077 |
| The maximum residual electron densities |
0.81
(0.61 Å from Ca2)
|
0.36
(0.92 Å from Ca1)
|
| The minimum residual electron densities |
−0.57
(0.43 Å from F1)
|
−0.46
(0.50 Å from P1)
|
3.3. Synthesis and Characterization of Copper-Doped Lead Apatite
Although copper-doped lead apatite has attracted great attention from researchers, its crystal structure has not been studied in detail. According to literature research, it is found that in 2023, Puphal et al. [
14] synthesized the single crystal of Pb
9Cu(PO
4)
6O by using the traveling solvent floating zone (TSFZ) growth method and determined its crystal structure by using single-crystal X-ray diffraction (SXRD). As we all know, single-crystal X-ray diffraction (SXRD) has become a powerful technique for accurately determining crystal structures. In this chapter, the crystal structure of copper-doped lead apatite single crystals synthesized using a three-step solid-state reaction method determined by SXRD will be introduced.
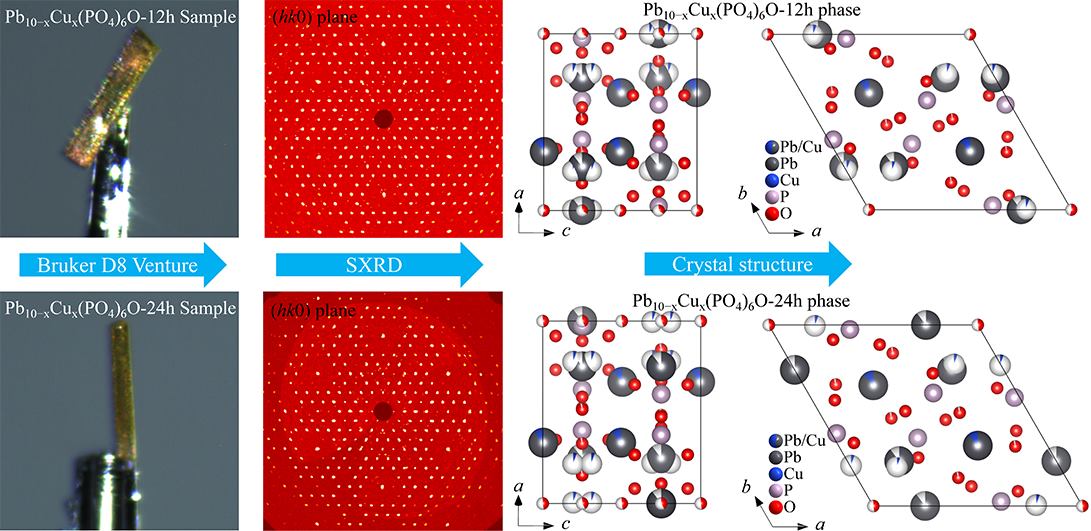
For convenience, the two types of copper-doped lead apatite samples, sintered for 12 h and 24 h, are designated as Pb
10−xCu
x(PO
4)
6O-12h and Pb
10−xCu
x(PO
4)
6O-24h, respectively.
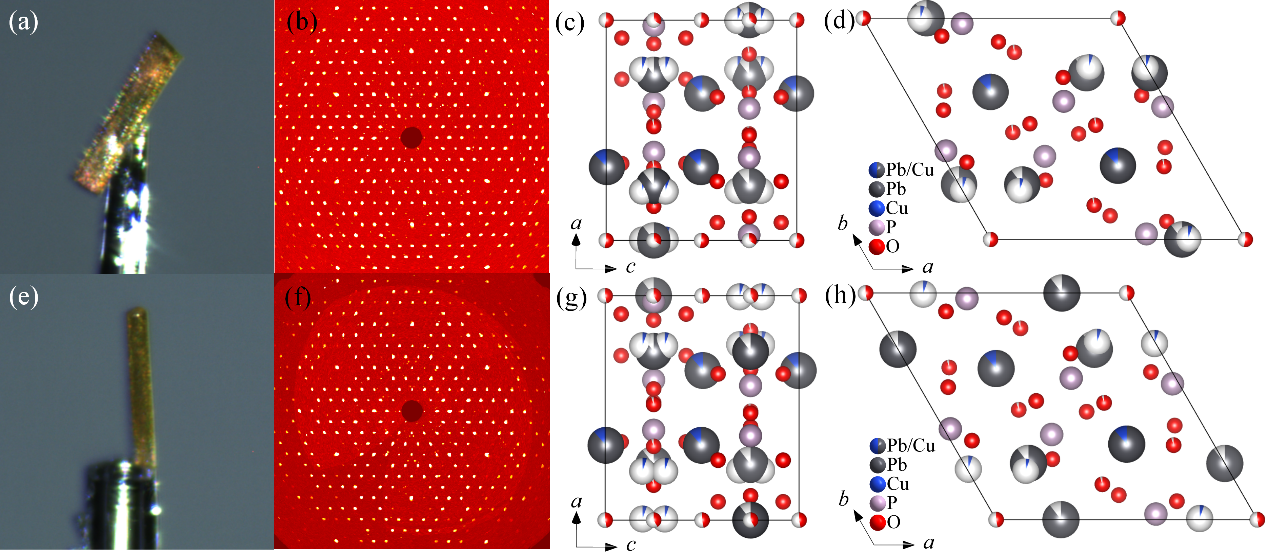
illustrates the sample morphology, precession images, and crystal structure information of Pb
10−xCu
x(PO
4)
6O-12h and Pb
10−xCu
x(PO
4)
6O-24h single crystals. The golden yellow sample depicted in
a,e is copper-doped lead apatite single crystals. This sample exhibits a highly regular and flat morphology, while the diffraction spots shown in
b,e are quite regular. These observations confirm that high-quality copper-doped lead apatite single crystals can be synthesized using the solid-state reaction method.
c,d and
g,h illustrate the projections of the crystal structure of Pb
10−xCu
x(PO
4)
6O-12h and Pb
10−xCu
x(PO
4)
6O-24h phases along the
b and
c axes, respectively. It is evident that the crystal structure of copper-doped lead apatite contains disordered atoms, including O vacancy atoms, Pb/Cu split atoms, and Pb/Cu co-occupy atoms. The crystallographic information, data collection, and structure refinement details for the Pb
10−xCu
x(PO
4)
6O-12h and Pb
10−xCu
x(PO
4)
6O-24h phases are outlined in
. The crystallographic parameters of both phases conform to the standards set by international crystallography for the rationalization of crystal structures. In addition, the crystallographic information files, check cif reports, and the crystallographic information sheets for the two phases Pb
10−xCu
x(PO
4)
6O-12h and Pb
10−xCu
x(PO
4)
6O-24h are also included in the supplementary material.
and
show the equivalent isotropic displacement parameters (
Ueq), fractional atomic coordinates, and atomic occupancy (Occ.) of the Pb
10−xCu
x(PO
4)
6O-12h and Pb
10−xCu
x(PO
4)
6O-24h phases. It can be observed from
and
that the types of disordered atoms in the Cu-doped lead apatite samples, obtained after sintering for 12 and 24 h, remained unchanged. However, the occupancy of each disordered atom exhibited slight variations. In order to facilitate comparison, the atomic coordinates of the Pb
10−xCu
x(PO
4)
6O phase correspond to those reported by Puphal et al. in 2023 [
14]. It was found that the crystal structure of the Pb
10−xCu
x(PO
4)
6O phase refined in this work differs from that reported by Puphal et al. First of all, although the Cu atoms co-occupy with Pb atoms, the occupancy of each atom differs, and the Pb2/Cu2 atoms are actually splitting atoms in this work. Secondly, oxygen atoms O2 and O3 are identified as vacancy atoms in the crystal structure, as reported by Puphal et al. However, in this study, O1A, O1B, and O2 are designated as vacancy atoms. To compare the differences in atomic occupancy. The atomic occupancy of each atom in the Pb
10−xCu
x(PO
4)
6O-12h and Pb
10−xCu
x(PO
4)
6O-24h phases obtained in this study, as well as the atomic occupancy of each atom in the Pb
9Cu(PO
4)
6O phase reported by Puphal et al. [
14], are presented in
.
Table S11 in the supplementary materials presents the crystal structure information of Cu-doped lead apatite, as obtained by Puphal et al. In addition to differences in atomic occupancy, the most significant distinction between the structures reported in this study and Puphal et al. is that in this work, the Pb2/Cu2 atoms are split atoms, whereas Puphal et al. consider the Pb2/Cu2 atoms to be co-occupying. Furthermore, the structure presented in this study includes an additional O1B vacancy atom. The presence of split Pb2/Cu2 atoms leads to a variation in the bond lengths between the Pb2 and O4 atoms compared to those between the Cu2 and O4 atoms. In the Pb
10−xCu
x(PO
4)
6O-12h phase, the bond length between the Pb2 atom and the O4 atom is 2.614 Å, while the bond length between the Cu2 atom and the O4 atom is 2.44 Å. This indicates that, although our refined crystal structure model of the Pb
10−xCu
x(PO
4)
6O phase has some similarities with that reported by Puphal et al., it differs significantly due to the presence of disordered atoms. Consequently, a derivative phase of the Pb
10−xCu
x(PO
4)
6O phase has been obtained and can be concluded. In addition,
Figure S7 and
Figure S8 and
Table S9 and
Table S10 in the supplementary material illustrate the SEM and EDX analyses of the Pb
10−xCu
x(PO
4)
6O-12h and Pb
10−xCu
x(PO
4)
6O-24h phases, confirming the accuracy of the structure refinement results. In short, we have presented a novel crystal structure model of Cu-doped lead apatite mainly determined by SXRD. As most investigations on the superconducting property of Cu-doped lead apatite primarily depend on the previous crystal structure model [
28,
29,
30], the present work is expected to stimulate renewed research into the mechanism of superconductivity of LK-99. It would contribute to building a physical picture of “structure-property” relations.
. Morphology, diffraction, and crystal structure information of Pb<sub>10−x</sub>Cu<sub>x</sub>(PO<sub>4</sub>)<sub>6</sub>O-12h and Pb<sub>10−x</sub>Cu<sub>x</sub>(PO<sub>4</sub>)<sub>6</sub>O-24h phases: (<strong>a</strong>) Morphology information of Pb<sub>10−x</sub>Cu<sub>x</sub>(PO<sub>4</sub>)<sub>6</sub>O-12h single crystal, (<strong>b</strong>) The precession images (<em>hk</em>0) plane of Pb<sub>10−x</sub>Cu<sub>x</sub>(PO<sub>4</sub>)<sub>6</sub>O-12h phase, (<strong>c</strong>) crystal structure diagram of the Pb<sub>10−x</sub>Cu<sub>x</sub>(PO<sub>4</sub>)<sub>6</sub>O-12h phase projected in <em>b</em> axis direction, (<strong>d</strong>) crystal structure diagram of the Pb<sub>10−x</sub>Cu<sub>x</sub>(PO<sub>4</sub>)<sub>6</sub>O-12h phase projected in <em>c</em> axis direction; (<strong>e</strong>) Morphology information of Pb<sub>10−x</sub>Cu<sub>x</sub>(PO<sub>4</sub>)<sub>6</sub>O-24h single crystal, (<strong>f</strong>) The precession images (<em>hk</em>0) plane of Pb<sub>10−x</sub>Cu<sub>x</sub>(PO<sub>4</sub>)<sub>6</sub>O-24h phase, (<strong>g</strong>) crystal structure diagram of the Pb<sub>10−x</sub>Cu<sub>x</sub>(PO<sub>4</sub>)<sub>6</sub>O-24h phase projected in <em>b</em> axis direction, (<strong>h</strong>) crystal structure diagram of the Pb<sub>10−x</sub>Cu<sub>x</sub>(PO<sub>4</sub>)<sub>6</sub>O-24h phase projected in <em>c</em> axis direction.
.
Crystallographic and experimental data of Pb10−xCux(PO4)6O-12h and Pb10−xCux(PO4)6O-24h phases.
|
Pb10−xCux(PO4)6O-12h |
Pb10−xCux(PO4)6O-24h |
| Chemical formula |
Pb8.90Cu1.09O25.50P6 |
Pb8.95Cu1.05O25.48P6 |
| a, b, c/Å |
9.8193(1), 9.8193(1), 7.3743(2) |
9.8327(3), 9.8327(3), 7.3846(3) |
| α, β, γ/° |
90, 90, 120 |
90, 90, 120 |
| V/Å3 |
615.76(2) |
618.31(5) |
| Z |
4 |
4 |
| Space group |
P63/m |
| Crystal system |
Hexagonal |
| Diffractometer |
Bruker D8 Venture Photon 100 COMS |
| Monochromator |
Graphite |
| Tmeas/K |
300(2) |
| Radiation |
Mo-Kα, λ = 0.71073 (Å) |
| Scan mode |
φ and ω scan |
| Absorption correction |
Multi-scan |
| F(000) |
1056 |
1058 |
| Time per step/s |
6 |
9 |
| θ range/° |
2.39~27.40 |
2.39~27.36 |
| μ /mm−1 |
62.053 |
62.041 |
| No. measured reflections |
34,394 |
24,230 |
| No. unique reflections |
507 |
512 |
| No. observed reflections (I > 2σ(I)) |
486 |
486 |
| No. reflections used in refinement |
507 |
512 |
| No. parameters used in refinement |
48 |
47 |
| Reflection range |
−12 ≤ h ≤ 12,
−12 ≤ k ≤ 12,
−9 ≤ l ≤ 9
|
−12 ≤ h ≤ 12,
−12 ≤ k ≤ 12,
−9 ≤ l ≤ 9
|
| Rint |
0.0617 |
0.0580 |
| R(σ) |
0.0105 |
0.0115 |
| Final R indices (Fobs > 4σ(Fobs)) |
R1 = 0.0196,
ωR2 = 0.0423
|
R1 = 0.0209,
ωR2 = 0.0433
|
| R indices (all data) |
R1 = 0.0212,
ωR2 = 0.0429
|
R1 = 0.0233,
ωR2 = 0.0440
|
| Goodness of fit |
1.322 |
1.276 |
| The maximum residual electron densities |
1.63
(0.82 Å from Cu1)
|
0.81
(1.35 Å from Pb2)
|
| The minimum residual electron densities |
−1.04
(0.71 Å from Pb2)
|
−1.01
(0.58 Å from P1)
|
.
The fractional atomic coordinates, atomic occupancy, and equivalent isotropic displacement parameters (Å2) of the Pb10−xCux(PO4)6O-12h phase.
| Label |
Site |
x |
y |
z |
Occ. |
Ueq |
| Pb1 |
4f |
0.333333 |
0.666667 |
0.00405(6) |
0.880(12) |
0.01133(19) |
| Cu1 |
4f |
0.333333 |
0.666667 |
0.00405(6) |
0.120(12) |
0.01133(19) |
| Pb2 |
6h |
0.75155(8) |
0.75165(9) |
0.250000 |
0.897(12) |
0.0149(3) |
| Cu2 |
12i |
0.774(3) |
0.777(3) |
0.189(5) |
0.051(6) |
0.0149(3) |
| P1 |
6h |
0.4006(2) |
0.3757(2) |
0.250000 |
1 |
0.0080(6) |
| O1A |
2b |
1.000000 |
1.000000 |
0.500000 |
0.53(5) |
0.070(13) |
| O1B |
2a |
1.000000 |
1.000000 |
0.250000 |
0.34(4) |
0.070(13) |
| O2 |
6h |
0.3291(8) |
0.4837(8) |
0.250000 |
0.96(3) |
0.015(2) |
| O3 |
6h |
0.5843(8) |
0.4772(8) |
0.250000 |
1 |
0.0246(17) |
| O4 |
12i |
0.3492(6) |
0.2679(6) |
0.0822(7) |
1 |
0.0225(12) |
.
The fractional atomic coordinates, atomic occupancy, and equivalent isotropic displacement parameters (Å2) of the Pb10−xCux(PO4)6O-24h phase.
| Label |
Site |
x |
y |
z |
Occ. |
Ueq |
| Pb1 |
4f |
0.333333 |
0.666667 |
0.00402(6) |
0.888(12) |
0.01276(17) |
| Cu1 |
4f |
0.333333 |
0.666667 |
0.00402(6) |
0.112(12) |
0.01276(17) |
| Pb2 |
6h |
0.75191(9) |
0.75173(10) |
0.250000 |
0.899(12) |
0.0169(2) |
| Cu2 |
12i |
0.777(3) |
0.782(4) |
0.193(5) |
0.050(6) |
0.0169(2) |
| P1 |
6h |
0.4005(3) |
0.3757(3) |
0.250000 |
1 |
0.0093(6) |
| O1A |
2b |
1.000000 |
1.000000 |
0.500000 |
0.47(5) |
0.11(2) |
| O1B |
2a |
1.000000 |
1.000000 |
0.250000 |
0.42(5) |
0.11(2) |
| O2 |
6h |
0.3288(8) |
0.4847(8) |
0.250000 |
0.95(3) |
0.017(2) |
| O3 |
6h |
0.5847(8) |
0.4762(9) |
0.250000 |
1 |
0.0237(17) |
| O4 |
12i |
0.3486(6) |
0.2670(6) |
0.0824(7) |
1 |
0.0220(12) |
.
The atomic occupancy of the Pb10−xCux(PO4)6O-12h, Pb10−xCux(PO4)6O-24h phases and Pb9Cu(PO4)6O phase reported by Puphal et al. [14].
|
Pb10−xCux(PO4)6O-12h |
Pb10−xCux(PO4)6O-24h |
|
Pb9Cu(PO4)6O by Puphal et al. [14] |
| Label |
Occ. |
Occ. |
Label |
Occ. |
| Pb1 |
0.880(12) |
0.888(12) |
Pb1 |
0.90(6) |
| Cu1 |
0.120(12) |
0.112(12) |
Cu1 |
0.10(6) |
| Pb2 |
0.897(12) |
0.899(12) |
Pb2 |
0.86(6) |
| Cu2 |
0.051(6) |
0.050(6) |
Cu2 |
0.14(6) |
| P1 |
1 |
1 |
P1 |
1 |
| O1A |
0.53(5) |
0.47(5) |
O1 |
1 |
| O1B |
0.34(4) |
0.42(5) |
|
|
| O2 |
0.96(3) |
0.95(3) |
O2 |
0.90(6) |
| O3 |
1 |
1 |
O3 |
0.86(6) |
| O4 |
1 |
1 |
O4 |
1 |
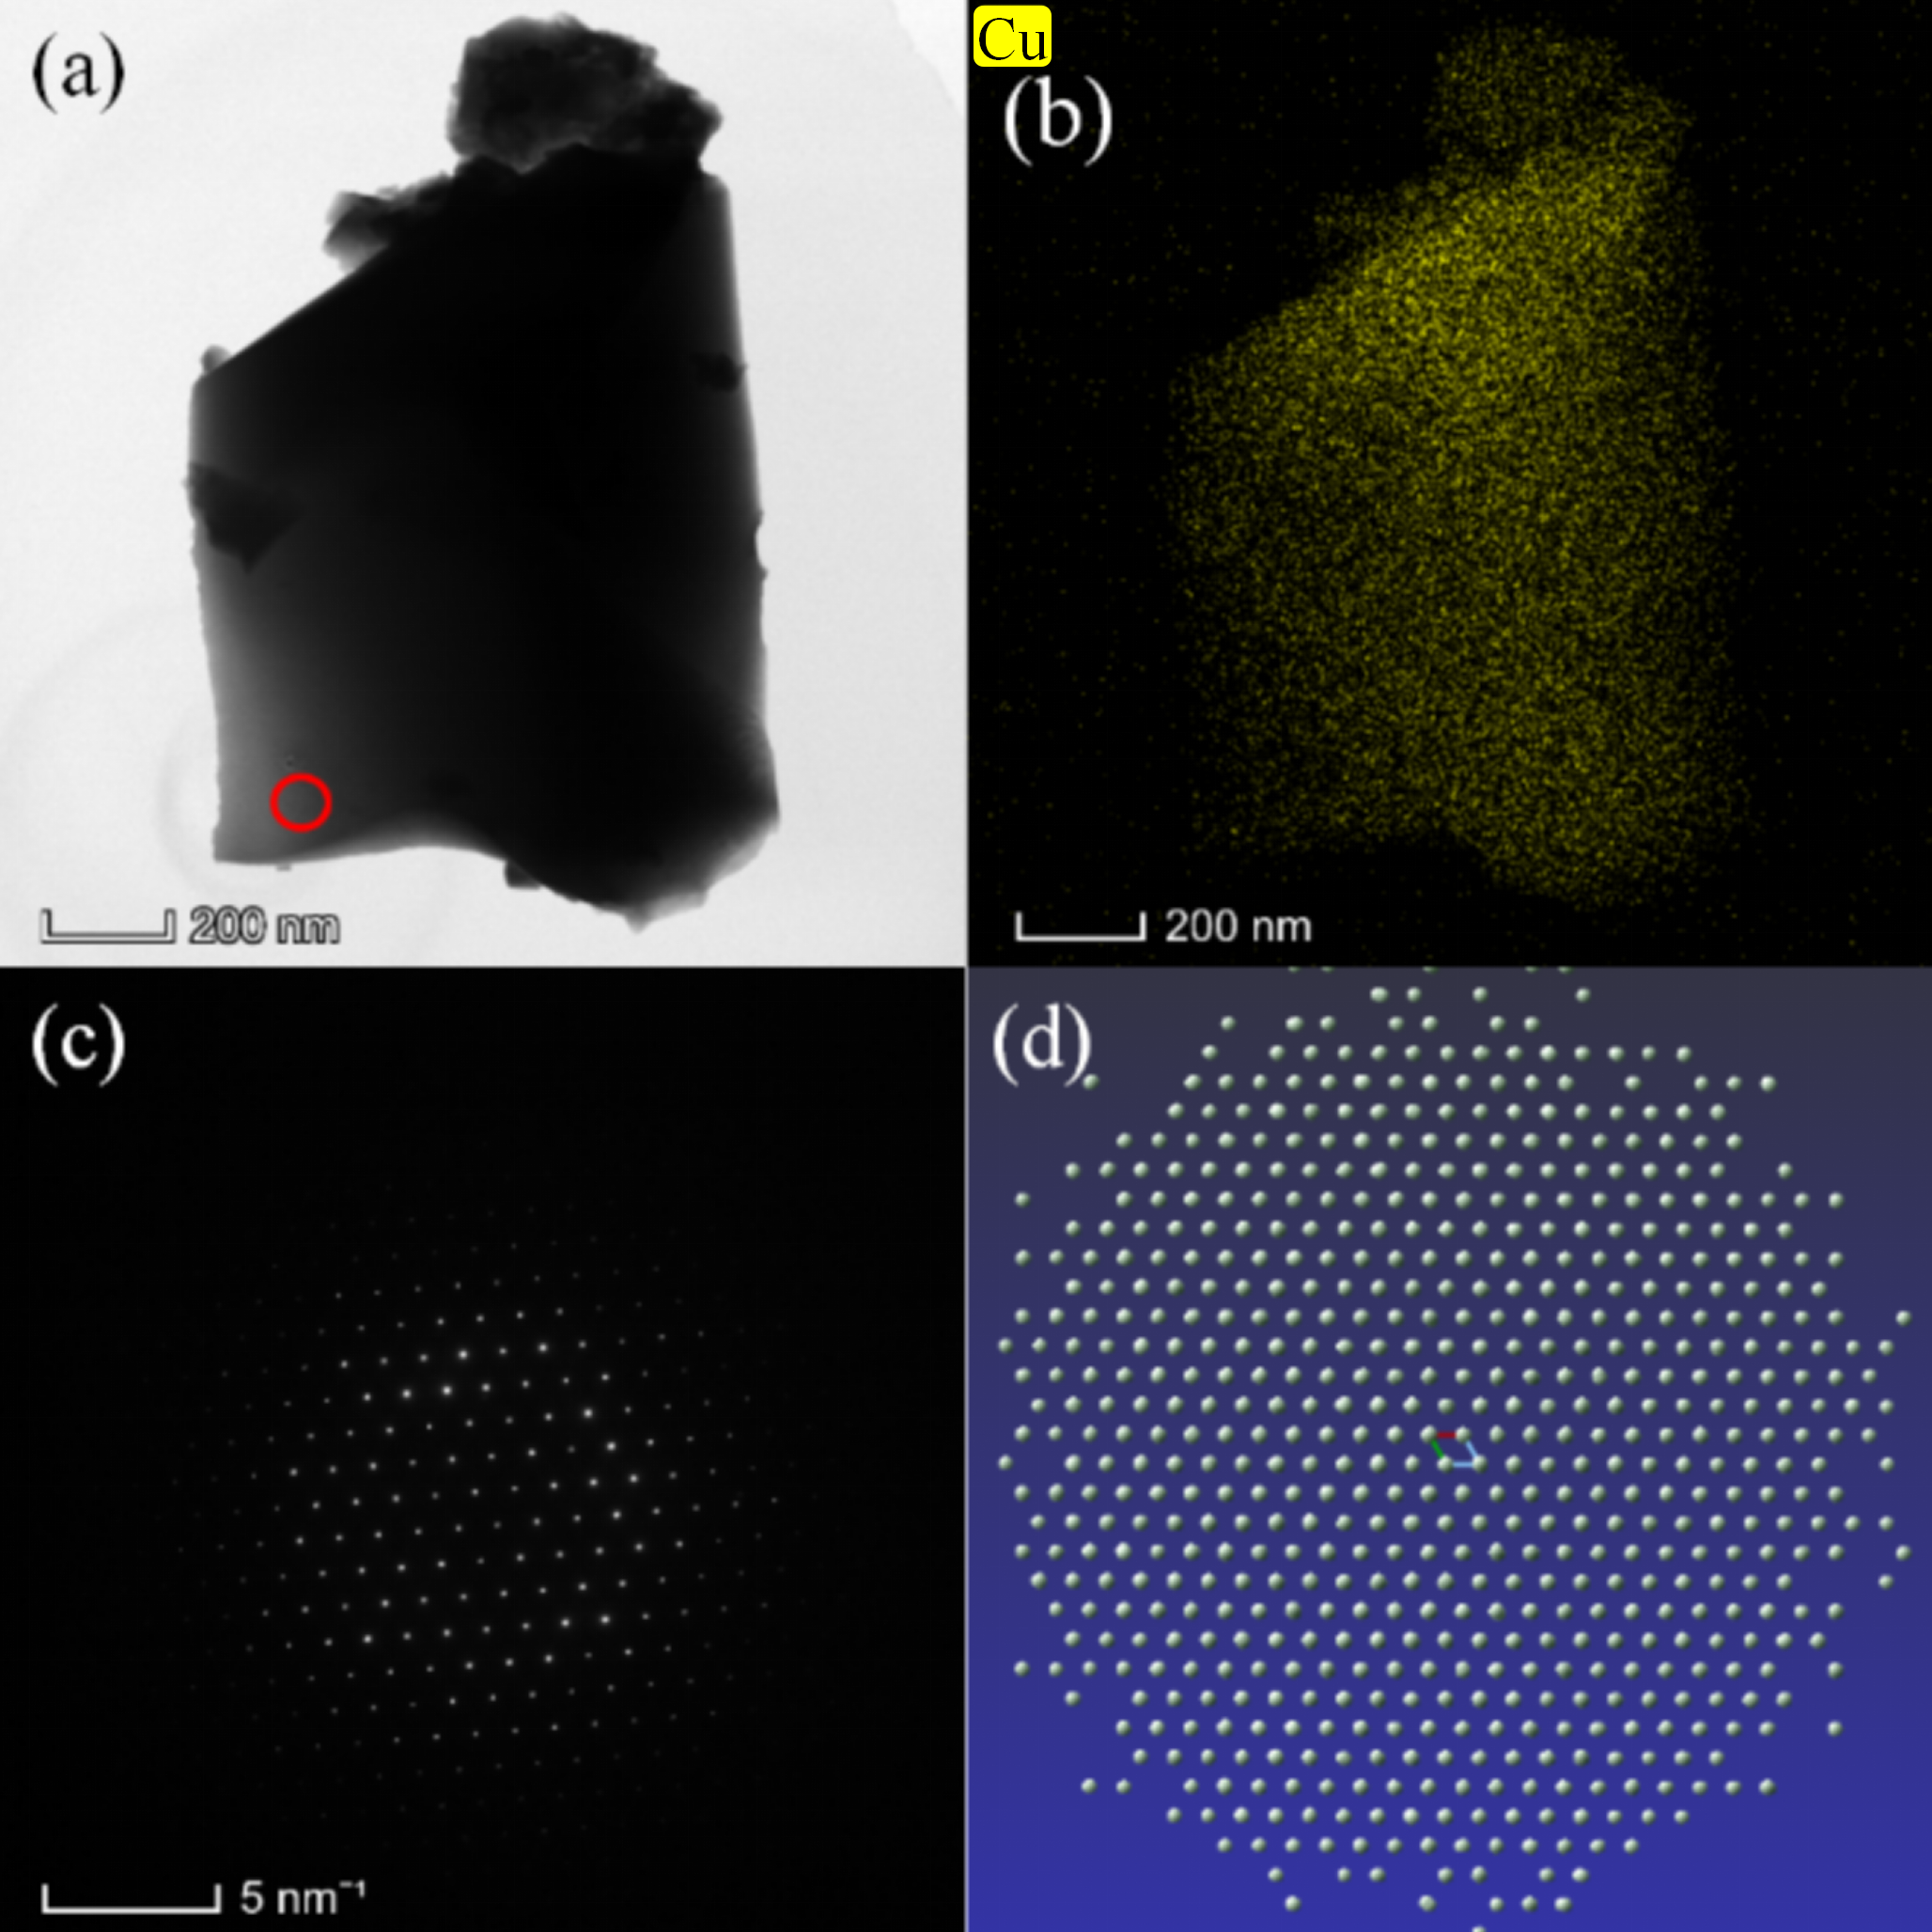
To determine whether Cu atoms are doped into the crystal lattice of lead apatite, transmission electron microscopy (TEM) tests were conducted on the Pb
10−xCu
x(PO
4)
6O-24h sample, with the results presented in
.
a illustrates the microscopic morphology of the Pb
10−xCu
x(PO
4)
6O-24h sample, with the red circle indicating the area of electron diffraction.
b displays the elemental mapping of Cu. The results indicate a uniform distribution of Cu throughout the sample, providing sufficient evidence that Cu atoms have been successfully doped into the crystal lattice of lead apatite. In addition, the single crystal samples of Pb
10−xCu
x(PO
4)
6O-12h and Pb
10−xCu
x(PO
4)
6O-24h were characterized using SEM/EDX. Please refer to the supplementary materials for the results, all of which confirmed the existence of Cu.
c presents the selected electron diffraction (SAED) pattern of the Pb
10−xCu
x(PO
4)
6O-24h sample, with the calibration result indicating the crystal direction [001] of the Pb
10−xCu
x(PO
4)
6O-24h phase.
d illustrates the reciprocal lattice of the Pb
10−xCu
x(PO
4)
6O-24h single crystal along the
c∗ direction, which is the result of the SXRD test. The diffraction patterns depicted in
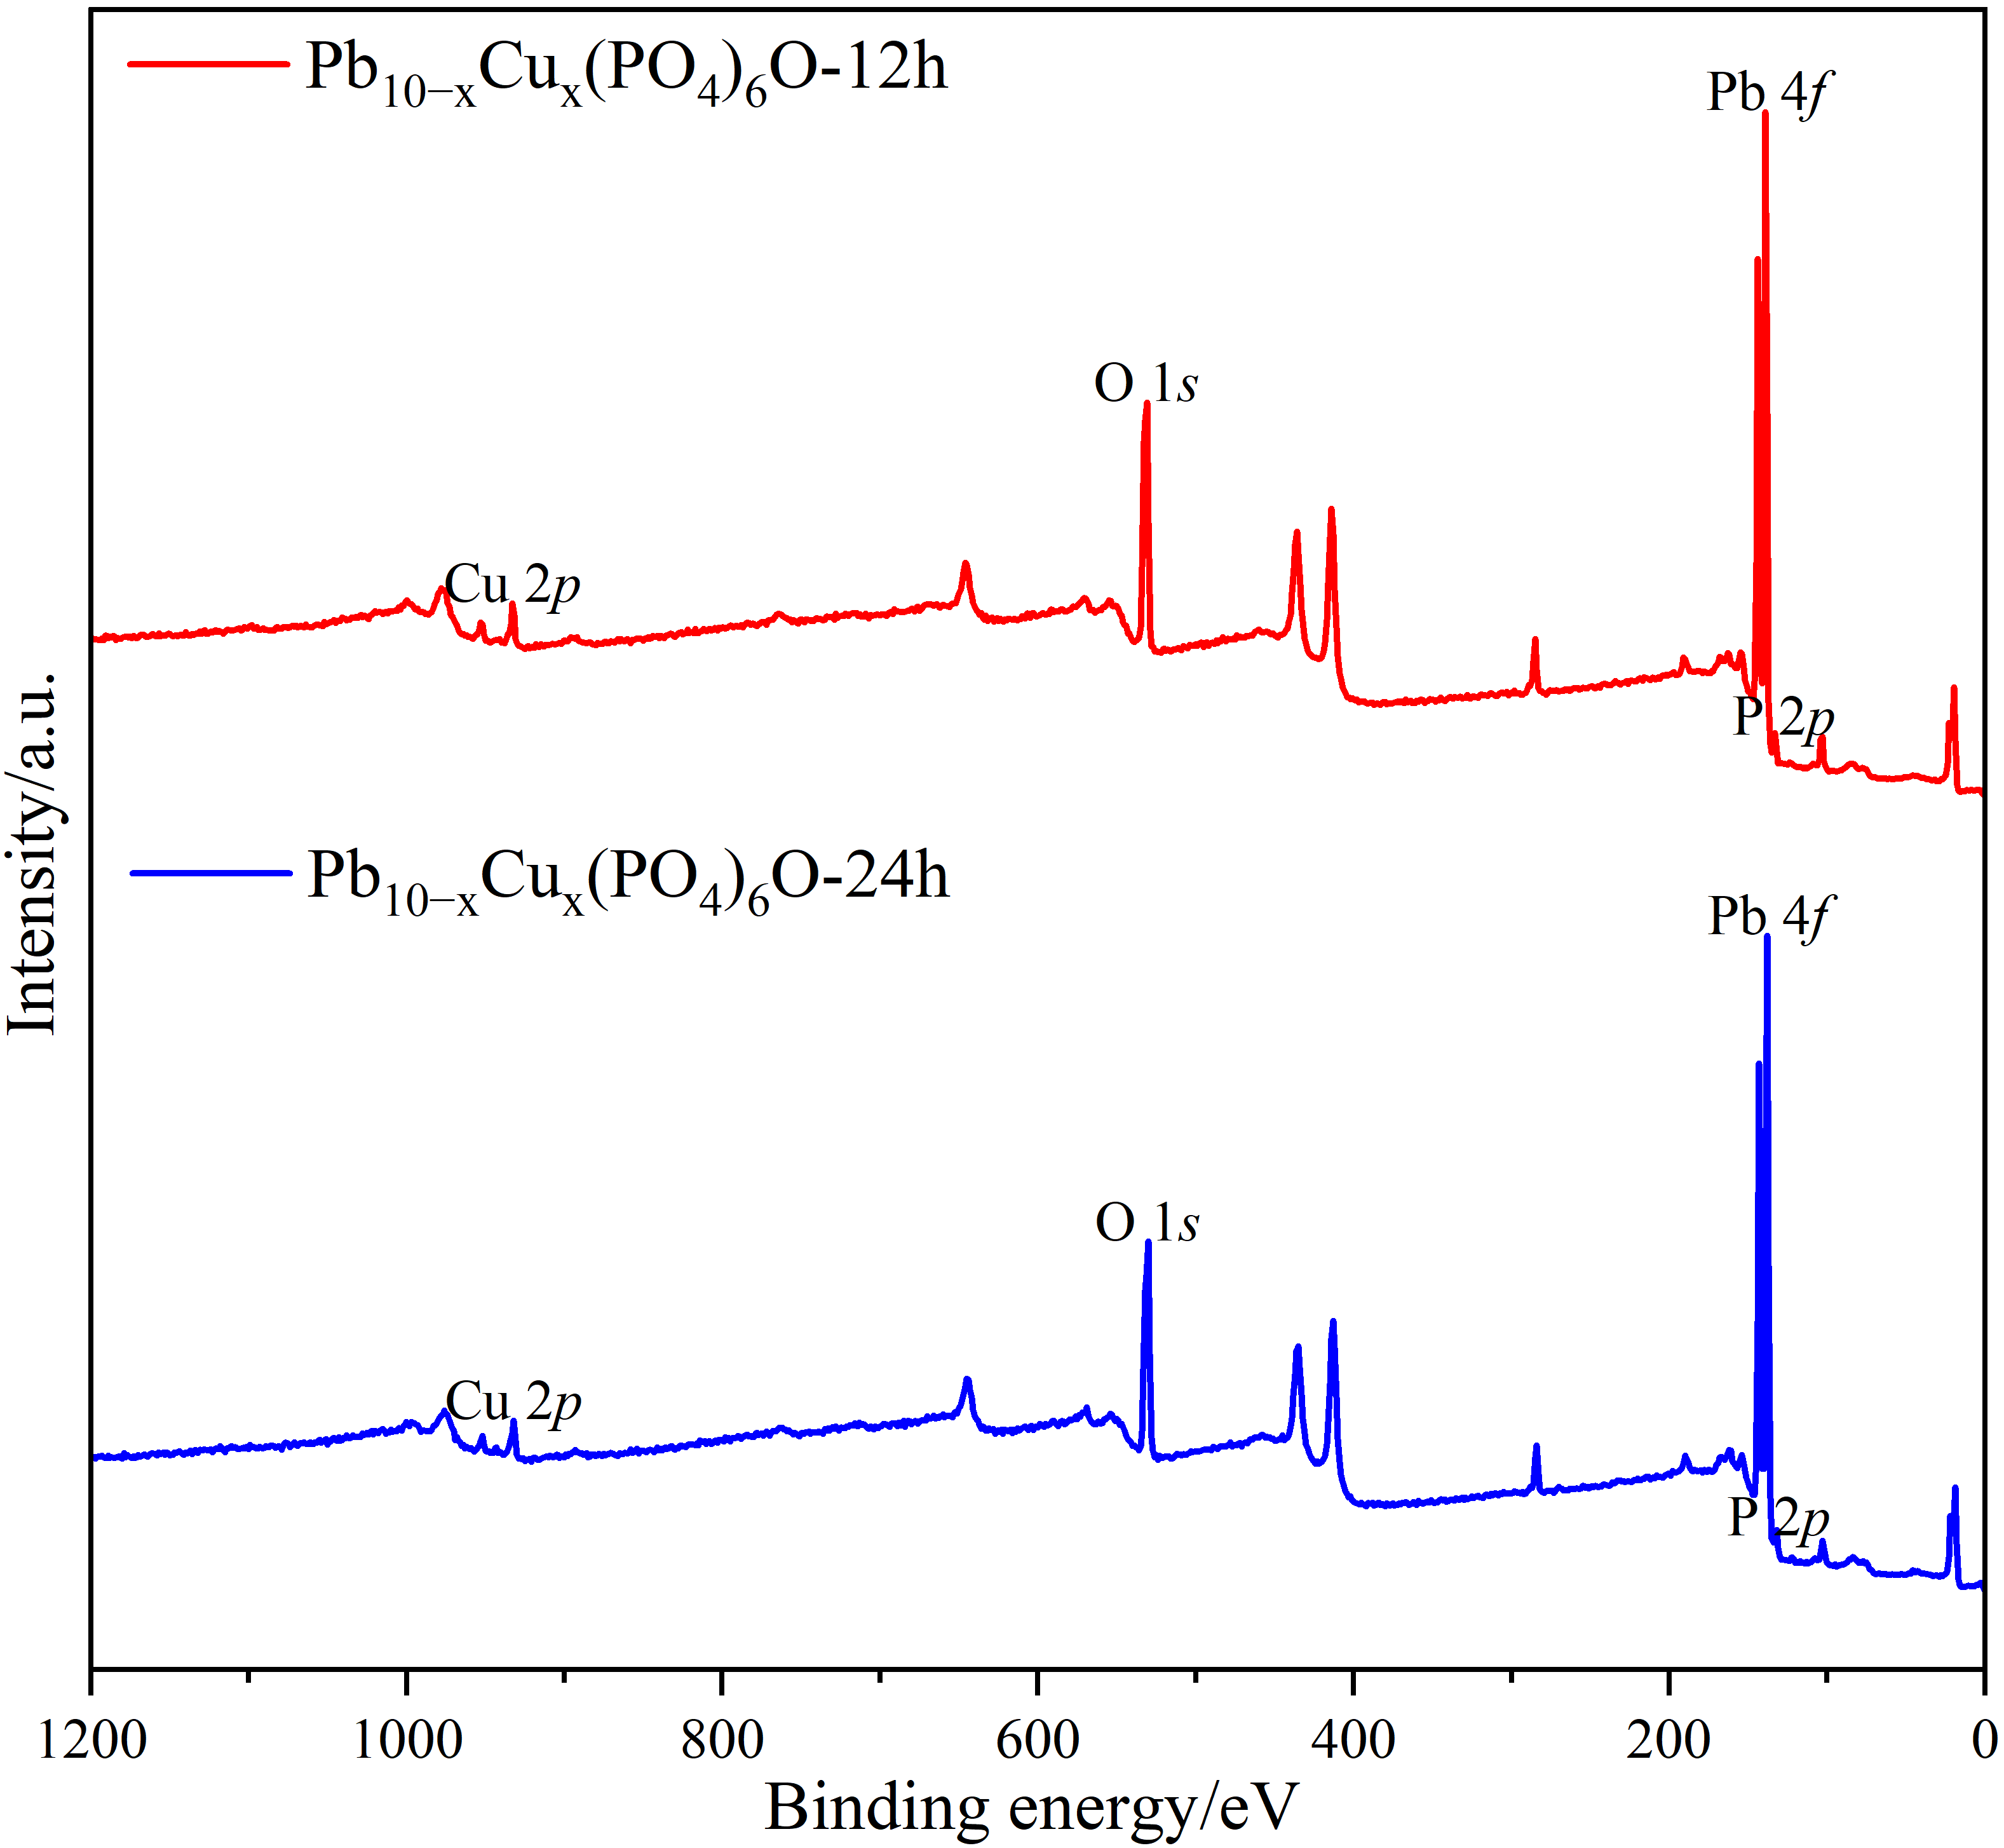
c,d are entirely consistent, confirming the accuracy of the calibration results. In addition, X-ray photoelectron spectroscopy (XPS) tests were conducted on both Pb
10−xCu
x(PO
4)
6O-12h and Pb
10−xCu
x(PO
4)
6O-24h samples, as illustrated in
. The peak at 933 eV corresponds to the characteristic Cu 2
p peak, which directly confirms the presence of Cu elements.
. TEM test results of Pb<sub>10−x</sub>Cu<sub>x</sub>(PO<sub>4</sub>)<sub>6</sub>O-24h sample: (<strong>a</strong>) Bright field image, (<strong>b</strong>) elemental mapping of Cu, (<strong>c</strong>) SAED pattern of [001] Crystal direction, (<strong>d</strong>) Reciprocal lattice pattern of the Pb<sub>10−x</sub>Cu<sub>x</sub>(PO<sub>4</sub>)<sub>6</sub>O-24h phase projected in <em>c∗ </em>directions.
. XPS profile of Pb<sub>10−x</sub>Cu<sub>x</sub>(PO<sub>4</sub>)<sub>6</sub>O-12h and Pb<sub>10−x</sub>Cu<sub>x</sub>(PO<sub>4</sub>)<sub>6</sub>O-24h samples.
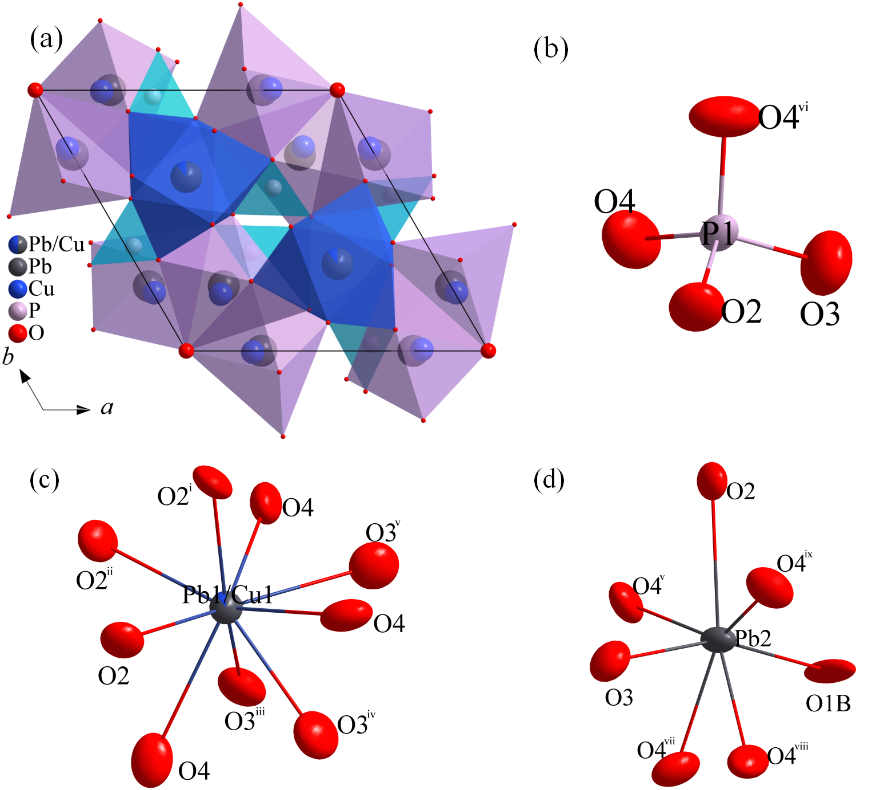
The topological structure of the Pb
10−xCu
x(PO
4)
6O-24h phase is analyzed, revealing that it can be described using three cluster models: P1(1)(1@4), Pb1/Cu1(1)(1@9), and Pb2(1)(1@7). These three clusters are all single-shell clusters, and their assembly model in the Pb
10−xCu
x(PO
4)
6O-24h phase cell is illustrated in
a. Additionally, all adjacent clusters are coplanar.
b,c,d illustrate the surrounding environment diagrams for the P1 atom, Pb1/Cu1 atom, and Pb2 atom, respectively. Surrounding the P1 atom are four atoms: two O4 atoms, one O2 atom, and one O3 atom. The Pb1/Cu1 atom is surrounded by nine atoms, which include three O2 atoms, three O3 atoms, and three O4 atoms. In the case of the Pb2 atom, it is surrounded by seven atoms: one O1B atom, one O2 atom, one O3 atom, and four O4 atoms.
. Topological structure analysis of Pb<sub>10−x</sub>Cu<sub>x</sub>(PO<sub>4</sub>)<sub>6</sub>O-24h phase: (<strong>a</strong>) Assembly model of P1(1)(1@4), Pb1/Cu1(1)(1@9) and Pb2(1)(1@7) clusters in the Pb<sub>10−x</sub>Cu<sub>x</sub>(PO<sub>4</sub>)<sub>6</sub>O-24h unit cell, (<strong>b</strong>) Atomic environment diagram of P1 atom, (<strong>c</strong>) Atomic environment diagram of Pb1/Cu1 atom, (<strong>d</strong>) Atomic environment diagram of Pb2 atom. [Symmetry codes: (i) −<em>x</em> + <em>y</em>, −<em>x</em> + 1, <em>z</em>; (ii) −<em>y</em> + 1, <em>x</em> – <em>y</em> + 1, <em>z</em>; (iii) <em>x</em> − <em>y</em>, <em>x</em>, −<em>z</em>; (iv) <em>y</em>, −<em>x</em> + <em>y</em> + 1, −<em>z</em>; (v) −<em>x</em> + 1, −<em>y</em> + 1, −<em>z</em>; (vi) <em>x</em>, <em>y</em>, −<em>z</em> + 1/2; (vii) −<em>x</em> + <em>y</em> + 1, −<em>x</em> + 1, −<em>z</em> + 1/2; (viii) −<em>x</em> + <em>y</em> + 1, −<em>x</em> + 1, <em>z</em>; (ix) −<em>x</em> + 1, −<em>y</em> + 1, <em>z</em> + 1/2].
Firstly, the crystal structures of four types of natural apatite from various sources were determined using single-crystal X-ray diffraction (SXRD). It was found that these samples comprised one type of fluorapatite and three types of hydroxyapatite, all crystallized in the hexagonal system, P63/m space group. Secondly, a pilot experiment was conducted using the high-temperature sintering of fluorapatite and copper powder. It was found that the fluorapatite remained stable even under high-temperature of 1100 °C for 24 h. Finally, copper-doped lead apatite, which crystallized in the hexagonal system, P63/m space group, has been successfully synthesized through a three-step solid-state reaction. The crystal structure contains three types of disordered atoms: O vacancy atoms, Pb/Cu split atoms, and Pb/Cu co-occupy atoms. The topological analysis indicates that the structure can be characterized by three single-shell clusters: P1 (1) (1@4), Pb1/Cu1 (1) (1@9), and Pb2 (1) (1@7).
The following supporting information can be found at: https://www.sciepublish.com/article/pii/510,
Figure S1: (a) The Phi360 diffraction pattern of the intermediate Pb
2(SO
4)O, (b) the powder diffraction pattern obtained by integrating the Phi360 diffraction pattern;
Figure S2: (a) The Phi360 diffraction pattern of the intermediate Cu
3P, (b) the powder diffraction pattern obtained by integrating the Phi360 diffraction pattern;
Figure S3: Scanning electron microscope (SEM) micrographs of single crystal sample of natural fluorapatite sample (A1) purchased from Shi-kong-dui-wang mineral. EDX analysis was performed for various locations as indicated in
Table S1;
Table S1: The EDX results conducted at every scanning location in the natural fluorapatite sample (A1);
Figure S4: Scanning electron microscope (SEM) micrographs of single crystal sample of natural hydroxyapatite sample (A2) purchased from SNQP-yu-he mineral. EDX analysis was performed for various locations as indicated in
Table S2;
Table S2: The EDX results were conducted at every scanning location in the natural hydroxyapatite sample (A2).
Figure S5: Scanning electron microscope (SEM) micrographs of a single crystal sample of natural hydroxyapatite sample (A3) purchased from Jing-hua-shang-mao mineral. EDX analysis was performed for various locations as indicated in
Table S3;
Table S3: The EDX results conducted at every scanning location in the natural hydroxyapatite sample (A3);
Figure S6: Scanning electron microscope (SEM) micrographs of single crystal sample of natural hydroxyapatite sample (A4) purchased from Xun-cheng-kuang-wu mineral. EDX analysis was performed for various locations as indicated in
Table S4;
Table S4: The EDX results conducted at every scanning location in the natural hydroxyapatite sample (A4);
Table S5: Refined atomic coordinates of A1 (fluorapatite purchased from Shi-kong-dui-wang mineral) in the hexagonal
P6
3/
m (No. 176) structure, extracted from single crystal XRD measurements. The obtained lattice constants are
a,
b = 9.3849(3) Å and
c = 6.8814(3) Å;
Table S6: Refined atomic coordinates of A2 (hydroxyapatite purchased from SNQP-yu-he mineral) in the hexagonal
P6
3/
m (No. 176) structure, extracted from single crystal XRD measurements. The obtained lattice constants are
a,
b = 9.3654(4) Å and
c = 6.8786(3) Å;
Table S7: Refined atomic coordinates of A3 (hydroxyapatite purchased from Jing-hua-shang-mao mineral) in the hexagonal
P6
3/
m (No. 176) structure, extracted from single crystal XRD measurements. The obtained lattice constants are
a,
b = 9.3731(4) Å and
c = 6.8769(3) Å;
Table S8: Refined atomic coordinates of A4 (hydroxyapatite purchased from Xun-cheng-kuang-wu mineral) in the hexagonal
P6
3/
m (No. 176) structure, extracted from single crystal XRD measurements. The obtained lattice constants are
a,
b = 9.3801(3) Å and
c = 6.8748 (3) Å;
Figure S7: Scanning electron microscope (SEM) micrographs of single crystal sample of Pb
10−xCu
x(PO
4)
6O-12h. EDX analysis was performed for various locations as indicated in
Table S9;
Table S9: The EDX results were conducted at every scanning location in the Pb
10−xCu
x(PO
4)
6O-12h sample.
Figure S8: Scanning electron microscope (SEM) micrographs of single crystal sample of Pb
10−xCu
x(PO
4)
6O-24h. EDX analysis was performed for various locations as indicated in
Table S10;
Table S10: The EDX results conducted at every scanning location in the Pb
10−xCu
x(PO
4)
6O-24h sample;
Table S11: Refined atomic coordinates of Pb
9Cu(PO
4)
6O in the hexagonal
P6
3/
m (No. 176) structure, extracted from single crystal XRD measurements by Puphal et al. The obtained lattice constants are a,
b = 9.7393(19) Å and
c = 7.3953(12) Å. In addition to the above tables and figures, the crystallographic information files, check cif reports, and the crystallographic information sheets for the six phases A1, A2, A3, A4, Pb
10−xCu
x(PO
4)
6O-12h, and Pb
10−xCu
x(PO
4)
6O-24h are also included in the supplementary material.
The authors express gratitude to the Fund of National Natural Science Foundation of China (grant No. 52173231; grant No. 51925105), Hebei Natural Science Foundation (grant No. E2022203182), The Innovation Ability Promotion Project of Hebei supported by Hebei Key Lab for Optimizing Metal Product Technology and Performance (grant No. 22567609H) for providing financial support for this study.
Conceptualization, C.F. and L.Z.; Investigation, Y.L., B.Z., B.W., C.F. and L.Z.; Writing—Original Draft Preparation, Y.L.; Writing—Review & Editing, C.F., B.Z., B.W. and L.Z.; Supervision, C.F.; Funding Acquisition, C.F. and B.W.
Not applicable.
Not applicable.
Data will be made available on request.
The National Natural Science Foundation of China (grant No. 52173231; grant No. 51925105); Hebei Natural Science Foundation (grant No. E2022203182); The Innovation Ability Promotion Project of Hebei supported by Hebei Key Lab for Optimizing Metal Product Technology and Performance (grant No. 22567609H).
The authors declare that they have no known competing financial interests or personal relationships that could have appeared to influence the work reported in this paper.