
Fibrous SiC-based Mesoporous Solids for the Photocatalytic Degradation of Organic Pollutants under Artificial Light

Author Information
Other Information
Institut Européen des Membranes (IEM), Univ. Montpellier, CNRS, ENSCM, 34095 Montpellier, France
*
Authors to whom correspondence should be addressed.
Received: 06 June 2023 Accepted: 03 October 2023 Published: 11 October 2023

© 2023 The authors. This is an open access article under the Creative Commons Attribution 4.0 International License (https://creativecommons.org/licenses/by/4.0/).
Views:3017
Downloads:1680
Photocatal. Res. Potential
2024,
1(2), 10006;
DOI: 10.35534/prp.2023.10006
ABSTRACT:
SiC-based mesoporous solids with fibrous nanostructure were prepared by impregnation of a polycarbosilane precursor on annealed polyacrylonitrile (PAN) fibers and subsequent pyrolysis. The obtained material exhibits a mesoporous structure and has a specific surface area of ~20 m2/g. It has a semiconducting electronic character with a bandgap of 2.65 eV, i.e., in the visible range. Adsorption tests of methylene blue were performed on the material under dark conditions, which showed an adsorption amount of 78 wt%. The photocatalytic activity of the material was then evaluated for the degradation of the dye under artificial daylight irradiation over a period of 7 h. A degradation of 94 wt% was achieved. Regeneration and reuse of the material was also tested and resulted in 97 wt% degradation after reuse, indicating potential interest of the material as a contactor in environmental remediation devices.
Keywords:
Silicon carbide; Preceramic polymers; Ceramics; Photocatalysis; Fibers
1. Introduction
Water is the most important resource for life on earth. Unfortunately, a large number of the drinking water in rivers and groundwater bodies is polluted with inorganic and organic wastes, mainly due to the increasing discharge of municipal and industrial wastewater [1]. The pollutants present in water affect the environment and also human life. Heavy metals and some other organic pollutants have been found to be carcinogenic [2]; also, some dyes present in wastewater show mutagenic and cytotoxic effects on humans. Besides, they have been found to have the potential to cause allergic dermatitis, skin irritation, and even cancer [3].
There are several methods to remove pollutants from water. One of them is photocatalysis, which can achieve the total mineralization of most organic pollutants [4] according to the following steps: (1) Transfer of reactants from the liquid phase to the surface; (2) Adsorption of at least one of the reactants; (3) Reaction in the adsorbed phase. Here, the photocatalytic reaction is carried out with a photonic activation of the catalyst [5], in which a semiconducting catalyst is irradiated with an energy higher than its bandgap energy [6]. Then an electron jumps from the valence band to the conduction band, leaving a positively charged hole in the valence band. This hole can oxidize water molecules and form hydroxyl free radicals (•OH), which attack the pollutant molecules in water the most [7]. The electron in the conduction band also contributes by forming O2•− species.
Much work has focused on the use of metal oxide nanoparticles as photocatalysts for the degradation of organic pollutants. In addition to compounds such as vanadium oxide, zinc oxide, and tin oxide, titanium oxide (TiO2) remains the most common materials used as photocatalysts for the removal of organic pollutants [7]. However, the bandgap of anatase TiO2, the most commonly used compound for photocatalysis, is always 3.2 or 3.5 eV, which corresponds to the UV range, unless the bandgap can be reduced to the visible range by very specific surface preparation [8] or doping. Alternatively, inorganic materials may be considered as they could combine interesting properties such as a bandgap in the visible range and superior mechanical, chemical, and thermal resistance. Silicon carbide (SiC) belongs to the family of such materials.
The use of SiC as a photocatalyst for the degradation of organic pollutants in water can be found in the literature: for example, the use of Ag-decorated β-SiC for the photo-degradation of Orange G and Amido Black 10B under UV light [9]. Also, the degradation of methylene blue under visible light by using SiC hollow spheres with a bandgap of 2.15 eV (obtained by a vapor–solid reaction using carbon spheres as templates) [10]. Recently, we published the preparation and characterization of SiC foams as photocatalytic solids for the destruction of methylene blue in water [11]. We had used polyurethane foams taken from packaging waste as template materials for SiC.
In this work, we also use SiC as a photocatalyst for the degradation of methylene blue under visible light. However, instead of using polyurethane foams as the template material, which end up being a somewhat brittle material, we used polyacrylonitrile (PAN) fibers produced by electrospinning as the template. The PAN fibers have been used as precursors for carbon fibers [12], giving them characteristics such as light weight, low oxidation resistance, high mechanical properties [13], and high strength [12]. We used such fibers as a solid template after annealing treatment under air at 250 °C, which we impregnated with a solution of polycarbosilane (SiC precursor). Subsequently, the impregnated fibers were pyrolyzed to obtain a SiC based fibrous matrix. Therefore, our work slightly differs from previous studies that have focused on the synthesis of SiC using PAN fibers as a template. For example, electrospun PAN fibers were used as a template for the synthesis of SiC nanowires with uniform cross-section [14]. Needle-shaped 3C–SiC nanowires have also been fabricated on PAN carbon fibers by the reaction of Si vapor on the fibers (vapor-solid reaction) [15].
In this article, we introduce the fabrication method of the photocatalytic material, then we present an extensive structural, textural, and electronic characterization of the material and finally we evaluate its efficiency for the degradation of methylene blue under artificial daylight, which consists mainly of rays belonging to the visible range.
2. Materials and Methods
2.1. Materials
The SiC precursor AHPCS (SMP-10) structural formula (SiH2CH2)0.9(Si(allyl)HCH2)0.1 was purchased from Starfire Systems, Inc. (Glenville, NY, USA). Porogen Block copolymer SBS (polystyrene-block-polybutadiene-block-polystyrene; 30 wt%, Mw = 140) was acquired from Sigma-Aldrich (France). The cyclohexane C6H12 (ACS 99+ %) used as solvent was obtained from Alfa Aesar.
The model dye methylene blue (C16H18ClN3S·xH2O from Sigma-Aldrich) was used for the photodegradation experiments.
2.2. Material Fabrication
The SiC material was synthesized by the replica method, using PAN fiber as a template and a precursor solution prepared by dissolving SBS triblock copolymer in cyclohexane and subsequently, adding AHPCS with stirring until the mixture was homogenized [16].The mass ratio between AHPCS and copolymer was 1:1. PAN fibers were prepared by electrospinning a solution of 10% w/w polyacrylonitrile (purchased from Sigma Aldrich, ref 181315, Mw 150,000) in N,N-dimethylformamide (DMF, Sigma Aldrich, D4551, >99%, molecular biology grade). The rotating electrode on which the fibers were collected was placed 15 cm from the injection capillary. The voltage was set at 20 kV and the flow rate was 2.4 mL/h. The rotation speed of the collector was set at 2000 rpm to ensure good alignment of the fibers. After drying at room temperature for 12 h, the nanofibers were annealed in a chamber oven under air for 2 h at 250 °C after a ramp of 120 °C/h.
Before impregnation with the precursor solution, PAN fibers were folded to obtain a thick material and to make it less brittle. Then, the PAN folding was immersed in the precursor solution under vacuum for 15 min and then left to dry for 20 min. It was finally immersed in the solution again after 5 min to ensure the coating on the outer layer. The material was left to dry for 40 min and subsequently, it was pyrolyzed inside a tubular furnace under an argon atmosphere at a rate of 120 °C/h to 1200 °C with a dwell time of 2 h.
2.3. Characterization
The surface morphology of the foams was analyzed with a Hitachi S4800 scanning electron microscope (SEM) and the energy-dispersive X-ray spectroscopy (EDX) was detected by a SEM Zeiss EVO HD15. The crystal structure of the photocatalyst was characterized by x-ray diffraction on a Panalytical Xpert diffractometer using CuKa radiation. Nitrogen adsorption measurements were performed on a Micrometrics instrument ASAP 2020. Surface area was obtained by means of the BET model and the pore size distributions were calculated using the Barret–Joyner–Halenda (BJH) method desorption branch. The FTIR spectrum was obtained from a Nexus spectrometer in the 500–4000 cm−1 range. The reflectance of the SiC photocatalyst was measured by UV-visible diffuse-reflectance spectroscopy using a Perkin Elmer Lambda equipped with an integrating sphere of 150 mm diameter and the spectrum of hemispherical reflectance was obtained on a wavelength range between 250 and 2500 nm. The optical bandgap was calculated from the reflectance values using the Kubelka-Munk function.
2.4. Adsorption Capacity and Photocatalytic Degradation
The experiment started with a solution of methylene blue (MB) with a concentration of 9 × 10⁻⁶ mol/L, then 0.26 g of the SiC material were added. Then, they were left to stir for 4 h in dark conditions before starting the photocatalytic degradation. At the same time, a solution of MB without SiC was also kept stirring in dark as a blank experiment. An aliquot was taking every hour and then it was analyzed using a Shimadzu UV-240IPC spectrophotometer.
The adsorption capacity of the dye on the SiC foam was measured considering the results from the experiment in dark conditions, and it was calculated with the following equation [17]:where qt (mg/g) is the amount of MB adsorbed at time t, V is the volume of the solution, m is the mass of the SiC foam used, C0 is the MB initial concentration and C is the concentration at a time t.
The percentage of dye retained on the SiC was calculated using the next equation [18]:
where R is the percentage of removal.
The photocatalytic activity of the SiC was tested by photodegradation of MB under artificial daylight irradiation (emission ranging from 350 to 800 nm), using an Osram HQI-TS 150 W lamp as the irradiation source directly placed 10 cm above the solution to avoid light absorption from the glass beaker (as shown in Figure 1). The wavelength distribution of the light source, shown as supplementary information (Figure S1), is a metal halide source designed to reproduce as well as possible daylight, with less than 5% of its spectral distribution in the very close UV range.
The photodegradation was measured for 7 h, by taking an aliquot every hour and then analyzing it with the spectrophotometer.
After the photocatalytic test, the material was rinsed with ethanol and water several times and then left to dry overnight at room temperature. Subsequently, the material was reused to photodegrade the MB and thus, to observe the degradation capacity after rinsing it.The degradation efficiency η of the material was calculated following the Beer-Lambert law, where MB absorbance is proportional to the concentration, as in Equation (3) [19,20]:
where C0 and A0 are the MB initial concentration and absorbance, and C and A are concentration and absorbance at a time t, respectively.
The adsorption capacity of the material was measured as well.
```latex
q_t=\frac{(C_0-C)×V}{m}
```
```latex
R(\%)=100-(\frac{C}{C_0}×100)
```

Figure 1. Setup used for the photocatalytic degradation of MB under visible light.
```latex
η\%=\frac{C_0-C}{C_0} ×100\%=\frac{A_0-A}{A_0} ×100\%
```
3. Results and Discussion
3.1. Characterization
The photocatalyst obtained after pyrolysis is observed in Figure 2, where it is possible to see the shrinkage of the material compared to the initial PAN fiber before SiC deposition (Figure 2a). This shrinkage occurs due to the elimination of volatile compounds present in the PAN fibers [13]. The structure of the SiC material obtained was observed by SEM. The structure of the PAN fiber used as a template is shown in Figure 3a,c,e, where it is clearly observed the way the PAN layers were arranged. Then, in Figure 3b,d,f we can observe the fibers after the pyrolysis and formation of SiC. The SiC covered the PAN fibers and some of the SiC was deposited on the surface forming a layer on the fibers. The straight shape of the initial PAN fibers had a slight change to a less straight shape due to the high temperature it underwent during the pyrolysis process [13].
The composition of the fibers before and after SiC deposition was obtained from the EDX analysis and can be observed in Figure 4 and Figure 5, respectively. From Figure 4, we can see that the amount of carbon is very high with regards to silicon in the final material. This is not surprising as PAN fibers are known as precursor materials for the elaboration of carbon fibers. Therefore, we likely obtained fibers made of a carbon core surrounded by a SiC layer, with possible carbon excess in the Si:C stoichiometry.
The X-ray diffraction results suggest that the prepared SiC material is amorphous, as seen in Figure 6, where the XRD pattern does not show any narrow peak that implies a crystal structure, or any peak related to SiC, as we pointed out the expected positions for such peaks. One can also note that there is no strong peak at 26° that would be attributed to the 002 peak of graphite. Carbon excess is therefore likely to be in the shape of amorphous carbon.The FTIR spectra are shown in Figure 7. Figure 7a presents the spectrum of the PAN fiber used as a template. The peak located at about 2240 cm−1 is attributed to the C≡N stretching of the acrylonitrile unit in the polymer chain, one of the main functional groups of PAN fibers. The bands at 1369 cm−1 (CH bending), 1458 cm−1 (CH2 bending) and 2940 cm−1 (CH stretching) are characteristics of aliphatic CH groups along the PAN backbone. These peaks almost completely disappear after pyrolysis (as seen in Figure 7b), and a new peak appears around 1600 cm−1, which corresponds to the C=C bond, due to the formation of the carbon fiber structure [21]. Another peak is also visible in Figure 7b at around 815 cm−1, and corresponds to the formation of SiC.
Altogether, XRD and FTIR results suggest that the amorphous SiC phase expected to form at such a pyrolysis temperature [11,22,23] might be mixed with amorphous carbon originating from the calcination of PAN fibers, in a proportion large enough to make the Si–C stretching bond visible, but too low to resolve the SiC large Bragg peaks.
The nitrogen adsorption-desorption isotherm of the SiC sample is shown in Figure 8. We can see the presence of a hysteresis loop, which corresponds to a type IV isotherm according to IUPAC classification. It confirms the presence of mesopores in the final material [24]. The BET specific surface area for the SiC sample is 19 m2/g. On the other side, Figure 9 shows the pore size distribution obtained from the desorption branch by the BJH method, with an average pore size of 19.6 nm.
3.2. Bandgap
The reflectance spectrum was obtained for the SiC material and is shown in Figure 10. These data were used for the calculation of the bandgap energy along with the Kubelka-Munk function F(R∞). By using this function, the reflectance data can be converted into the absorption coefficient as shown in Equation (4):
where R∞ is the reflectance of an infinitely thick specimen, K is the absorption coefficient and S is the scattering coefficient. Kubelka-Munk function could be substituted by the absorption coeffient α as in Equation (5) [25,26]:Then, from Tauc equation:Substituting F(R∞) instead of α gives:where h is the plank constant, v is the photon frequency, A is a proportional constant, Eg is the bandgap energy and n is the transition nature with values of n = 1/2 for direct allowed transition, n = 3/2 for direct forbidden transition, n = 2 for indirect allowed transition, and n = 3 for indirect forbidden transition. Then, the bandgap is calculated from plotting (F(R∞)hν)1/n as function of photon energy hν and from the intersection with the x-axis of the linear fit of the region associated to the optical absorption edge [25,26,27].
Bandgap was calculated using each of the transition nature (n) values available, in order to observe the type of transition presented by the material. Figure 11 shows the different plots obtained for each n value, and as it is observed in Figure 11d, using n = 1/2 gives the best fit to obtain the bandgap, suggesting that the material has a direct allowed transition. The bandgap calculated was 2.67 eV, which makes this material a photocatalyst capable of working under visible light.
3.3. Adsorption Capacity
The results of the experiment carried out in the dark are shown in Figure 12. As can be observed, the MB solution without photocatalytic material presents a negligible discoloration, while the SiC material shows a significant decrease in time. Moreover, the reused SiC material is also presented in Figure 12 the discoloration is slightly lower than that for the first use of the material. As we can see in Figure 13, the retention percentage of MB on the material is about 78% for the first use of the SiC and then drops to 72% when it is reused, which indicates that the SiC lost around 6% of its MB retention capacity. The exact amount of MB degraded per gram of SiC was calculated with Equation (1) and the results are presented in Figure 14.A kinetic model was used to analyze the adsorption kinetics, which were the pseudo-first order (PFO) and the pseudo-second order (PSO) kinetic models. Then, the adsorption data obtained were fitted to these models. The pseudo first order equation of Lagergren is represented as:where k1 is the rate constant in (min−1), qe and qt are the adsorption capacity in the equilibrium and at a time t, respectively [28]. Then, considering boundary conditions as t = 0 to t = t and qt = 0 to qt = qt, and then integrating it, it gives [29]:A plot of ln(qe − qt) vs t is obtained (Figure 15), and from the linear fitting, the slope is calculated. This value represents the rate constant k1 [30]. From Figure 15, it is observed negative values, which indicates that the MB concentration in the solution decreases as time increases. The rate constant obtained was k1 = 0.0096 min−1, and R2 = 0.9584.
For the PSO kinetic model, the equation is expressed as follows:with k2 (g/mg·min) as PSO rate constant, qe and qt are the adsorption capacity at equilibrium and at time t, respectively. For this equation, the boundary conditions are applied as well (t = 0 to t = t and qt = 0 to qt = qt) and after integration, Equation (10) becomes [29]:Then, this equation is arranged, and gives:The linear form of Equation (12) is [29]:The k2 was calculated from the slope of linear plot of $$\frac{1}{q_t}$$ vs t [30]. This plot is represented in Figure 16. The calculated k2 = 0.856 and the correlation coefficient obtained was R2 = 0.6039.
Therefore, comparing the correlation coefficient obtained from the PFO and the PSO kinetic model, we can conclude that the kinetic mechanism that governs the adsorption is the PFO, and it suggest a physisorption mechanism, probably promoted by the SSA and by the high amount of carbon contained in the material, which leads to a high adsorption of dye [31].3.4. Photocatalytic Evaluation under Artificial Daylight
The photocatalytic evaluation of the SiC was carried out after the dark experiment for 7 h of artificial daylight irradiation. To exclude photolysis, a blank sample was used only with MB solution without SiC. Figure 17 shows the results obtained, including the results from the dark experiment, and the results of the SiC reused were included to observe the photocatalytic performance and compared it with the data of the 1st use of the material.
The degradation process that took place first starts with the irradiation with artificial daylight, which includes photons of higher energy than the bandgap of the SiC material (2.67 eV). According to the most probable scenario, this energy excites the electrons (e−) in the valence band, transferring them to the conduction band and leaving behind photogenerated holes (h+). The electrons can move and act as reductors to produce superoxide radicals (∙O2−) whose function is to oxidize the dye molecules. On the other hand, the photogenerated holes can react with the H2O molecules to form hydroxyl radicals (∙OH) that also act as oxidants and with the (∙O2−) to degrade MB molecules turning them into CO2 and H2O [32,33]. As these photocatalytic mechanisms are well-known, we focused on the quantification of the catalytic performance of our SiC-based material.

Figure 2. Photographs of (a) PAN fiber before SiC deposition and (b) SiC formed after pyrolysis.

Figure 3. (a,c,e) PAN fiber used as template and (b,d,f) SiC based photocatalytic material at different magnifications.

Figure 4. EDX results for the PAN fiber before SiC deposition.

Figure 5. EDX results for the SiC photocatalyst.

Figure 6. XRD pattern for the SiC photocatalyst. Positions of the main Bragg peaks expected for face-centered cubic SiC are shown for guidance.

Figure 7. FTIR spectra of the (a) PAN fiber and the (b) SiC material obtained.

Figure 8. Nitrogen adsorption-desorption isotherm for the SiC on PAN fibers.

Figure 9. Pore size distribution for the SiC sample.
```latex
F(R_∞ )=\frac{K}{S}=\frac{(1-R_∞ )^2}{2R_∞}
```
```latex
K=2α=SF(R_∞)
```
```latex
(αhν)^{1/n}=A(hυ-E_g)
```
```latex
(F(R_∞)hν)^{1/n}=A(hυ-E_g)
```
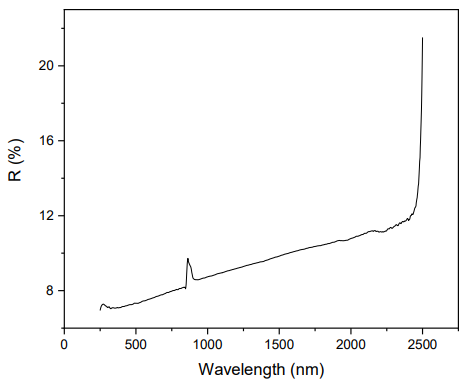

Figure 11. (F(R∞)hν)1/n as function of hv for (a) n = 2, (b) n = 3/2, (c) n = 3 and (d) n = 1/2.

Figure 12. Adsorption of MB on SiC in dark conditions.

Figure 13. Percentage of dye retained on the SiC.

Figure 14. Adsorption capacity of the SiC.
```latex
\frac{\mathrm{d}q_t}{\mathrm{d}t}=k_1 (q_e-q_t)
```
```latex
\ln(q_e-q_t)=\ln(q_e)-\frac{k_1}{2.303}t
```
```latex
\frac{\mathrm{d}q_t}{\mathrm{d}t}=k_2(q_e-q_t)^2
```
```latex
\frac{1}{(q_e-q_t)}=\frac{1}{q_e} +k_2 t
```
```latex
q_t=\frac{1}{\frac{1}{k_2 q_e^2}+\frac{1}{q_e}}
```
```latex
\frac{1}{q_t}=\frac{1}{k_2 q_e^2}+\frac{1}{q_e}
```

Figure 15. Linear plot of PFO kinetic model for the SiC sample.

Figure 16. Linear plot of PSO kinetic model for the SiC sample.
In Figure 17, Comparing the dark conditions with the irradiation process, the MB blank had a degradation of 4% in the dark, and after irradiation it reached 25%. Thus, 21% of MB was degraded with the artificial daylight. On the other hand, the SiC adsorbed 78% of MB in the dark, mainly in the first 4 hours, and after a plateau of ~20 h, the MB concentration further decreased by 16% when irradiated, reaching a total MB degradation of 94%. However, when the material is reused, the photocatalytic effect is more noticeable since there was a MB adsorption in the dark of 72%, and a MB concentration further decreased by 25% upon irradiation, rising the degraded fraction of MB up to 97%. When observing the behavior of the degradation under artificial daylight, it could be concluded that the light enhances the degradation of the dye, and the total degradation reached after irradiation for the 1st and 2nd uses of the foam is relatively similar. Thus, it could be inferred that the material could be reused without significantly losing the adsorbing property and the photocatalytic effect.

4. Conclusions
PAN fibers were used as a template for the synthesis of SiC to obtain SiC fibers with a high carbon content. The synthesized material exhibited nanopores and an SSA of 19 m2/g and a bandgap of 2.65 eV, which enabled this material to adsorb methylene blue in dark conditions and to photodegrade this dye in the presence of visible light.
The photocatalytic evaluation demonstrated that this material was able to almost completely degrade the methylene blue in water under artificial daylight during 7 h of irradiation. Besides, the photocatalyst could be reused without losing the photocatalytic properties and being able to degrade the dye at almost the same percentage.
Compared to the performances attributed to SiC foams in a previous study [11] under visible light, we can observe that the SiC-based fibrous material presented in this article surpasses the results obtained with the foam both in terms of pure photocatalytic performance and in terms of mechanical resistance of the material itself. The fibrous SiC material showed no signs of deterioration after the two usage cycles, while the SiC foam was found to be brittle and exhibited an increased adsorption capacity related to its larger specific surface area associated with its partial splitting.
These promising results open the way to the realization of robust materials with tunable shape that could efficiently degrade organic pollutants using artificial daylight.
Supplementary Materials
The following supporting information can be found at: https://www.sciepublish.com/article/pii/76.
Acknowledgments
The authors acknowledge M.D. and A.J. for fruitful scientific discussion. B.R. and D.C. are thanked for their help on electron microscopy. C.E. from Promes laboratory is also thanked for optical bandgap characterization measurements. The authors also acknowledge the CONACY (Mexico) for the funding of the PhD thesis of Karla Begonia Cervantes Diaz.
Author Contributions
Conceptualization, K.B.C.-D. and J.C.; Methodology, K.B.C.-D. and J.C.; Formal Analysis, K.B.C.-D.; Investigation, K.B.C.-D.; Writing—Original Draft Preparation, K.B.C.-D.; Writing—Review & Editing, K.B.C.-D. and J.C.; Supervision, J.C.; Project Administration, J.C.; Funding Acquisition, K.B.C.-D. and J.C.
Funding
This research was funded by CONACYT Mexico, grant number PhD-KBCD2019.
Declaration of Competing Interest
The authors declare that they have no known competing financial interests or personal relationships that could have appeared to influence the work reported in this paper.
References
1.
Sagasta JM. Chapter 3. Agricultural pollution sources and pathways. In More People, More Food, Worse Water?—A Global Review Water Pollution from Agriculture; The Food and Agriculture Organization of the United Nations: Rome, Italy, 2018; pp. 41–52.
2.
Inyinbor Adejumoke A, Adebesin Babatunde O, Oluyori Abimbola P, Adelani-Akande Tabitha A, Dada Adewumi O, Oreofe Toyin A. Water Pollution: Effects, Prevention, and Climatic Impact. In Water Challenges of an Urbanizing World; IntechOpen: London, UK, 2018, pp. 33–53.
3.
Lellis B, Fávaro-Polonio CZ, Pamphile JA, Polonio JC. Effects of textile dyes on health and the environment and bioremediation potential of living organisms. Biotechnol. Res. Innov. 2019, 3, 275–290. [Google Scholar]
4.
Houas A, Lachheb H, Ksibi M, Elaloui E, Guillard C, Herrmann JM. Photocatalytic degradation pathway of methylene blue in water. Appl. Catal. B Environ. 2001, 31, 145–157. [Google Scholar]
5.
Herrmann J-M. Water Treatment by Heterogeneous Photocatalysis. In Environmental Catalysis; World Scientific: Singapore, 1999, pp. 171–194.
6.
Umar M, Abdul H. Photocatalytic Degradation of Organic Pollutants in Water. In Organic Pollutants - Monitoring, Risk and Treatment; IntechOpen: London, UK; 2013, pp. 137–144.
7.
Xu C, Rangaiah GP, Zhao XS. Photocatalytic degradation of methylene blue by titanium dioxide: Experimental and modeling study. Ind. Eng. Chem. Res. 2014, 53, 14641–14649. [Google Scholar]
8.
Dette C, Pérez-Osorio MA, Kley CS, Punke P, Patrick CE, Jacobson P, et al. TiO2 anatase with a bandgap in the visible region. Nano Lett. 2014, 14, 6533–6538. [Google Scholar]
9.
Adhikari S, Eswar NKR, Sangita S, Sarkar D, Madras G. Investigation of nano Ag-decorated SiC particles for photoelectrocatalytic dye degradation and bacterial inactivation. J. Photochem. Photobiol. A Chem. 2018, 357, 118–131. [Google Scholar]
10.
Ouyang H, Huang J, Zeng X, Cao L, Li C, Xiong X, et al. Visible-light photocatalytic activity of SiC hollow spheres prepared by a vapor-solid reaction of carbon spheres and silicon monoxide. Ceram. Int. 2014, 40, 2619–2625. [Google Scholar]
11.
Cervantes-Diaz KB, Drobek M, Julbe A, Cambedouzou J. SiC Foams for the Photocatalytic Degradation of Methylene Blue under Visible Light Irradiation. Materials 2023, 16, 1328. [Google Scholar]
12.
Carvalho LE, Florian M, Cairo CAA, De Graça MLA. Precursor influence on the obtention of β-SiC hollow fibers. Mater. Sci. Forum 2008, 591–593, 578–582
13.
Al-Ajrash SMN. Lafdi K. Hybrid carbon nano-fibers with improved oxidation resistance. Ceramics 2019, 2, 25–33. [Google Scholar]
14.
Ye H, Titchenal N, Gogotsi Y, Ko F. SiC Nanowires Synthesized from Electrospun Nanofiber Templates. Adv. Mater. 2005, 17, 1531–1535. [Google Scholar]
15.
Chen J, Wu R, Yang G, Pan Y, Lin J, Wu L, et al. Synthesis and photoluminescence of needle-shaped 3C-SiC nanowires on the substrate of PAN carbon fiber. J. Alloys Compd. 2008, 456, 320–323. [Google Scholar]
16.
Nardin T, Gouze B, Cambedouzou J, Diat O. Soft templated mesoporous SiC from polycarbosilane grafted onto triblock copolymers. Mater. Lett. 2016, 185, 424–427. [Google Scholar]
17.
Andronic L, Isac L, Cazan C, Enesca A. Simultaneous Adsorption and Photocatalysis Processes Based on Ternary TiO2–CuxS–Fly Ash Hetero-Structures. Appl. Sci. 2020, 10, 8070. [Google Scholar]
18.
Baldez EE, Robaina NF, Cassella RJ. Employment of polyurethane foam for the adsorption of Methylene Blue in aqueous medium. J. Hazard. Mater. 2008, 159, 580–586. [Google Scholar]
19.
Soltani N, Saion E, Mahmood Mat Yunus W, Navasery M, Bahmanrokh G, Erfani M, et al. Photocatalytic degradation of methylene blue under visible light using PVP-capped ZnS and CdS nanoparticles. Sol. Energy 2013, 97, 147–154. [Google Scholar]
20.
Iram M, Guo C. Guan Y, Ishfaq A, Liu H. Adsorption and magnetic removal of neutral red dye from aqueous solution using Fe3O4 hollow nanospheres. J. Hazard. Mater. 2010, 181, 1039–1050. [Google Scholar]
21.
Rahaman MSA, Ismail AF, Mustafa A. A review of heat treatment on polyacrylonitrile fiber. Polym. Degrad. Stab. 2007, 92, 1421–1432. [Google Scholar]
22.
Laine R, Babonneau F. Preceramic polymer routes to silicon carbide. Chem. Mater. 1993, 5, 260–279. [Google Scholar]
23.
Gouze B, Cervantes-Diaz KB, Nardin T, Diat O, Cambedouzou J. Highly crystalline silicon carbide of controlled mesoporosity. Mater. Chem. Phys. 2020, 250, 123208. [Google Scholar]
24.
Sing KSW. Reporting physisorption data for gas/solid systems with special reference to the determination of surface area and porosity (Recommendations 1984). Pure Appl. Chem. 1985, 57, 603–619. [Google Scholar]
25.
Norouzzadeh P, Mabhouti K, Golzan MM, Naderali R. Investigation of structural, morphological and optical characteristics of Mn substituted Al-doped ZnO NPs: A Urbach energy and Kramers-Kronig study. Optik 2020, 204, 164227. [Google Scholar]
26.
Escobedo-Morales A, Ruiz-López II, de L. Ruiz-Peralta M, Tepech-Carrillo L, Sánchez-Cantú M, Moreno-Orea JE. Automated method for the determination of the band gap energy of pure and mixed powder samples using diffuse reflectance spectroscopy. Heliyon 2019, 5, E01505. [Google Scholar]
27.
Makuła P, Pacia M, Macyk W. How To Correctly Determine the Band Gap Energy of Modified Semiconductor Photocatalysts Based on UV-Vis Spectra. J. Phys. Chem. Lett. 2018, 9, 6814–6817. [Google Scholar]
28.
Revellame ED, Fortela DL, Sharp W, Hernandez R, Zappi ME. Adsorption kinetic modeling using pseudo-first order and pseudo-second order rate laws: A review. Clean. Eng. Technol. 2020, 1, 100032. [Google Scholar]
29.
Ho YS, McKay G. A Comparison of chemisorption kinetic models applied to pollutant removal on various sorbents. Process Saf. Environ. Prot. 1998, 76, 332–340. [Google Scholar]
30.
Fazal T, Razzaq A, Javed F, Hafeez A, Rashid N, Amjad US, et al. Integrating adsorption and photocatalysis: A cost effective strategy for textile wastewater treatment using hybrid biochar-TiO2 composite. J. Hazard. Mater. 2020, 390, 121623. [Google Scholar]
31.
Matos J, Ocares-Riquelme J, Poon PS, Montaña R, García X, Campos K, et al. C-doped anatase TiO2: Adsorption kinetics and photocatalytic degradation of methylene blue and phenol, and correlations with DFT estimations. J. Colloid Interface Sci. 2019, 547, 14–29. [Google Scholar]
32.
Brik A, Naama S, Hadjersi T, Benamar MEA, Bouanik S, Manseri A. Photodegradation of methylene blue under UV and visible light irradiation by Er2O3-coated silicon nanowires as photocatalyst. React. Kinet. Mech. Catal. 2020, 131, 525–536. [Google Scholar]
33.
Zhang J, Chen J, Xin L, Wang M. Hierarchical 3C-SiC nanowires as stable photocatalyst for organic dye degradation under visible light irradiation. Mater. Sci. Eng. B Solid-State Mater. Adv. Technol. 2014, 179, 6–11. [Google Scholar]