1. Introduction
The purpose of a traditional stormwater drainage system is to collect the runoff from the catchment after the rainfall event as completely as possible and thus contribute to minimizing the flooding risk. Rainwater tanks are ancient practices for stormwater harvesting and reuse. The impacts of rainwater tanks on drainage system to minimise the flooding risks are presented in this article. Urban development implies changing existent surfaces on the land from being pervious to impervious. According to the World Bank [
1], 56% of the world’s population lives in cities, and these numbers are expected to be 68% by 2050. These continuous changes may result in an increase of floods and droughts around the world [
2]. Therefore, the term “urban hydrology” has appeared in literature as a discipline aiming to understand changes and impacts of hydrological processes on urban catchments [
3].
The concept of Water Sensitive Urban Design (WSUD) arose in Australia in the 1990s. The Government of South Australia defined it as “an approach to urban planning and design that integrates the management of the total water cycle into the urban development process” [
4]. Coombes et al. [
5] described this concept as a local solution to global water resources management problems in cities. WSUD goals can be achieved with the use of a range of systems that can be divided into infiltration systems (e.g., leaky wells, soakaways, infiltration trenches) and non-infiltration systems (e.g., rainwater tanks—RWT). RWT is a useful technology for rainwater harvesting (RWH) (
i.e., capturing and reusing water), which is designed to collect rainwater from roofs and store it for domestic, industrial, or commercial uses. Many authors have reported benefits both in water supply savings and runoff reduction after including RWTs in the sustainable drainage systems (SDS) [
2,
6,
7,
8,
9]. Nevertheless, many studies combine the uses of RWT with other WSUD technologies and few focus only on RWTs [
10].
Moreover, the use of projected rainfall data is claimed by many authors to be scarce or inexistent in design procedures [
9,
11]. Also, several studies have been found examining the impacts of climate change (CC) on water supply savings benefits [
12,
13,
14], but only a few were found focused on the impact on runoff reduction benefits [
9,
15]. CSIRO [
16] points out that while decreases in winter and spring rainfall are projected, an increment intensity of extreme rainfall events is also projected, both with high confidence, in the southern and south-western flatlands regions. Thus, benefits in runoff reduction may be affected by future rainfall conditions in the greater Adelaide area.
The authors believe that the performance impact of RWTs for stormwater drainage systems in the Australian context is a knowledge gap. Though the separate benefits of RWTs and drainage systems are well understood in the literature, the study on combined benefits in the Australian context is very rare. The aim of this research is to conduct a performance analysis before and after including RWTs in the SDS to investigate its impacts on runoff reduction. Further affectations produced by the effect of climate change are examined by projecting data under different scenarios.
2. Literature Review
The literature review investigates key aspects of RWH systems in the context of flood management. An exploration in diverse topics, such as the effectiveness of RWTs in reducing runoff, optimal tank sizing, uses of harvested water, and affectations on the system due to the use of projected rainfall, is presented.
2.1. Effectiveness of RWTs in Runoff Reduction
Runoff reduction after the implementation of RWTs on an SDS has been explored by many authors in rural and urban catchments. Studies have been found in different cities across the world. Zhang et al. [
17] reported RWTs to be particularly effective in runoff reduction, showing a maximum reduction of 48.1% after modelling a rural residential development in Western Australia. Similarly, research conducted in South Korea found a reduction from 42 to 32 tons for a storm of 0.8 cumulative probability after testing a new model for RWH that included the use of an RWT [
2]. Other studies have concluded 1% to 17% reduction in runoff in seven different regions across the USA [
8], and reduction from 2.7% to 14.3% in peak flow was found in the city of Joinville, Brazil [
6]. Campisano and Modica [
18] found greater reduction values, ranging from 30% to 68% in more than half of the studied events in Italy. These reduction values can be observed in different features, such as runoff volume and peak flow.
Results found in these studies show some variability. Some authors have concluded that the efficiency of RWH systems is controlled by different variables such as tank capacity, water demand patterns, precipitation, rainfall patterns, and others [
6,
8,
18]. Steffen et al. [
8] stated an inverse relation between precipitation and runoff reduction (
i.e., with lower precipitation, higher reduction values) and emphasized that cities located in semiarid regions with less than 762 mm annual precipitation have a higher potential to manage stormwater with RWH systems.
Nevertheless, to some extent, runoff reduction by WSUD technologies (
i.e., RWTs) has shown some limitations depending on rainfall duration and intensity. An investigation conducted in the greater Tokyo area found that while RWTs had a significant impact on reducing runoff produced by short-term rainfall events, little impact under long-term events was observed [
7]. Likewise, Qin, Lin, and Fu [
19] reached similar conclusions while studying other WSUD alternatives (e.g., swales, permeable pavement, green roofs). Rainfall temporal patterns affect the effectiveness of these technologies and some authors have found this effectiveness to be decreased if higher rainfall intensities occur later in the storm [
19,
20].
2.2. Optimal Tank Sizing
The optimal tank size depends on the objective of the system. Many existing RWH systems are focused only on the objective of water-saving benefits, without considering other potential benefits [
18]. Water supply savings and stormwater management are not necessarily competing objectives, but different sizes are required for the optimization of the benefits for each objective [
21]. Generally, stormwater management benefits require a larger size to achieve their optimal levels [
21]. Also, relying on historical data may not provide an accurate sizing of RWTs under future rainfall conditions [
9].
Other issues can be a consequence of inadequate RWT sizing. While under sizing may result in an unreliable water supply, risks caused by oversizing include increased costs and water quality risks. A systematic literature review performed by Semaan et al. [
22] found that the most optimized variable was the cost of the system, followed by reliability, effectiveness, and meeting water demands.
2.3. Uses of Harvested Water
RWH may be used for potable or non-potable purposes (e.g., gardening, toilet flushing, washing machines, and others) [
23]. Some challenges in the quality of RWH have been identified in the literature. Many studies have identified one of the main concerns as elevated metal concentrations, particularly lead [
24]. Lead levels in RWH were found to be exceeding drinking water guidelines in Australian capital cities in an average of 22% of the tanks studied [
24]. The microbiological quality of RWH also presents some health risks.
E. coli is constantly found in the literature as the most common microbiological problem in RWH, and drinking water quality guidelines are often not met [
25]. Nevertheless, health risks are lower for non-potable uses than for potable purposes [
26]. Water reuse shows a high potential in water savings, although in many cases water should be properly treated to avoid the spread of diseases [
27]. Benefits in runoff reduction can also be obtained, but these risks RWH need to be mitigated to ensure a safe use of harvested water and keep RWTs with available storage capacity.
2.4. Effects of Climate Change
The effect of climate change (CC) on WSUD technologies and particularly RWT has emerged in literature. Some authors [
9,
11] have claimed that the use of projected rainfall data is scarce or inexistent, and design approaches are based solely on historical data. The non-consideration of CC effects may lead to a recurrent failure of existing WSUD infrastructure in the future. In fact, some studies have used projected rainfall data to evaluate the performance of WSUD schemes. In Australia, performance of RWTs is more likely to be affected. Reductions in water savings are constantly found in the literature for different Australian cities [
12,
28,
29]. However, research conducted in Portugal showed opposite results. Santos et al. [
11] found performance levels on RWH systems will be sustained and even show small increases. The contrast between results found in Portugal and Australia suggests that CC effects may be different for each location. Moreover, although many studies have been found addressing affectations in water savings [
12,
13,
14], studies focusing on runoff reductions are scarce. A case study in Brazil suggested that runoff reduction obtained with the use of RWTs will be negatively impacted due to CC, although this runoff reduction is decreased in less than 5% [
15]. Studies conducted in China by Zhang et al. [
9] also concluded a reduction in the fraction of stormwater captured by an RWH system in all studied cities. As rainfall patterns are changing due to CC, events with longer durations [
7], as well as higher intensities later in the storm [
19,
20] may reduce runoff reduction performance. More research is required to evaluate how this performance will be affected in the future due to CC, using different models and scenarios.
2.5. Summary of Literature Review
Different aspects of RWH systems are examined within the context of runoff management. The use of RWTs is found to be effective in reducing runoff in a wide variety of studies conducted globally. Reductions in runoff vary from 1% to 68%. Their efficiency varies due to different factors like tank capacity, water demand patterns, precipitation, and rainfall intensity. Limitations during long-term rainfall events were found. The optimal sizing of RWTs is a challenge. Both undersizing and oversizing can lead to issues. The most commonly optimized variable is the cost of the system. While different sizes may be required to achieve the maximum level of benefits for each aspect, water savings and stormwater management are not competing objectives. Harvested water is found to be used for different purposes. There are some concerns about the quality of harvested water, particularly the presence of lead and microbiological issues with
E. coli contamination. In addition, the impact of CC on WSUD technologies and RWT is a topic of global concern. While some studies predict reduced water savings, others have found this level to remain stable or even improve. Many studies focus on the effects on water savings, but few aim to understand the effects on stormwater management. However, further research is needed to study the effects of CC on these systems when the focus is to reduce runoff.
3. Materials and Methods
3.1. Study Area
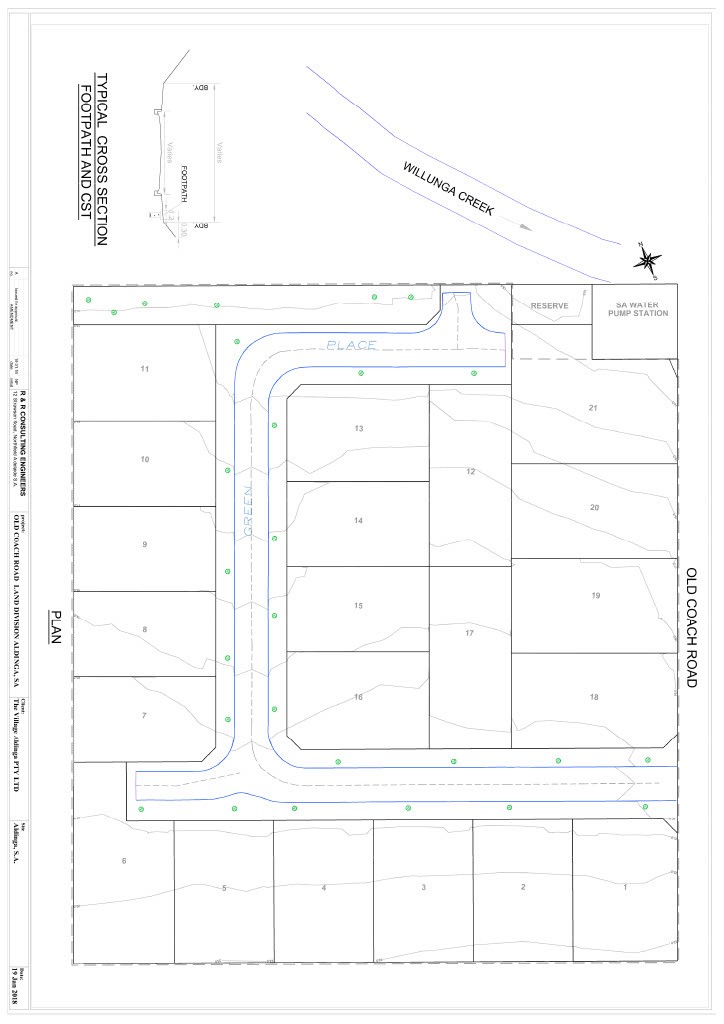
The study area, Village Green, is a residential development located in Aldinga, South Australia (Figure A1). This area is located west of the southernmost part of the Adelaide Hills. Terrain is mostly flat, with mild slopes. The study area contains 21 allotments of various sizes. Hot, dry summers and wet, cold winters describe the climate of this region.
3.2. Methodology
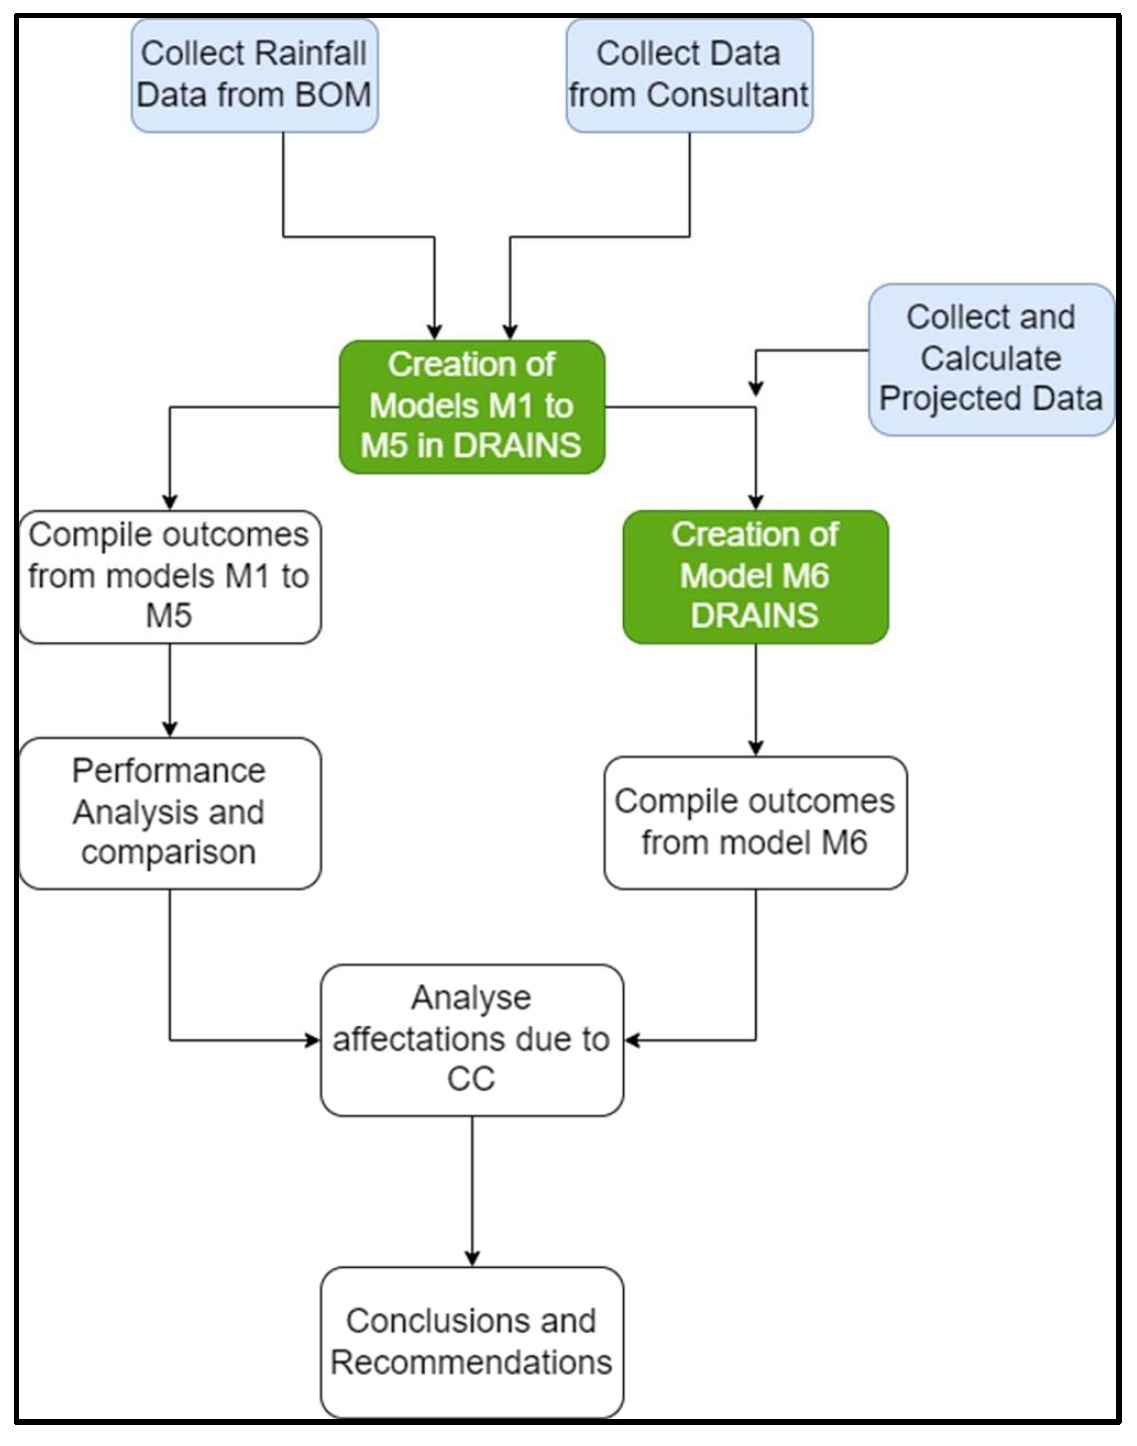
Research methodology, including data collection, modelling approaches, and outputs collection, and comparison is described in this section. A flowchart is presented in .
. Flowchart of research methodology (BOM = Bureau of Meteorology, CC = Climate Change and M1–M6 = Models of different scenarios).
3.2.1. Data Collection
Rainfall intensities are collected from the Australian Bureau of Meteorology. The creation of a model in the DRAINS model requires initial data for 50% and 2% annual exceedence probabilities (AEPs), for durations of 1, 12 and 72 h. These values are shown in Table A1. A plan with allotment division and contours was provided by a consulting company (Figure A1) along with a CAD file. Finally, other required assumptions are made following the City Council’s guidelines.
3.2.2. Model and Simulation
The modelling and simulation of the SDS is performed using the DRAINS model. An ILSAX type hydrological model is used in this research, with the assumption of the following parameters, following the City Council Guidelines [
29].
- Depression storage: Paved = 1 mm; Grassed = 5 mm. The supplementary area is not considered in this research; therefore, Supplementary = 0.
- Soil type = 3 (as per the DRAINS model, 1 = sandy soil, 2 = sandy clay, 3 = medium clay, and 4 = heavy clay).
- Kinematic wave equation was used.
DRAINS is an Australian model for designing the drainage systems. This model allows you to draw pipes, pits, overflow routes, sub-catchments, nodes
etc., for a drainage network using a CAD file. Hydrological, rainfall data, and ctachment data are required to be input in the model. Thereafter, the model is required to run under major and minor rainfall events. The model then gives an idea whether there is any probability of flooding of the catchment; few trials and errors in terms of drawing and data input are needed to get the optimum results from the model. This model can also draw a long section showing the hydraulic grade line, pipe size, slope, invert level of pipe
etc.
3.2.3. Rainfall Data
Two storm events (e.g., major and minor) were considered. According to the City of Onkaparinga [
30], major and minor storm AEPs are considered as 1% and 20%, respectively. Storm duration is chosen to be 30 minutes. The “Zone 6—S.A. Gulf” is selected as the rainfall zone. Only one rainfall temporal pattern is followed, given by the rainfall zone selected.
Layout of Conventional SDS
This section describes the development of the first model, model M1, a conventional layout (
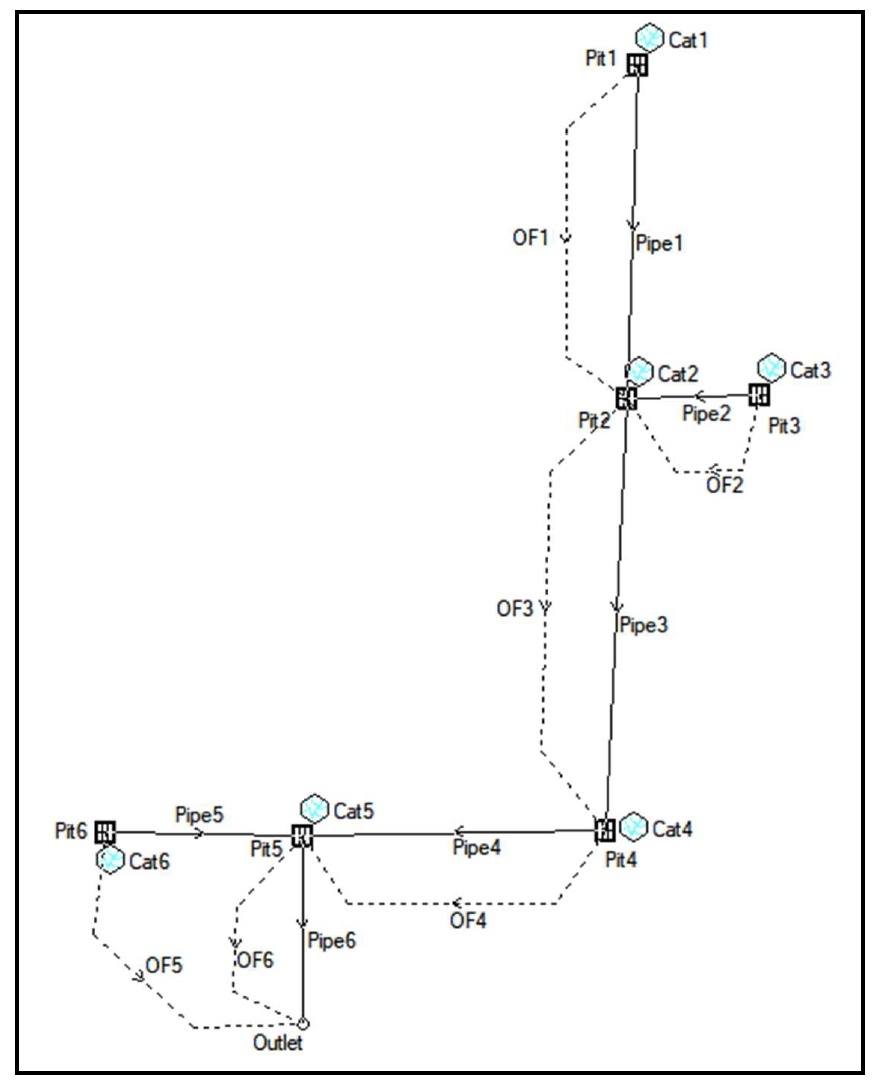
i.e., without RWTs) for a SDS. The layout of a drainage network in DRAINS includes elements such as sub-catchments, pits, pipes, and overflow routes. illustrates the layout defined for this study. Each one of these elements requires a specific set of parameters, obtained according to the site characteristics and the SDS.
. Layout of drainage system of the study area using DRAINS model.
Sub-Catchments
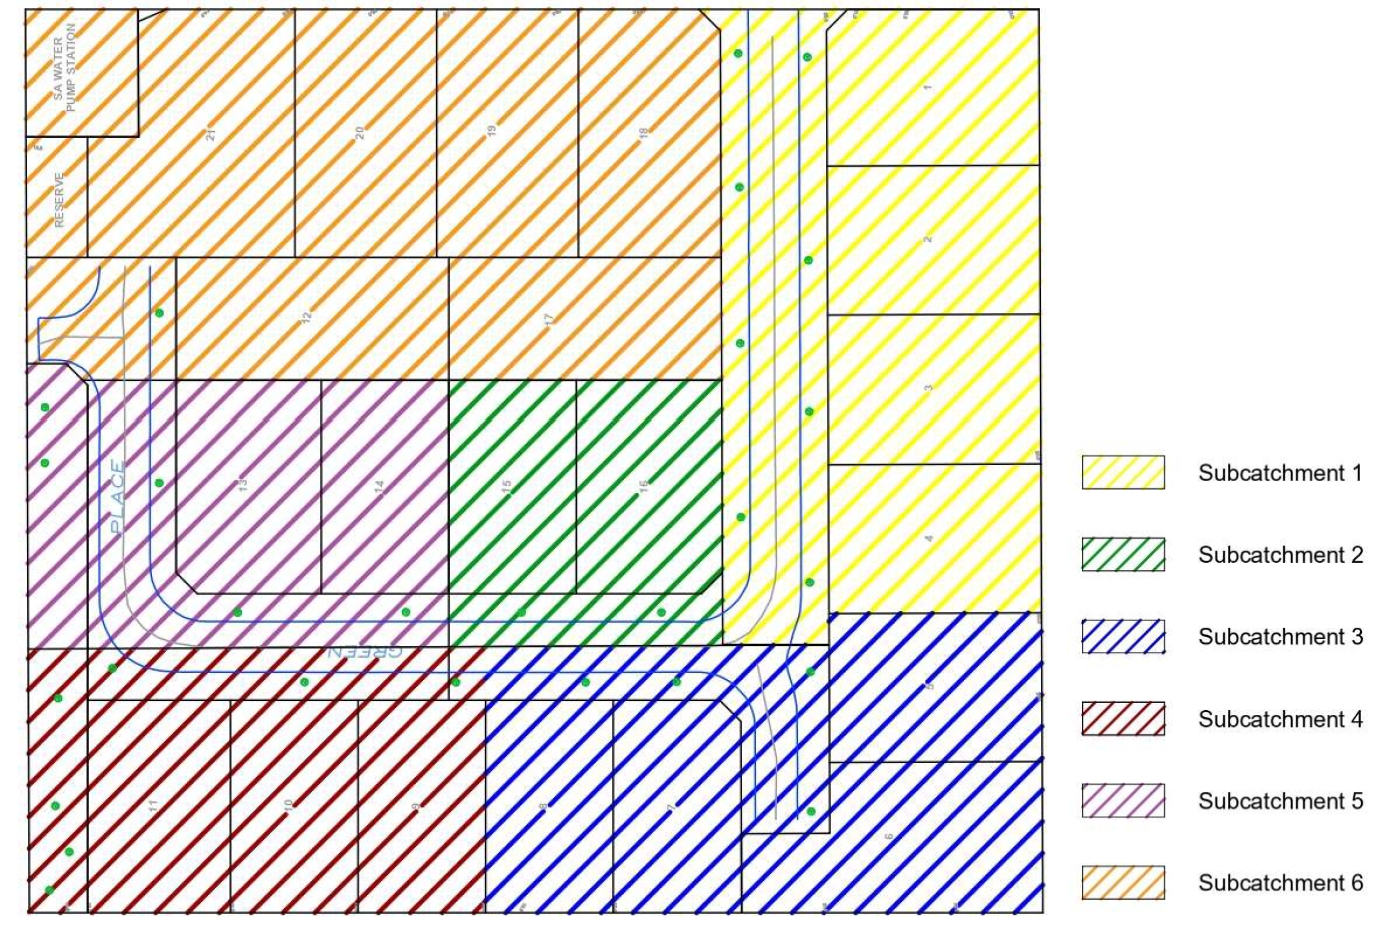
Six sub-catchments are defined based on the contribution of stormwater runoff in the pit, as shown in . The modelling of sub-catchments requires the definition of parameters such as sub-catchment area, percentage of paved and grassed area, and the time of concentration for each area type. Paved area consists of the sum of road area and roof area within each sub-catchment. Paved and roof areas are assumed as 75% of the allotment size as suggested by the City Council [
30]. Grassed area is the remaining surface of each sub-catchment, as supplementary area is not considered for this research. Sub-catchment areas, and the proportion of each type of area are measured from the CAD file provided by the consultant.
. Sub-catchments of the study area.
Pits
The modelling of each pit requires the definition of some parameters, such as surface elevation, pit type, family, size, pressure loss coefficient, and blocking factor. All pit types in this layout are defined as ‘on-grade’. Family and sizes are chosen from the DRAINS pits database for South Australia. Pressure loss coefficients are assigned following recommendations from the 2018 DRAINS user manual [
31].
Pipes
The parameters required for modeling the pipes include pipe type, diameter, length, upstream and downstream invert levels and slope. Pipe type is chosen from the DRAINS pipe database for South Australia. Slopes and invert levels are calculated following the site’s topography and a minimum cover of 600 mm above the top of the pipe.
Overflow (OF) Routes
Six OF routes were drawn in the model. These elements require parameters such as reach length, travel time, upstream and downstream invert levels, and cross-sectional shape. Reach lengths are considered as the same length of the pipe, as pipes go in straight lines underneath these routes. Similarly, ILs were taken as surface elevation at the beginning and the end of each OF route.
Layout of Hybrid SDS
Once the conventional SDS is modelled, the next step is to develop the model of a hybrid (
i.e., with RWTs) SDS. The presence of RWTs in the network is represented by a reduction in the sub-catchment areas. This means the roof surface connected to RWTs is reduced from the total sub-catchment area. The roof surface connected to RWTs will have no effect on the proportion of paved area either. In this case, paved area was defined only as the road area. Therefore, new sub-catchment areas, as well as new proportions of paved and grassed areas, are calculated. Four different models with 100%, 75%, 50%, and 25% roof areas connected to RWTs (
i.e., models M2, M3, M4, and M5, respectively) are created to analyze trends between these areas and different outcomes in the network. A summary of models is shown in .
.
Summary of models.
| Model Name |
Description |
| M1 |
Conventional SDS. No RWTs are included in the network. |
| M2 |
Hybrid SDS. 100% roof accepted runoff to RWTs. |
| M3 |
Hybrid SDS. 75% roof accepted runoff to RWTs. |
| M4 |
Hybrid SDS. 50% roof accepted runoff to RWTs. |
| M5 |
Hybrid SDS. 25% roof accepted runoff to RWTs. |
| M6 |
Hybrid SDS. 100% roof accepted runoff to RWTs. Storms with rainfall
intensities projected to 2030 and 2050 under RCP4.5 and RCP8.5 scenarios. |
Climate Change Projections
The model M6 is prepared for climate change (CC) projections. The wide variety of projections under different CC scenarios are narrowed to two RCP scenarios. This requires the adjustment of the rainfall intensity values obtained from historical data to projected rainfall intensities with the use of the following formula proposed by Ball et al. [
32]:
where
Icc = projected rainfall intensity;
IARR = rainfall intensity for current climate conditions;
Tm = expected mean change in temperature.
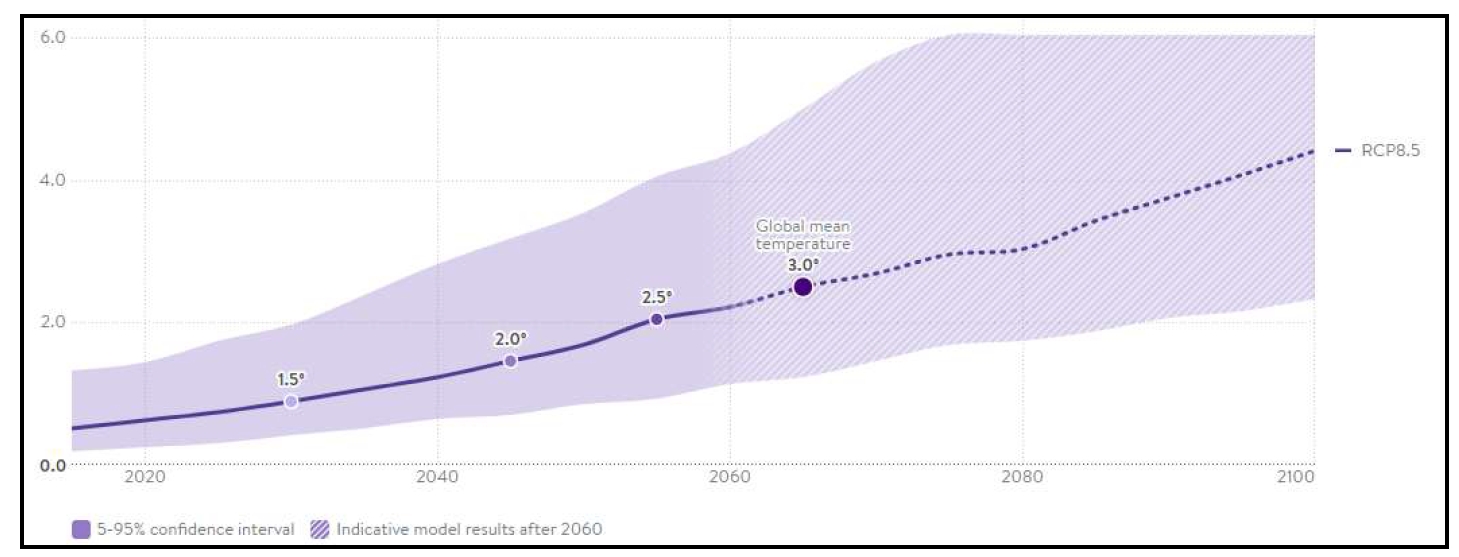
Expected changes in temperature are taken from projections made by Climate Analytics [
33]. This site provides graphics and tables for the projection of different weather parameters, including mean air temperature, under different representative concentration pathways (RCPs). As suggested by the Book 1 of the Australia Rainfall and Runoff (ARR) [
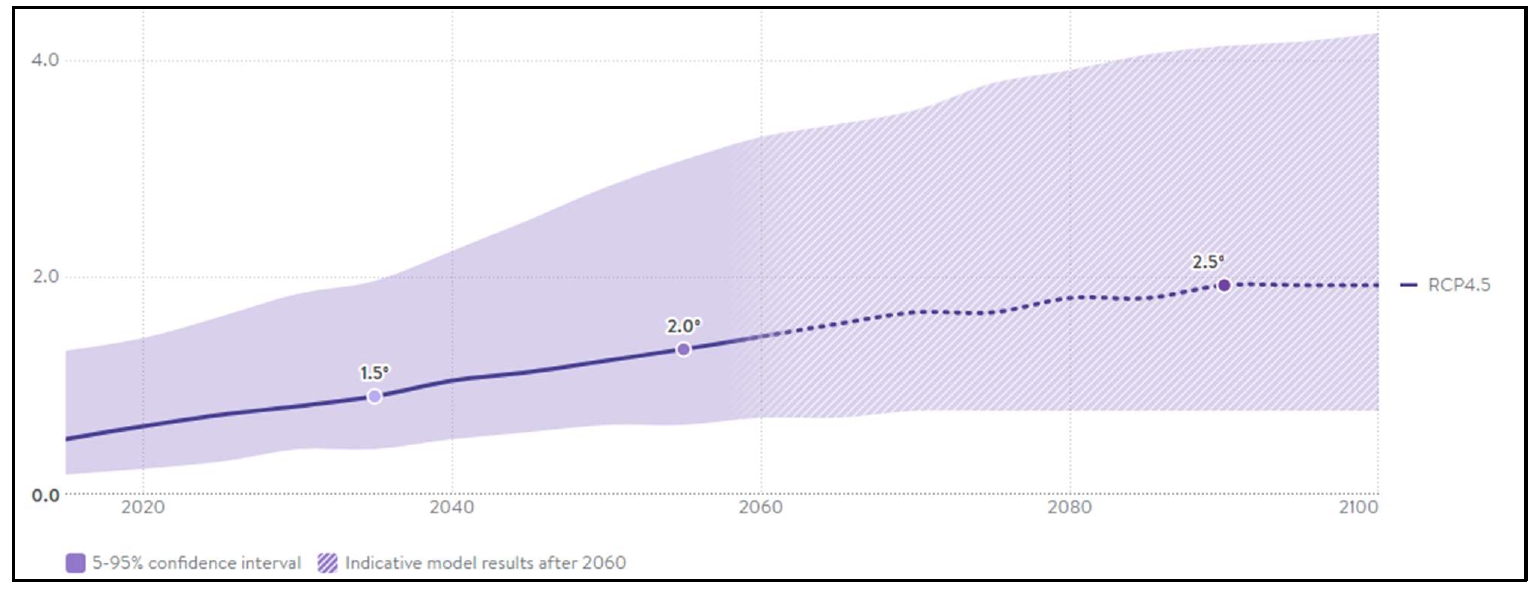
32], the minimum basis to consider CC projections and their consequences is the RCP4.5 concentration pathway, and the maximum case RCP8.5 should also be considered on socioeconomic and environmental grounds. Therefore, this research considers studies projections under RCP4.5 and RCP8.5 scenarios. and show projected changes in mean air temperature for South Australia, compared to the reference period 1986–2006. As rainfall intensities in this study are intended to be projected for the years 2030 (
i.e., near future) and 2050 (
i.e., mid-distant future), projections in changes in mean temperature for these years are required. Finally, projected rainfall intensities were obtained using Equation (1).
. Mean air temperature projection under RCP4.5 scenario [
33].
. Mean air temperature projection under RCP8.5 scenario [
33].
4. Results and Discussions
This section presents the results obtained after running all models created, as described in Section 3. Different features, such as long sections and hydraulic grade lines (HGL), peak flows, hydrographs, and runoff volume, are analyzed and discussed, focusing on the benefits obtained on each feature. Furthermore, projected data are used to study the possible effects of CC on these benefits.
Model M1 is deliberately developed to produce no error messages (
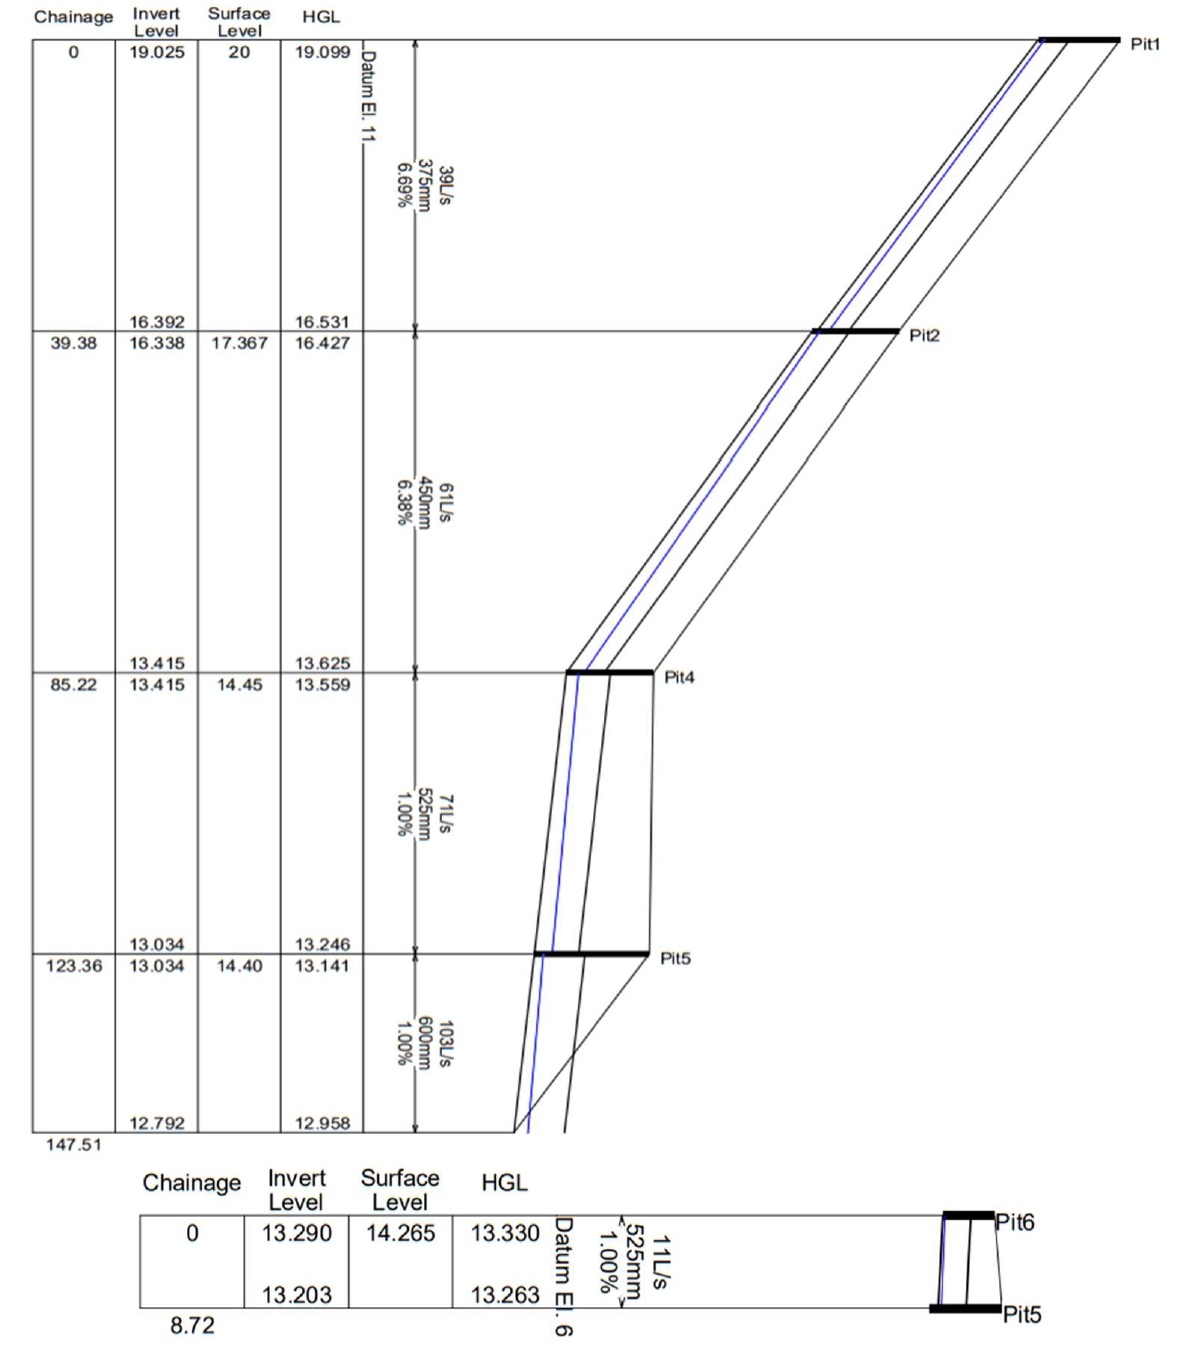
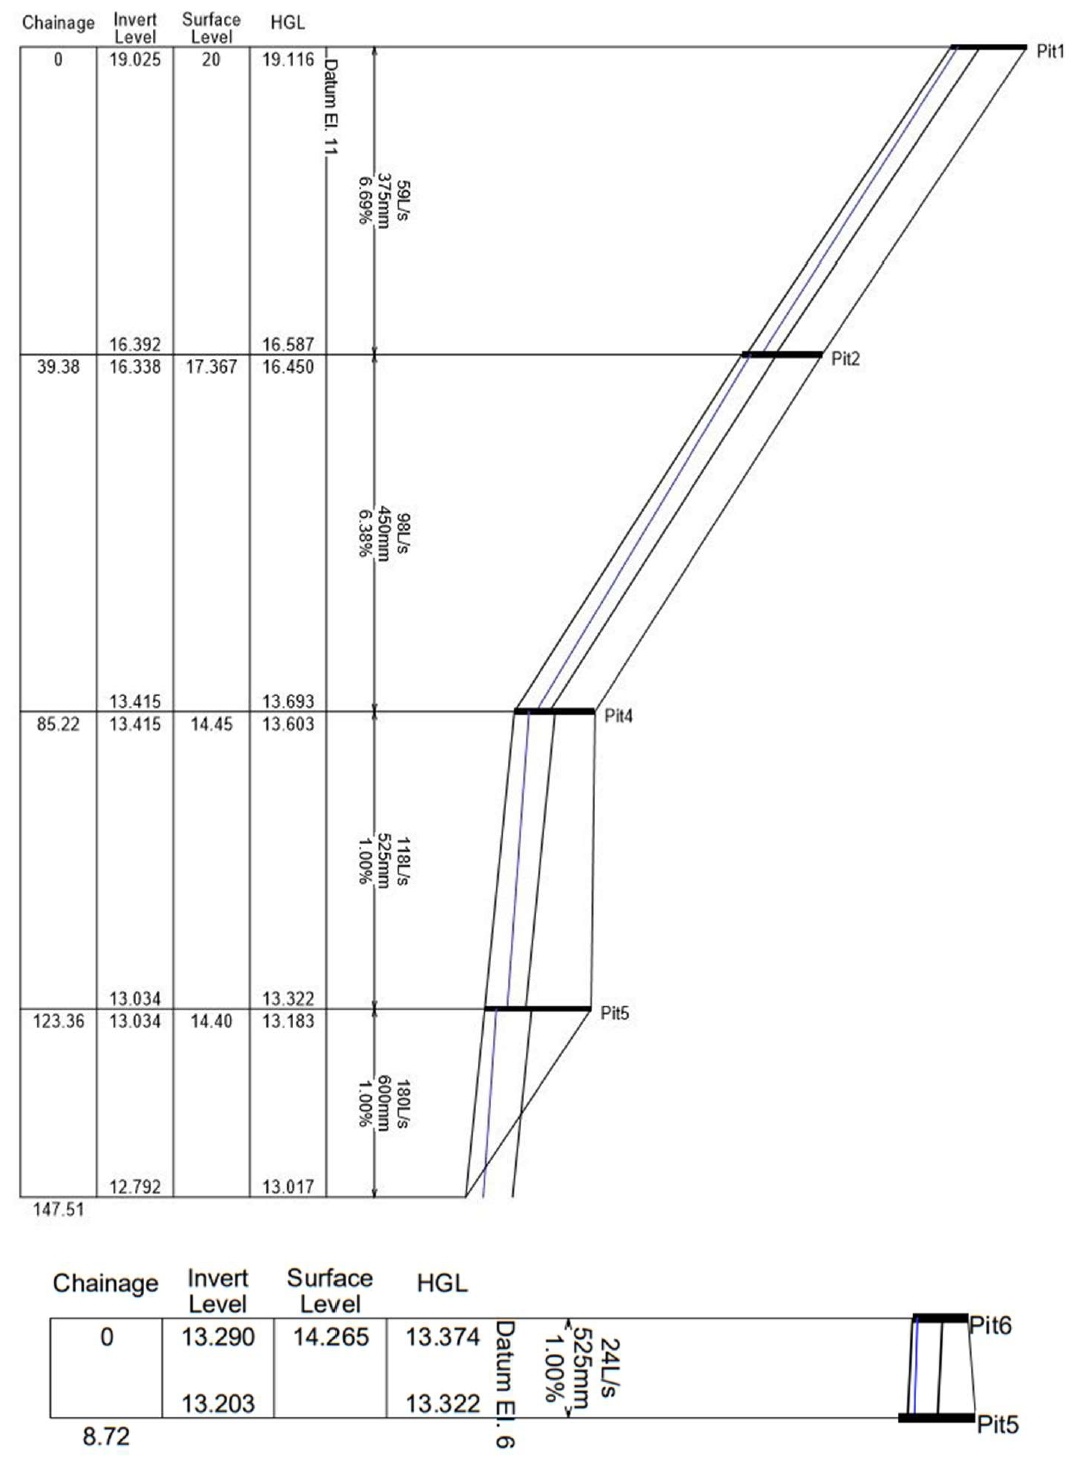
i.e., pits upwelling and freeboards < 0.15 m), allowing for a better understanding of the changes in peak flow and runoff volume within the SDS. Furthermore, all models convey the runoff produced by both minor and major events without upwellings or inadequate freeboards. The results state that the highest and lowest runoff are expected to occur in models M1 and M2, respectively. Figure A2 and Figure A3 present long sections with HGL. By observing these figures, the worst-case scenario can be identified as the model M1 under a major storm event. Even during the case, stormwater is always contained and flowing inside the network. Peak flows obtained from model M1 are the baseline values. Results of models M2 to M5 are compared to M1 results to obtain reduction values. Peak flow rates and reduction percentages can be found in Table A2, Table A3, Table A4 and Table A5 .
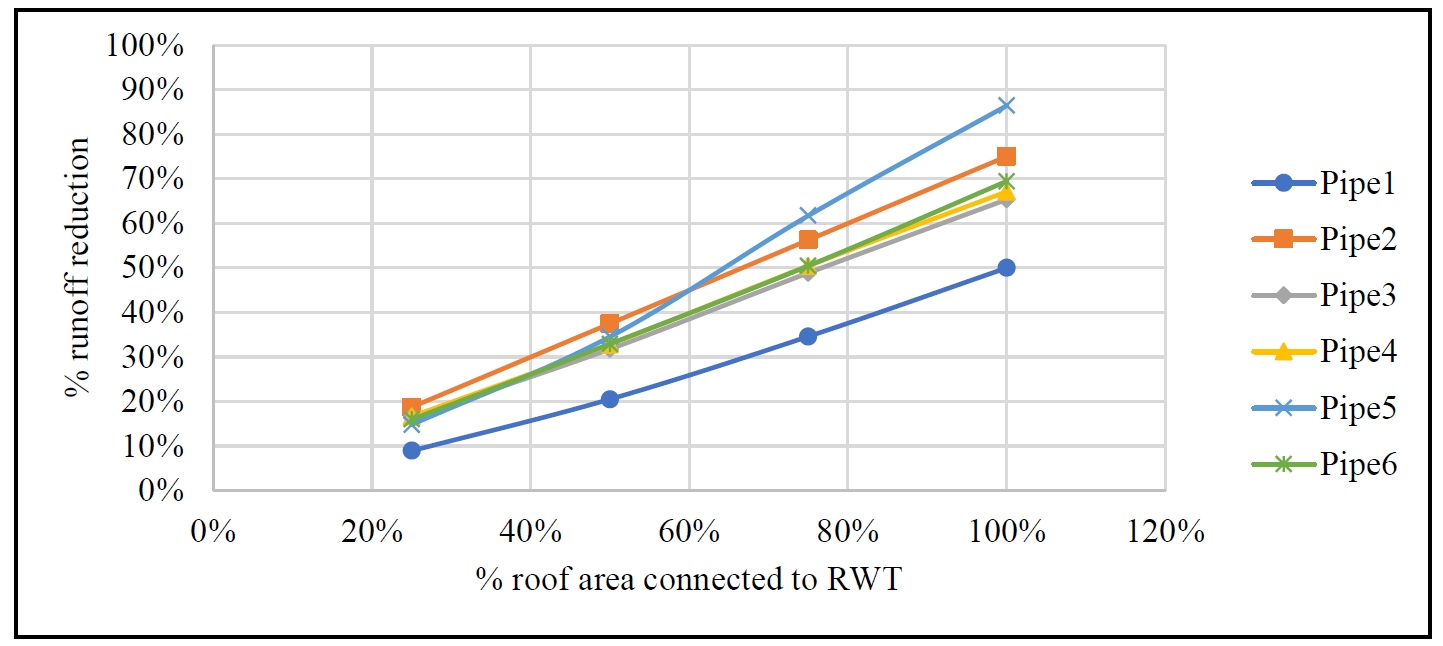
Reduction in peak flow (
i.e., peak flow benefits) was observed in all pipes under both minor and major storms. Under the minor storm, peak flow benefits obtained in pipes ranged from 9% to 17% when 25% of roof area is connected to RWTs (
i.e., model M5). These benefits increased to a range of 50% to 86% when 100% of roof area (
i.e., model M2) was connected ( and ). Benefits in model M5 obtained under the major storm event are found within the range of 9–14%, while in model M2 they are within the range of 41–77%.
Peak flow benefits tend to increase directly with the amount of roof area connected to RWTs. This means the higher the surface of the roof connected to RWTs, the higher the benefits obtained in peak flows. Although all pipes show a correlation between runoff reduction and roof area connected to RWTs, not all follow the same behaviour. In fact, the trend followed by pipe 5 is different from the others. Several factors can be affecting this benefit trend in this pipe. Firstly, this pipe carries the flow produced by the largest sub-catchment area. Also, this pipe is connected to the network at the last node before the outlet and only conveys runoff produced by its own sub-catchment. On the other hand, pipes 1 to 4 are connected in a series (
i.e., one following the other). This means these pipes, except for pipe 1, are collecting runoff from their own sub-catchment while adding the runoff conveyed by the previous pipe. This difference in trend is enhanced under the major storm event, as clearly seen in and .
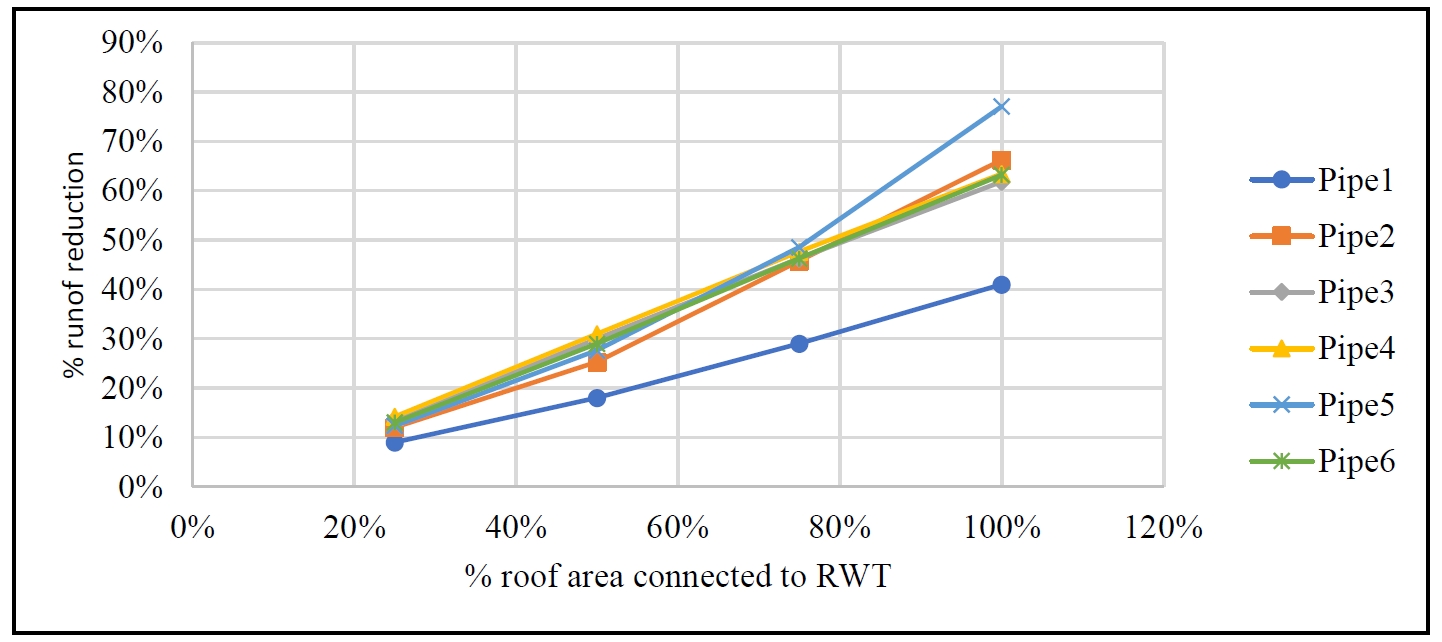
Moreover, peak flow benefits are different under minor and major storm events. Benefits under minor storms are found to be higher to those under major storms. For instance, reductions in model M2 decrease from 50–86% under minor storms to 41–77% under major storms. Similarly, reductions in model M5 are within the range of 9–17% under minor storms and slightly decrease to a range of 9–14% under major storms. Models M3 and M4 also show the same tendency when benefits from minor and major storms are compared. This trend follows a similar behaviour to the one proposed by Steffen et al. [
8] where higher reduction values are observed for lower precipitation values, following an inverse relationship. Maximum benefits were obtained in model M2 under the minor storm event. Nevertheless, as stated before, only two different AEPs and one storm duration were considered for this study. Further studies can address this issue by considering different AEPs and different storm durations. There is undoubtedly a reduction in peak flow when RWTs are introduced in the SDS. The reduction percentage increases with the amount of roof area connected to RWTs in the catchment, and its trend seems to be affected by sub-catchment size and network layout. Benefits also increase when the AEP is lower (
i.e., minor storm event).
. Runoff reduction in pipes under a minor storm event with different roof areas connected to RWTs.
. Runoff reduction of pipes under a major storm event with different roof areas connected to RWTs.
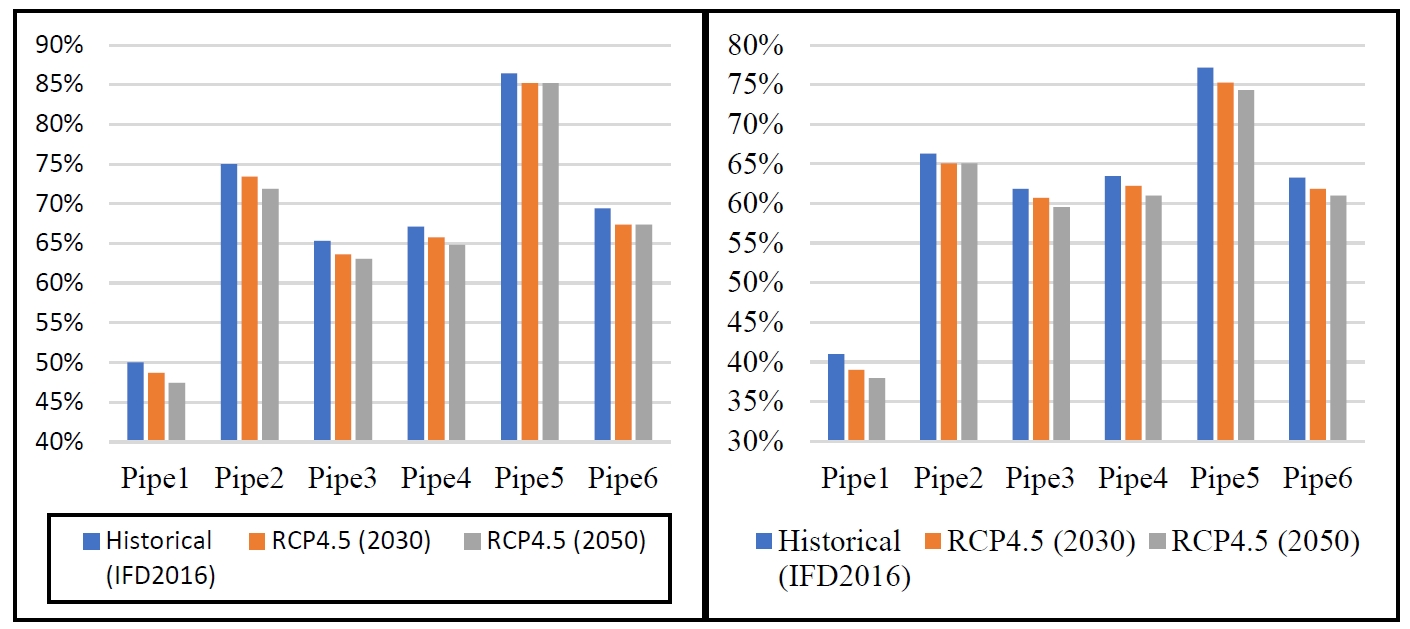
Peak flows under different CC scenarios are collected from model M6, and reduction percentages from the peak flows in model M1 are calculated. These peak flow benefits are compared to those in model M2 to assess the impact of CC under several scenarios. Peak flow benefits from model M2 decrease under both RCP scenarios. Firstly, under RCP4.5 these values drop an average of 1.5% for the year 2030 and 2% in the year 2050 for both minor and major storms. Peak flow benefits under RCP8.5 show higher decrease levels ( and ). Reduction values drop an average of 1.6% and 2% for the year 2030, under minor and major storms, respectively, and an average of 3% for the year 2050. To some extent, peak flow benefits obtained with the use of RWTs being decreased by 2% or 3% do not represent a significant impact in the SDS.
. Peak flow reductions in pipes following RCP4.5 projections (<b>left</b>—minor storms and <b>right</b>—major storms).
. Peak flow reductions in pipes following RCP8.5 projections (<b>left</b>—minor storms and <b>right</b>—major storms).
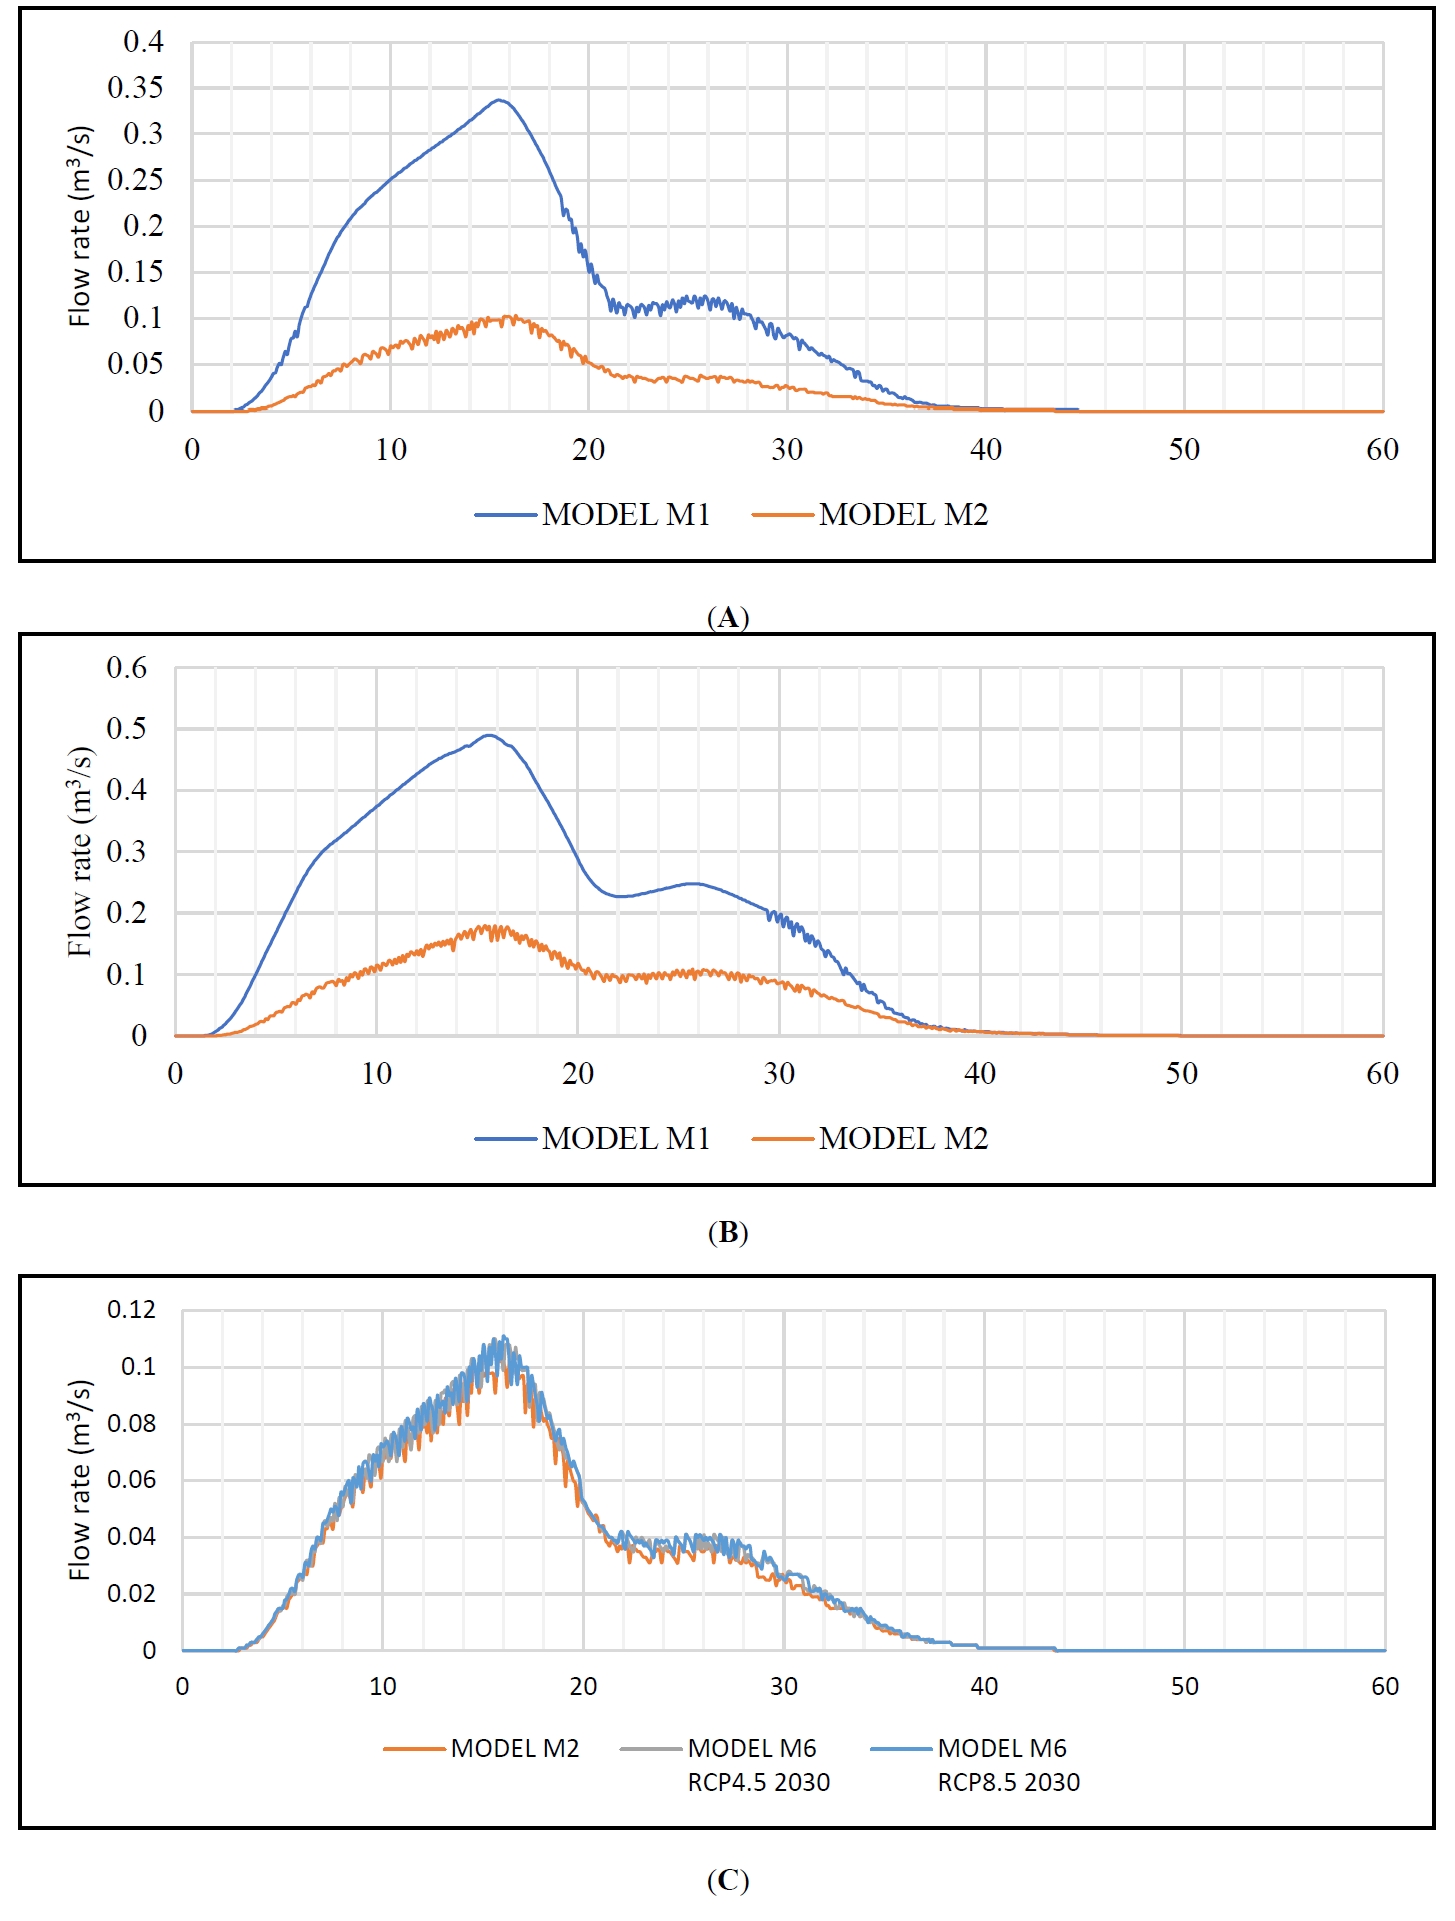
After running models M1 and M2, hydrographs of pipe 6 are obtained. These hydrographs are collected after running simulations under minor and major storms, and changes in time to peak and volume are analyzed. Hydrographs are shown in Figure A4. Time to peak changed differently under minor and major storm events after the inclusion of RWTs in the SDS. Under minor storms, time to peak is delayed and increased by 6%. On the other hand, under major events, this time is shortened by 1%. Volume decreased significantly with the inclusion of RWTs, with a 71% reduction under a minor storm and 64% under a major storm (). Although the percentage is lower for a major storm, the total volume of water is more than double that of the minor storm collected. The results obtained in this section are limited by several factors. Firstly, changes shown in are a result of connecting 100% roof-accepted runoff to RWTs. The proportion of roof area connected is an important variable influencing these changes.
.
Changes of hydrograph in pipe 6 between models M1 and M2.
| Storm Type |
Variable |
Model M1 |
Model M2 |
% Change |
| Minor Storm |
Time to peak (min) |
15.4 |
16.3 |
5.8% |
| Volume (m3) |
312.6 |
90.9 |
−70.9% |
| Major Storm |
Time to peak (min) |
15.6 |
15.4 |
−1.3% |
| Volume (m3) |
544.9 |
197.7 |
−63.7% |
A similar examination is made in this section, comparing results obtained in model M2 with those obtained from model M6. Results in detail are shown in . For a second time, time to peak is affected oppositely under minor and major storms. Previously, an increase of time to peak was observed under minor storms. These increments obtained in model M2 are found to be reduced in every CC scenario. In fact, on the RCP8.5 pathway, time to peak was reduced to the original time calculated in model M1. Moreover, under major storms, time to peak was increased by up to 5% for all CC scenarios. Therefore, there is a trend observed where time to peak seems to be reduced under minor events but increased under major events for all CC scenarios considered in this study. Runoff volume increased sustainedly under both minor and major storms in every CC scenario. Under minor storms, these increments are on average 6% for the year 2030 and 10% for the year 2050. Under major storms, these values are 5% for 2030 and 9% for 2050.
.
Changes of hydrographs in pipe 6 between models M2 and M6.
| Storm Type |
Variable |
Model M2 |
Model M6
RCP4.5 2030 |
Model M6
RCP4.5 2050 |
Model M6
RCP8.5 2030 |
Model M6
RCP8.5 2050 |
| Minor |
Time to peak (min) |
16.3 |
15.5 |
−4.9% |
16.2 |
−0.6% |
16 |
−1.8% |
15.4 |
−5.5% |
| Volume (m3) |
90.9 |
96.1 |
5.7% |
98.9 |
8.8% |
96.9 |
6.6% |
101.5 |
11.7% |
| Major |
Time to peak (min) |
15.4 |
15.8 |
2.6% |
15.9 |
3.2% |
15.6 |
1.3% |
16.2 |
5.2% |
| Volume (m3) |
197.7 |
205.7 |
4.0% |
214 |
8.2% |
209.2 |
5.8% |
217.7 |
10.1% |
Runoff volume is significantly reduced after RWTs are included in the network. Reductions in runoff volume (
i.e., volume benefits) are observed for both minor and major storms. As shown previously in , runoff volume decreases by 221.7 m
3 under a minor event, making a reduction of 71%. For a major event, a reduction of 64% is observed, with runoff volume being reduced by 347.2 m
3. To achieve these benefits, large tank sizes may be needed. These benefits are obtained from model M2. Therefore, it is required to collect the water from 100% of the roof area during the entire storm. Also, as the efficiency of RWH systems is controlled by different variables [
6,
8,
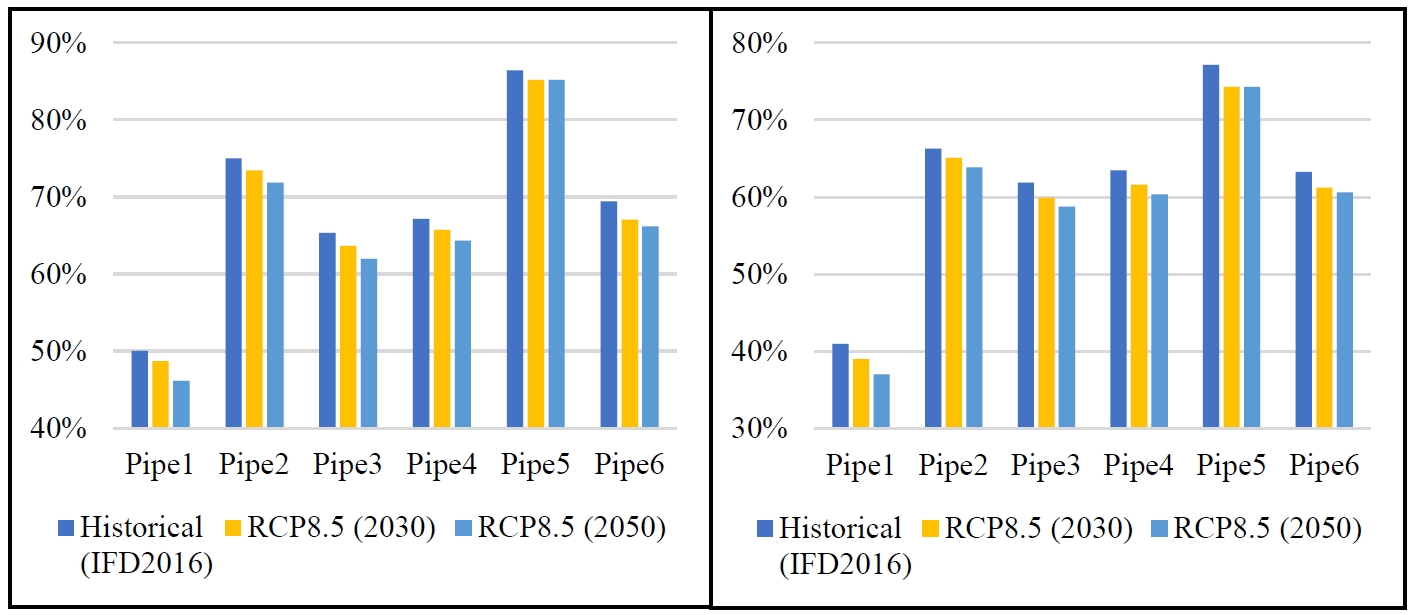
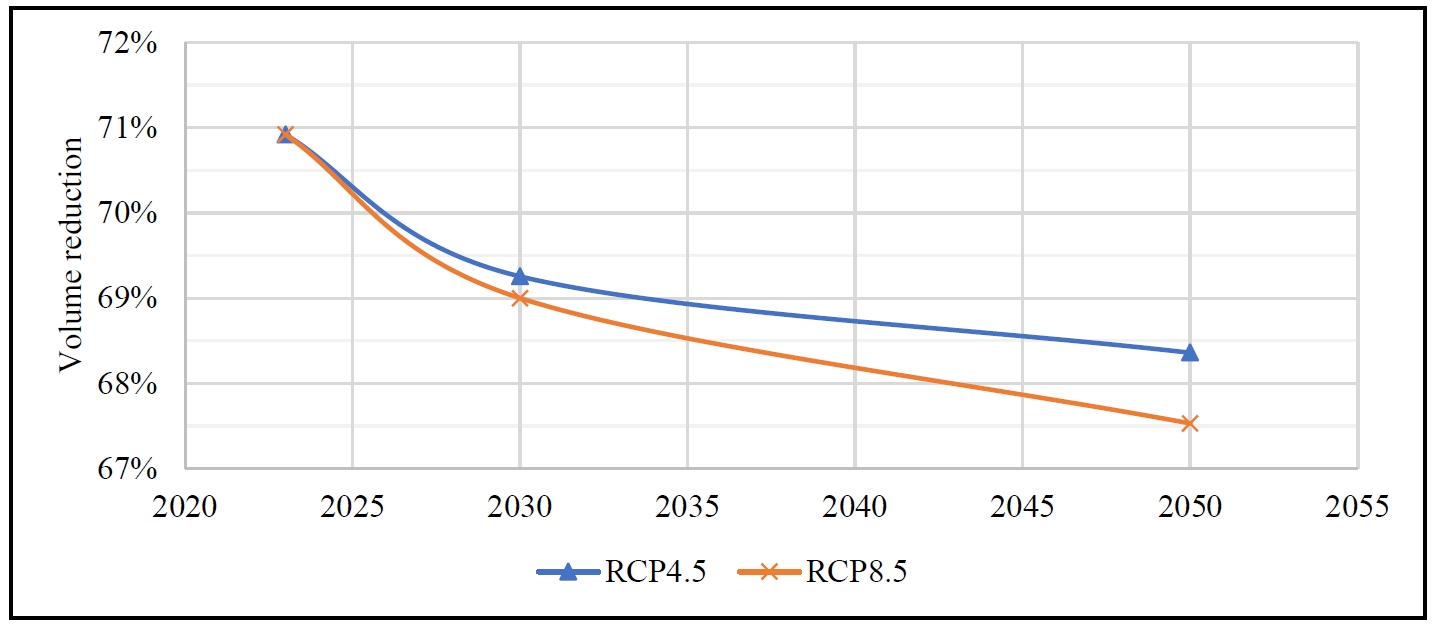
34], benefits obtained for upcoming storm events may be altered by consumption patterns within the tank, as storage availability in tanks could be less if consumption patterns are low. Under a minor storm, benefits decline to 69.3% in the year 2030 and 68.4% in the year 2050 when following the RCP4.5 pathway. For the RCP8.5, benefits decline to 69.0% in the year 2030 and 67.5% in the year 2050. These values are shown in and where both RCP scenarios are represented. Secondly, under a major storm, benefits fall to 62.2% and 60.7% for the years 2030 and 2050 respectively, when the RCP4.5 is followed. And 61.6% for the year 2030, and 60.0% for the year 2050 when RCP8.5 is followed.
. Projected volume reductions in the network under minor storms.
. Projected volume reductions in the network under major storms.
5. Recommendations and Conclusions
Based on the objectives and the outcomes of this study, the following conclusions can be drawn:
- Overall, significant benefits were obtained in reducing both peak flows and runoff volumes, particularly when 100% of the roof area within the catchment is connected to RWTs.
- When projected data are used instead of historical data, these benefits are slightly affected. Nevertheless, benefits obtained remain high in the period 2030–2050.
- Water flowing through the system follows a similar behaviour across the models. Long sections and HGLs of pipes were similar in every model, although with different peak flows, volumes, and hydrographs.
- Reductions in peak flows were observed in all the models. When 25% of roof area was connected to RWTs, benefits ranging from 9% to 17% in reductions for both minor and major storm events were obtained. These benefits increase when a larger proportion of roof area is connected to RWTs. In fact, these benefits improved to a maximum of 86% under a minor storm and 77% under a major storm when 100% of roof area is connected.
- eak flow benefits are slightly affected when projected rainfall data are used instead of historical data. These benefits in peak flow reductions fall by up to 2% in the year 2030 and 3% in 2050. Although a decrease in peak flow benefits is observed, benefits remain high compared to peak flow values obtained in the conventional network (i.e., model M1).
- A delay in time to peak is observed under minor storm. Time to peak was increased by 6.8% in pipe 6 under a minor storm after 100% roof area is connected. Under a major storm, however, time to peak is reduced by 1.3%. When projected data are used, these trends are reversed. On one hand, under minor storms, time to peak was reduced from its new value under all scenarios. On the other hand, under major storm events, time to peak was increased from the new value.
- Considerable reductions in runoff volume were obtained with 100% roof area connected. These benefits in volume reductions ranged from 64% to 71%. However, the use of projected data has a negative impact on these benefits. Under minor storms, benefits in volume fall from 71% to a range between 68.4% and 67.5%. A similar trend is observed under major storms, where benefits fall from 64% to a range between 60.0% and 60.7%.
Several factors limit the reach of this study. After the conclusions stated above, further studies could be developed addressing these limitations:
- This study was limited to a single residential development. Similar studies can be developed at a larger scale (e.g., suburb or city) to understand the benefits obtained after implementing RWTs or other WSUD technologies in the SDS. This information may be valuable for city councils to meet targets for a sustainable development, in strategies such as the 30-Year Plan for Greater Adelaide [4].
- Projections for a distant future (e.g., end of the century) can be made. Although these projections may be of low confidence due to the high complexity regarding climate processes, these projections may help in understanding whether an elevated investment will be impacted in the future.
- Studies with different rainfall temporal patterns are considered, especially patterns where higher intensities are found at the end of the storm. To perform these studies, different modeling approaches with fixed RWT sizes may be required. Fixing the tank storage capacity may help to understand how benefits change with different temporal patterns.
Appendix A
Table A1.
Projected rainfall intensities (mm/h).
| Storm Duration |
RCP 4.5 |
RCP 8.5 |
| 2030 |
2050 |
2030 |
2050 |
| Duration |
50% AEP |
2% AEP |
50% AEP |
2% AEP |
50% AEP |
2% AEP |
50% AEP |
2% AEP |
| 1 h |
14.8 |
36.5 |
15.1 |
37.2 |
14.8 |
36.7 |
15.4 |
38.1 |
| 12 h |
2.6 |
6.5 |
2.7 |
6.6 |
2.6 |
6.6 |
2.7 |
6.8 |
| 72 h |
0.7 |
1.4 |
0.7 |
1.4 |
0.7 |
1.4 |
0.7 |
1.5 |
Figure A2. Long section and hydraulic grade line under minor storm, model M2.
Figure A3. Long section and hydraulic grade line under major storm, model M2.
Table A2.
Peak flow rates and reductions in pipes under minor storm using models M1 to M5.
| Pipe Name |
M1 |
M2 |
M3 |
M4 |
M5 |
| Flow Rate (m3/s) |
Flow Rate (m3/s) |
Reduction |
Flow Rate (m3/s) |
Reduction |
Flow Rate (m3/s) |
Reduction |
Flow Rate (m3/s) |
Reduction |
| Pipe1 |
0.078 |
0.039 |
50% |
0.051 |
35% |
0.062 |
21% |
0.071 |
9% |
| Pipe2 |
0.064 |
0.016 |
75% |
0.028 |
56% |
0.040 |
38% |
0.052 |
19% |
| Pipe3 |
0.176 |
0.061 |
65% |
0.090 |
49% |
0.120 |
32% |
0.147 |
16% |
| Pipe4 |
0.216 |
0.071 |
67% |
0.107 |
50% |
0.145 |
33% |
0.180 |
17% |
| Pipe5 |
0.081 |
0.011 |
86% |
0.031 |
62% |
0.053 |
35% |
0.069 |
15% |
| Pipe6 |
0.337 |
0.103 |
69% |
0.167 |
50% |
0.226 |
33% |
0.283 |
16% |
Table A3.
Peak flow rates and reductions in pipes under major storm using models M1 to M5.
| Pipe Name |
M1 |
M2 |
M3 |
M4 |
M5 |
| Flow Rate (m3/s) |
Flow Rate (m3/s) |
Reduction |
Flow Rate (m3/s) |
Reduction |
Flow Rate (m3/s) |
Reduction |
Flow Rate (m3/s) |
Reduction |
| Pipe1 |
0.100 |
0.059 |
41% |
0.071 |
29% |
0.082 |
18% |
0.091 |
9% |
| Pipe2 |
0.083 |
0.028 |
66% |
0.045 |
46% |
0.062 |
25% |
0.073 |
12% |
| Pipe3 |
0.257 |
0.098 |
62% |
0.138 |
46% |
0.180 |
30% |
0.222 |
14% |
| Pipe4 |
0.323 |
0.118 |
63% |
0.169 |
48% |
0.223 |
31% |
0.277 |
14% |
| Pipe5 |
0.105 |
0.024 |
77% |
0.054 |
49% |
0.076 |
28% |
0.092 |
12% |
| Pipe6 |
0.490 |
0.180 |
63% |
0.263 |
46% |
0.348 |
29% |
0.426 |
13% |
Table A4.
Peak flow rates and reductions in pipes under minor storm using model M6.
| Pipe Name |
2030 |
2050 |
| RCP4.5 |
RCP8.5 |
RCP4.5 |
RCP8.5 |
| Flow Rate (m3/s) |
Reduction |
Flow Rate (m3/s) |
Reduction |
Flow Rate (m3/s) |
Reduction |
Flow Rate (m3/s) |
Reduction |
| Pipe1 |
0.04 |
49% |
0.04 |
49% |
0.041 |
47% |
0.042 |
46% |
| Pipe2 |
0.017 |
73% |
0.017 |
73% |
0.018 |
72% |
0.018 |
72% |
| Pipe3 |
0.064 |
64% |
0.064 |
64% |
0.065 |
63% |
0.067 |
62% |
| Pipe4 |
0.074 |
66% |
0.074 |
66% |
0.076 |
65% |
0.077 |
64% |
| Pipe5 |
0.012 |
85% |
0.012 |
85% |
0.012 |
85% |
0.012 |
85% |
| Pipe6 |
0.11 |
67% |
0.111 |
67% |
0.11 |
67% |
0.114 |
66% |
Table A5.
Peak flow rates and reductions in pipes under major storm using model M6.
| Pipe Name |
2030 |
2050 |
| RCP4.5 |
RCP8.5 |
RCP4.5 |
RCP8.5 |
| Flow Rate (m3/s) |
Reduction |
Flow Rate (m3/s) |
Reduction |
Flow Rate (m3/s) |
Reduction |
Flow Rate (m3/s) |
Reduction |
| Pipe1 |
0.061 |
39% |
0.061 |
39% |
0.062 |
38% |
0.063 |
37% |
| Pipe2 |
0.029 |
65% |
0.029 |
65% |
0.029 |
65% |
0.03 |
64% |
| Pipe3 |
0.101 |
61% |
0.103 |
60% |
0.104 |
60% |
0.106 |
59% |
| Pipe4 |
0.122 |
62% |
0.124 |
62% |
0.126 |
61% |
0.128 |
60% |
| Pipe5 |
0.026 |
75% |
0.027 |
74% |
0.027 |
74% |
0.027 |
74% |
| Pipe6 |
0.187 |
62% |
0.19 |
61% |
0.191 |
61% |
0.193 |
61% |
Figure A4. Hydrographs of pipe 6. (<b>A</b>) Pipe 6 hydrographs from models M1 and M2 under minor storm; (<b>B</b>) Pipe 6 hydrograph from models M1 and M2 under major storm; (<b>C</b>) Pipe 6 hydrograph from models M2 and M6 under minor storm projected to 2030.
Acknowledgments
We would like to acknowledge the City of Onkaparinga (a local government of South Australia) for provinding us project related information.
Author Contributions
Conceptualization, F.A.C.S. and E.S.; Methodology, E.S. and F.A.C.S.; Software, E.S.; Validation, E.S.; Formal Analysis, E.S.; Investigation, E.S. and F.A.C.S.; Resources, E.S.; Data Curation, E.S. and F.A.C.S.; Writing—Original Draft Preparation, E.S.; Writing—Review & Editing, F.A.C.S.; Visualization, E.S.; Supervision, F.A.C.S.; Project Administration, E.S. and F.A.C.S.
Ethics Statement
Not applicable.
Informed Consent Statement
Not applicable.
Data Availability Statement
Data of this research article may be available upon request to authors.
Funding
This study was completed as a part of Master of Engineering thesis at the University of South Australia and no extra funding was involved.
Declaration of Competing Interest
The authors declare that they have no known competing financial interests or personal relationships that could have appeared to influence the work reported in this paper.
References
1.
The World Bank. Urban Development. Available online: https://www.worldbank.org/en/topic/urbandevelopment/overview#:~:text=Globally%2C%20over%2050%25%20of%20the,housing%20their%20expanding%20populations%20need (accessed on 15 June 2024).
2.
Kim H, Han M, Lee JY. The application of an analytical probabilistic model for estimating the rainfall
–runoff reductions achieved using a rainwater harvesting system.
Sci. Total Environ. 2012,
424, 213–218.
[Google Scholar]
3.
Akhter F, Hewa GA, Ahammed F, Myers B, Argue JR. Performance evaluation of stormwater management systems and its impacts on development costing.
Water 2000,
12, 1–20.
[Google Scholar]
4.
Water Sensitive Urban Design Technical Manual for the Greater Adelaide Region. Available online: https://www.watersensitivesa.com/resources/guidelines/design/design-wsud-all-assets/technical-manual-for-water-sensitive-urban-design-in-greater-adelaide/ (accessed on 27 July 2024).
5.
Coombes PJ, Argue JR, Kuczera G. Figtree Place: A case study in water sensitive urban development (WSUD).
Urban Water 2000,
1, 335–343.
[Google Scholar]
6.
Custódio DA, Ghisi E. Impact of residential rainwater harvesting on stormwater runoff.
J. Environ. Manag. 2023,
326, 116814.
[Google Scholar]
7.
Itsukushima R, Ogahara Y, Iwanaga Y, Sato T. Investigating the influence of various stormwater runoff control facilities on runoff control efficiency in a small catchment area.
Sustainability 2018,
10, 407.
[Google Scholar]
8.
Steffen J, Jensen M, Pomeroy CA, Burian SJ. Water supply and stormwater management benefits of residential rainwater harvesting in US cities.
J. Am. Water Resour. Assoc. 2013,
49, 810–824.
[Google Scholar]
9.
Zhang S, Zhang J, Yue T, Jing X. Impacts of climate change on urban rainwater harvesting systems.
Sci. Total Environ. 2019,
665, 262–274.
[Google Scholar]
10.
Ahammed F. A review of water-sensitive urban design technologies and practices for sustainable stormwater management.
Sustain. Water Resour. Manag. 2017,
3, 269–282.
[Google Scholar]
11.
Santos C, Imteaz MA, Ghisi E, Matos C. The effect of climate change on domestic Rainwater Harvesting.
Sci. Total Environ. 2020,
729, 138967.
[Google Scholar]
12.
Haque MM, Rahman A, Samali B. Evaluation of climate change impacts on rainwater harvesting.
J. Clean. Prod. 2016,
137, 60–69.
[Google Scholar]
13.
Lo KFA, Koralegedara SB. Effects of climate change on urban rainwater harvesting in Colombo city, Sri Lanka.
Environments 2015,
2, 105–124.
[Google Scholar]
14.
Wallace CD, Bailey RT, Arabi M. Rainwater catchment system design using simulated future climate data.
J. Hydrol. 2015,
529, 1798–1809.
[Google Scholar]
15.
Nunes Carvalho TM, de Souza Filho FDA, Medeiros de Saboia MA. Performance of rainwater tanks for runoff reduction under climate change scenarios: a case study in Brazil.
Urban Water J. 2020,
17, 912–922.
[Google Scholar]
16.
Commonwealth Science Industrial Research Organisation (CSIRO). Climate Change in Australia. Available online: https://www.climatechangeinaustralia.gov.au/en/projections-tools/regional-climate-change-explorer/sub-clusters/?current=SSWSE&tooltip=true&popup=true (accessed on 3 November 2024).
17.
Zhang Y, Grant A, SharmaA, Chen D, Chen L. Alternative water resources for rural residential development in Western Australia.
Water Resour. Manag. 2010,
24, 25–36.
[Google Scholar]
18.
Campisano A, Modica, C. Rainwater harvesting as source control option to reduce roof runoff peaks to downstream drainage systems.
J. Hydroinform. 2015,
18, 23–32.
[Google Scholar]
19.
Qin HP, Li ZX, Fu G. The effects of low impact development on urban flooding under different rainfall characteristics.
J. Environ. Manag. 2013,
129, 577–585.
[Google Scholar]
20.
Loveridge M, Babister M. Interdependence of design losses and temporal patterns in design flood estimation. In Proceedings of the 37th Hydrology and Water Resources Symposium, Queenstown, New Zealand, 29 November–1 December 2016.
21.
Jensen MA, Steffen J, Burian SJ, Pomeroy C. Do rainwater harvesting objectives of water supply and stormwater management conflict? InLow Impact Development 2010: Redefining Water in the City;ASCE: Reston, VA, USA, 2010; pp. 11–20.
22.
Rashetnia S, Sharma AK, Ladson AR, Browne D, Yaghoubi E. A scoping review on Water Sensitive Urban Design aims and achievements.
Urban Water J. 2022,
19, 453–467.
[Google Scholar]
23.
Lim KY, Hamilton AJ, Jiang SC. Assessment of public health risk associated with viral contamination in harvested urban stormwater for domestic applications.
Sci. Total Environ. 2015,
523, 95–108.
[Google Scholar]
24.
Magyar MI, Ladson AR, Sharma AK, Begbie D, Gardner T. Chemical quality of rainwater in rain tanks. In Rainwater Tank Systems for Urban Water Supply; IWA Publishing: London, UK, 2015; pp. 207–226.
25.
Hamilton K, Reyneke B, Waso M, Clements T, Ndlovu T, Khan W, et al. A global review of the microbiological quality and potential health risks associated with roof-harvested rainwater tanks.
NPJ Clean Water 2019,
2, 7.
[Google Scholar]
26.
Ahmed W, Toze S. Microbiological quality and associated health risks with the use of roof-captured rainwater. In Rainwater Tank Systems for Urban Water Supply: Design, Yield, Energy, Health Risks, Economics and Social Perceptions; IWA: London, UK, 2015.
27.
Ghisi E, Bressan DL, Martini M. Rainwater tank capacity and potential for potable water savings by using rainwater in the residential sector of southeastern Brazil.
Building Environ. 2007,
42, 1654–1666.
[Google Scholar]
28.
Imteaz MA, Moniruzzaman, M. Potential impacts of climate change on future rainwater tank outcomes: A case study for Sydney.
J. Clean. Prod. 2020,
273, 123095.
[Google Scholar]
29.
Khan MS, Imteaz MA. Future performance of rainwater tanks and impacts on weather variability under climate change scenarios.
Environ. Sci. Water Res. Technol. 2022,
8, 2629–2640.
[Google Scholar]
30.
City of Onkaparinga. Stormwater Management Design Guide. Available online: file:///C:/Users/Yuyun/Desktop/Stormwater-management-design-guide.pdf (accessed on 1 July 2023).
31.
O’Loughlin G, Stack B, Kus B. DRAINS User Manual; Watercom Pty Ltd: Wooli, NSW, Australia, 2018.
32.
Ball JE, Babister MK, Nathan R, Weinmann PE, Weeks W, Retallick M., et al. Australian Rainfall and Runoff-A Guide to Flood Estimation; Commonwealth of Australia: Canberra, Australia 2016.
33.
Climate Analytics. Climate Impact Explorer. Available online: https://climate-impact-explorer.climateanalytics.org/impacts/?region=AUS&indicator=tasAdjust&scenario=rcp45&subregion=AU.SA&warmingLevel=3.0&temporalAveraging=annual&spatialWeighting=area&compareYear=2030 (accessed on 1 November 2024).
34.
Campisano A, Modica C. Optimal sizing of storage tanks for domestic rainwater harvesting in Sicily.
Resour. Conserv. Recycling 2012,
63, 9–16.
[Google Scholar]