1. Introduction
In the face of growing demand for energy and sustainable development requirements, high-quality clean energy has become one of the main directions of energy structure reform in various countries [
1,
2,
3]. Marine energy, with its vast untapped resource potential, provides important support for the realization of the “dual carbon” goals [
4] and receives much attention in academic research.
As a kind of marine energy, tidal energy has significant development value because of its abundant resources [
5], stable and predictable characteristics [
6]. Tidal energy can be generated by a variety of technologies, including barrages type, axial flow type, vertical type and reciprocating type. At present, the most common tidal energy device is the horizontal axis turbine. However, its initial starting flow velocity is high, and its application in many low-flow velocity areas is limited [
7,
8]. Therefore, it is very important to develop an effective capture tidal energy device at low flow velocity.
FIM is divided into vortex-induced vibration (VIV) and galloping. It is generally caused by vortex shedding or dynamic instability when the fluid flows through the bluff body structures [
9,
10,
11]. When the amplitude of these oscillations reaches a certain threshold, they will cause damage to the engineering structure, bringing safety hazards and economic losses. Therefore, a large number of scholars focus on how to suppress the FIM [
12,
13].
With the development of marine energy technology, research in recent years has begun to reconsider FIM from the perspective of energy harness [
14,
15,
16]. Bernitsas proposed a vortex-induced vibrations for aquatic clean energy (VIVACE) device [
17,
18]. This device has significant advantages, including a low initial starting flow velocity and high energy density, and achieves a breakthrough in the electromagnetic energy harness of FIM. Based on it, scholars have conducted a series of studies on how to improve energy harness efficiency, which can be roughly categorized into two directions.
One is to improve the cylindrical oscillators: Park and Kumar [
19] could effectively change the pressure distribution on the surface of the cylinder by changing the roughness of the cylinder through passive turbulence control. During the experiment, they found two different galloping modes of the cylinder: Soft galloping (SG) and hard galloping (HG). Chen et al. [
20] conducted experiments on cylinders with different diameters and found that galloping offers harnessed power that is three times larger than the VIV. Still, the maximum efficiency is in the VIV. Feng et al. [
21] verified the experimental setup of flow-induced rotation (FIR) of coupled double cylinders in tandem and established the theoretical basis of FIR.
The other is to explore non-cylindrical oscillators: Zhang et al. [
22] explored the FIM of the equilateral triangular prism and found that its oscillation response does not inhibit the increase of the reduced velocity. Yan et al. [
23] tested the galloping characteristics of the T-section prism. The experimental results indicate that the soft galloping occurs when the damping ratios are small and oscillators exhibited self-excitation characteristics. Lian et al. [
24] conducted FIM experiments on two rigidly coupled triangular prisms in tandem arrangement. The experimental results indicate that the “sharp jump” phenomenon may appear at specific spacing ratios. Ran et al. [
25] designed a novel “Cir-Tri-Att” oscillator and carried out experiments on oscillators with an aspect ratio 1:1 in the range of 0–100 V excitation voltages. This oscillator can utilize energy from both the VIV and the galloping. The experimental results indicate that the energy harness capacity of the oscillator is better than that of the triangular prism.
Recently, Liu et al. [
26] improved Ran's experiment by expanding the regulation range of excitation voltage to 0-200 V and tested four CTAO with different aspect ratios under certain stiffness. It is worth mentioning that the PIV was introduced into the experiment to capture the wake of typical working conditions.
The Liu's research only analyzed the influence of aspect ratios on the oscillation and wake under specific working conditions. Based on their work, this paper further explored not only the experimental analysis of the influence of the aspect ratios on energy harness, and used PIV to analyze the wake structures. It provided a systematic summary of the FIM, energy harness and wake structures of the CTAO under different working conditions, providing theoretical and data support for the optimal oscillators of flow-induced motion tidal energy conversion system.
2. Numerical Model and Experimental Devices
2.1. Numerical Model
The flow-induced motion tidal energy conversion system consists of an oscillation part, transmission part and energy harness part. It integrates the flow, oscillator, generator and load to simulate a tidal energy device. Additionally, the heating loss of the load is regarded as the active power of a flow-induced motion tidal energy conversion system.
Numerical model in Reference [
27]:
- (1)
-
The kinematics equation of the system can be expressed as:
where
mosc and
ma represent the oscillation mass and additional water mass of the system, respectively;
y,
ẏ and
ÿ represent the displacement, velocity and acceleration of oscillation, respectively;
ctotal is the total damping of the system;
K is the stiffness;
FL is the incoming fluid force.
- (2)
-
The energy harness of the system can be expressed as:
where
Pharn is the power output of the system;
ηharn is the efficiency of the system;
Pw is the total power of the fluid.
Among:
2.2. Experimental Devices
2.2.1. Experimental Layout
The experiment is carried out in the State Key Laboratory of Hydraulic Engineering Intelligent Construction and Operation of Tianjin University. Experimental devices are mainly composed of the following parts:
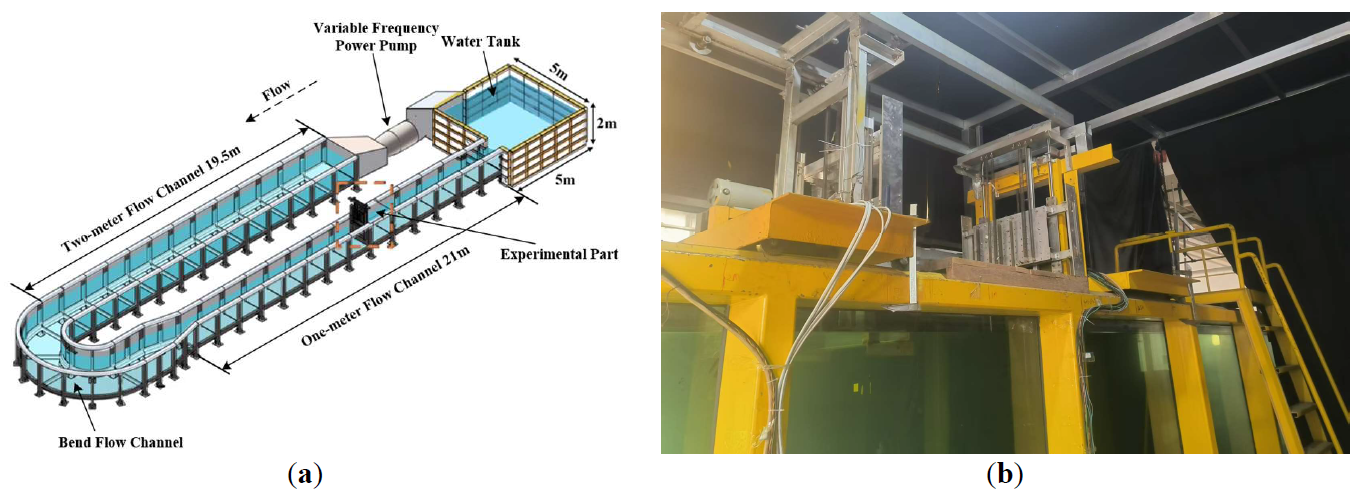
(1) Recirculating Water Channel
As shown in , the experimental part is arranged in a 1 m flow channel, and the experimental water depth is maintained at 1.34 m; the variable frequency power pump can drive the uniform motion of the flow, and the flow velocity can be controlled by the frequency converter. According to the conclusion of the turbulence intensity measured by Shao [
28], the turbulence difference within the experimental part is minimal, and the fluid in the experimental part can be generally guaranteed to be uniform flow.
. Recirculating water channel. (<b>a</b>) Overall layout of recirculating water channel schematic; (<b>b</b>) Real space of recirculating water channel.
(2) Oscillation and Transmission Part
The oscillator is placed in the water and laterally constrained between side struts, so the oscillator only moves up and down. The linear guideways are fixed on the frame, parallel to the frame and perpendicular to the flow direction. The spring carrier structure is connected to the transmission part and the frame, respectively, so the oscillator can perform a linear reciprocating motion.
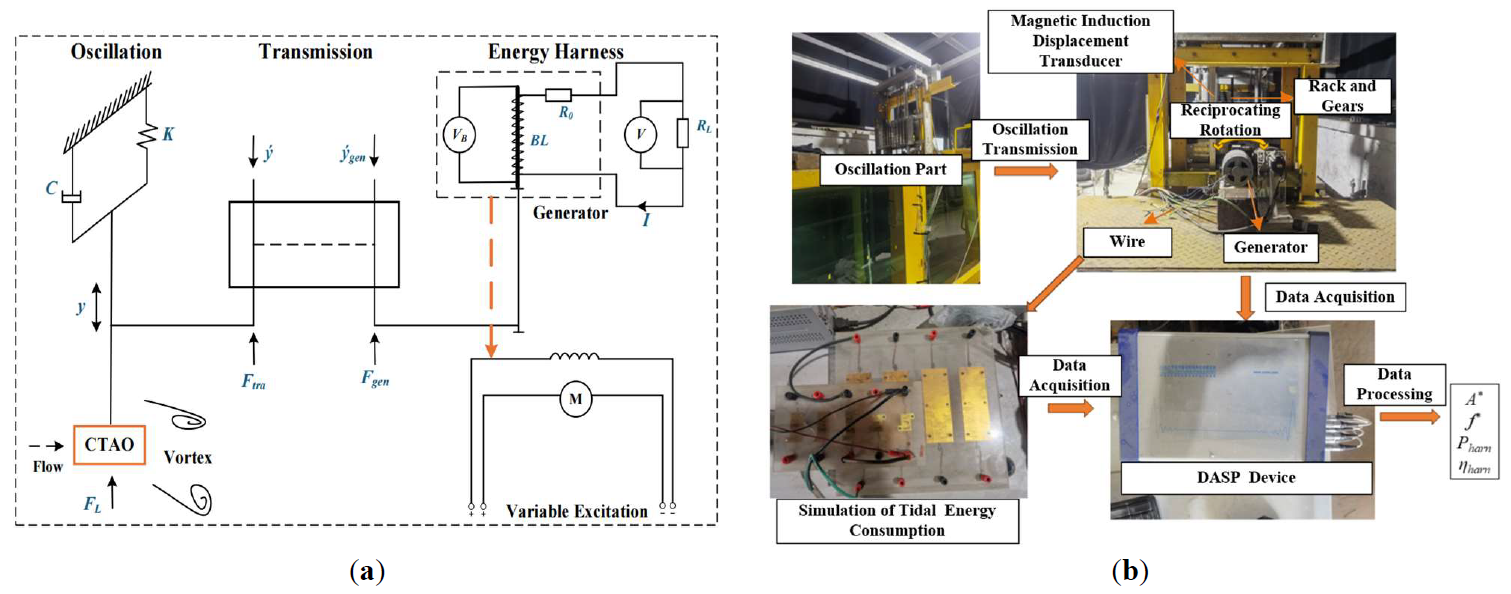
(3) Energy Harness Part
The oscillation part is connected to the variable excitation generator through the rack and gears. When the oscillator vibrates, the rack and gears convert the linear reciprocating rotation, which drives the generator rotor to cut magnetic lines to generate electric energy and transmit it to the load resistance to simulate the consumption of tidal energy. The system damping ratios can be changed by a controllable magnetic damping system. The amplitude and frequency are collected by the transducer in real-time and transmitted to the data acquisition & signal processing (DASP) device in the form of electrical signals.
The energy harness part is shown in .
. The energy harness part. (<b>a</b>) Schematic of flow-induced motion tidal energy conversion system; (<b>b</b>) Real space of the energy harness part.
(4) PIV System
illustrates the components and parameters of the PIV system.
.
Components and parameters of the PIV system.
| Components |
Parameters |
| Dual-cavity laser |
Dual Power 425-10 PIV Laser, 2 × 425 mJ & 10 Hz, 532 nm |
| CCD camera |
FlowSense EO 16M-9, 4896 × 3264, 8.8 fps |
| Lens |
Nikon 50 mm F/1.8D |
| Software |
Dynamic Studio 5.1 |
| Tracer particles |
Hollow Glass Spheres, Diam: 10 μm, 250 g |
During the experiment, tracer particles are placed into the experimental part. The laser is refracted through the prism to form a light curtain and captured by the CCD camera. The image data is transmitted to the image processing system in real-time by the synchronizer. The instantaneous velocity can be calculated by the displacement of the tracer particles during the exposure time, as the real state of the flow field can be obtained.
(5) Oscillators
In this experiment, the CTAO is selected, and its section consists of a partial circle, a large triangle and two smaller triangles. Plexiglass end-plates with a thickness of 0.01 m are added to both ends of the oscillator to weaken the influence of boundary conditions on oscillation. The attached plate, also 0.01 m, is positioned at a circumferential angle of 60°. Additionally, the oscillator is designed with a hollow interior to facilitate weight adjustment, and four different aspect ratios are tested:
α = 1:1,
α = 1.25:1,
α = 1.5:1,
α = 1.75:1. The configuration is shown in .
. The “Cir-Tri-Att” oscillator. (<b>a</b>) Section of the “Cir-Tri-Att” oscillator; (<b>b</b>) Physical model of the “Cir-Tri-Att” oscillator.
2.2.2. Verification
In this experiment, the system damping ratio needs to be adjusted, that is, the excitation voltage needs to be changed. Therefore, it is necessary to determine whether the system mass remains constant under different excitation voltages and to verify whether the relationship between the total damping and the excitation voltage in the numerical model matches the experimental devices. Considering the special configuration of CTAO, the free decay test under different excitation voltages is carried out in the air [
28,
29]. The oscillation mass, total damping and system damping ratio are calculated by the following equations:
where
fn is the natural frequency of the system;
ζ is the system damping ratio; mosc is the oscillation mass of the system;
Ai is the amplitude of the ith peak;
Ai+1 is the amplitude of the
i+1th peak.
The CTAO of each working condition is carried out four free decay tests. And in the case of reasonable error, the average of the four tests is taken. The results are shown in .
.
Free decay test results under different excitation voltages.
| VB/V |
fn/Hz |
mosc/kg |
ζ |
ctotal/(N·s·m–1) |
| 0 |
0.976 |
31.931 |
0.033 |
12.793 |
| 10 |
0.976 |
31.931 |
0.036 |
13.932 |
| 20 |
0.976 |
31.931 |
0.041 |
16.213 |
| 30 |
0.966 |
32.557 |
0.047 |
18.623 |
| 40 |
0.980 |
31.624 |
0.057 |
22.349 |
| 50 |
0.976 |
31.931 |
0.067 |
26.166 |
| 60 |
0.976 |
31.931 |
0.081 |
31.646 |
| 70 |
0.976 |
31.931 |
0.096 |
37.647 |
| 80 |
0.971 |
32.241 |
0.119 |
46.657 |
| 90 |
0.971 |
32.241 |
0.139 |
54.652 |
| 100 |
0.966 |
32.557 |
0.153 |
60.652 |
| 110 |
0.971 |
32.241 |
0.185 |
72.645 |
| 120 |
0.971 |
32.241 |
0.213 |
83.652 |
| 130 |
0.962 |
32.877 |
0.248 |
98.617 |
| 140 |
0.966 |
32.557 |
0.272 |
107.652 |
| 150 |
0.962 |
32.877 |
0.297 |
118.156 |
| 160 |
0.971 |
32.241 |
0.337 |
132.657 |
| 170 |
0.980 |
31.624 |
0.386 |
150.414 |
| 180 |
0.971 |
32.241 |
0.423 |
166.463 |
| 190 |
0.976 |
31.931 |
0.474 |
185.412 |
| 200 |
0.966 |
32.557 |
0.517 |
204.412 |
It can be seen that under different excitation voltages, the system damping ratio and total damping increase with the increase of excitation voltages, while the natural frequency and oscillation mass remain nearly constant.
Using the average values of
fn = 0.972,
mosc = 32.200 kg, the oscillation mass of oscillators with four different aspect ratios remains unchanged during the experiment. From Equations (5)–(7), it can be seen that the natural frequency, system damping ratio, and total damping of different oscillators are the same. Therefore, the experimental design is reasonable, and the experimental parameters are summarized in .
.
Oscillation experimental parameters.
| Name |
Symbol [Unit] |
Parameters |
| Width |
D [m] |
0.1 |
| Length |
l [m] |
0.9 |
| Oscillation mass |
mosc [Kg] |
32.200 |
| Stiffness |
K [N/m] |
1200 |
| Natural frequency |
fn [Hz] |
0.972 |
| Range of velocity |
U [m/s] |
0.680 ≤ U ≤ 1.214 |
| Reduced velocity |
Ur |
7 ≤ Ur ≤ 12.5 |
| Reynolds number |
Re = ρUD/μ |
59,441 ≤ Re ≤ 106,119 |
| Load resistance |
RL [Ω] |
36 |
2.2.3. Error Analysis
This paper introduced the parameters: reduced velocity
Ur = U/
fn ×
D, amplitude ratio
A∗ =
A/
D, and frequency ratio
f∗ = fosc/
fn,air, where
fosc is the main frequency of the system. In the experiment, a magnetic induction displacement transducer was used to measure the oscillator’s real-time displacement. Its measurement range is 0–800 mm, the sensitivity is 0.1%, and the full-scale accuracy is ±0.05% (FS). The power output was calculated by collecting voltages of the load resistance in real-time. The measurement range is from −10 V to +10 V, and the full-scale accuracy is ±0.1% (FS).
All errors associated with the above parameters are caused by the experimental devices, the maximum error of
A∗ is less than ±0.004, the maximum error of
Pharn is less than ±0.0026 W.
3. Flow-Induced Motion and Energy Harness
3.1. Flow-Induced Motion
The variation of amplitude ratio
A∗ and frequency ratio
f∗ with reduced velocity
Ur for oscillators with four different aspect ratios (
α = 1:1,
α = 1.25:1,
α = 1.5:1,
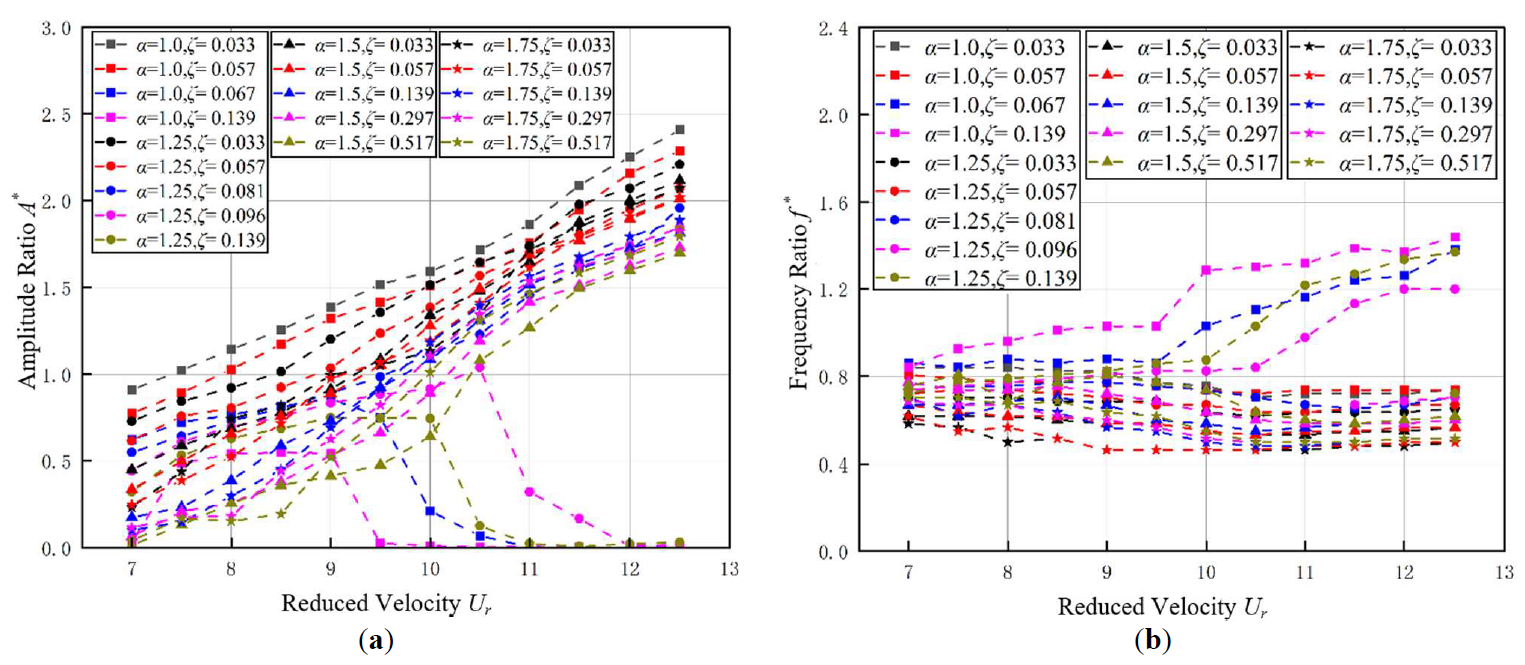
α = 1.75:1) under different system damping ratios are illustrated in .
. FIM of oscillators with different aspect ratios. (<b>a</b>) Amplitude ratio; (<b>b</b>) Frequency ratio.
According to , it can be seen that under different system damping ratios, the CTAO will undergo the conversion of SG, HG to VIV. With the increase of the system damping ratio, the initial starting velocity of the oscillator will increase, and under the same working conditions, the oscillation intensity will gradually weaken.
(1) For the oscillator with
α = 1:1, when 0.033 ≤
ζ ≤ 0.057, the oscillation mode is SG. As
Ur increases: the oscillation mode gradually enters the VIV initial branch (VIV-I), the VIV-galloping transition branch and the galloping branch. During this process,
A∗ gradually increases, while
f∗ decreases slightly and stabilizes between 0.72 and 0.74; when
ζ = 0.033,
Ur = 12.5, the maximum amplitude ratio
A∗ = 2.408; if the flow velocity continues to increase,
A∗ will continue to increase until the device is destroyed.
When
ζ > 0.057, the oscillation mode is VIV, As
Ur increases: when 7 ≤
Ur ≤ 7.5,
A∗ is very small and increases obviously with the increase of
Ur, and the oscillation is characterized by the VIV-I; then the oscillation enters the VIV upper branch (VIV-U), and the larger the
Ur, the larger the
A∗, and the obvious locking phenomenon of
f∗ appears, which is stable between 0.9 and 1.03. In the locking interval, the range of
Ur decreases from 7 ≤
Ur ≤ 9.5 (
ζ = 0.067) to 7 ≤
Ur ≤ 9 (
ζ = 0.139) with the increase of
ζ; When
Ur > 9.5, the oscillation enters the VIV down branch (VIV-D),
A∗ decreases,
f∗ increases with the increase of
Ur and the oscillation becomes unstable.
(2) For the oscillator with
α = 1.25:1, when 0.033 ≤
ζ ≤ 0.081, the oscillation mode is SG. As
Ur increases:
A∗ gradually increases, while
f∗ decreases slightly and stabilizes between 0.63 and 0.67; when
ζ = 0.034,
Ur = 12.5, the maximum amplitude ratio
A∗ = 2.209.
When 0.081 ≤
ζ ≤ 0.139, the oscillation mode is HG; as
Ur increases: when 7 ≤
Ur ≤ 7.5,
A∗ increases greatly, and the oscillation is characterized by the VIV-I; then the oscillation enters the VIV-U, the oscillation gradually strengthened,
A∗ increases, while
f∗ increases slightly and stabilizes between 0.8 and 0.85. In the locking interval, the range of
Ur decreases from 7 ≤
Ur ≤ 10.5 (
ζ = 0.096) to 7 ≤
Ur ≤ 10 (
ζ = 0.139); when
Ur > 10.5,
A∗ decreases significantly, and
f∗ increases significantly with the increase of
Ur, it indicates that the oscillation enters the VIV-D. At this time, there is a critical velocity (CV), that is, when the flow velocity exceeds CV, the oscillation can be excited by the external excitation into the galloping, and the CV increases from
Ur = 11.5 (
ζ = 0.096) to
Ur = 12.5 (
ζ = 0.139), it indicates that the ability of the system to convert VIV into galloping through external excitation is weakened. When the oscillation mode is HG,
f∗ is stable between 0.67 and 0.72, when
ζ = 0.096,
Ur = 12.5, the maximum amplitude ratio of HG can reach
A∗ = 1.845.
When
ζ > 0.139, the oscillation mode is VIV.
(3) For the oscillator with
α = 1.5:1, in the whole range of 0.033 ≤
ζ ≤ 0.517, the oscillation mode is SG. As
Ur increases,
A∗ increases gradually,
f∗ is stable between 0.53 and 0.6; when
ζ = 0.033,
Ur = 12.5, the maximum amplitude ratio
A∗ = 2.116.
The detailed analysis reveals that when
ζ = 0.0517, the oscillation becomes unstable: when 9 ≤
Ur ≤ 10, the increase of
A∗ slows down, while
f∗ continues to rise; as the flow velocity increases further,
A∗ increases, and
f∗ decreases, and the oscillation shows the characteristics of galloping. According to Reference [
30], this indicates that the damping ratio of the critical galloping (CG) of the oscillator with
α = 1.5:1 is close to
ζ = 0.0517, and the ability of self-excited galloping is weak at
ζ = 0.0517.
(4)For the oscillator with
α = 1.75:1, in the whole range of 0.033 ≤
ζ ≤ 0.517, the oscillation mode is SG. As
Ur increases:
A∗ increases gradually,
f∗ is stable between 0.46 and 0.52; when
ζ = 0.033,
Ur = 12.5, the maximum amplitude ratio
A∗ = 2.070.
It is evident that the oscillator with
α = 1.75:1 has no oscillation instability, that is, the oscillator with
α = 1.75:1 has better oscillation performance than the oscillator with
α = 1.5:1.
3.2. Energy Harness
From Equations (2) and (3), it can be seen that the power output
Pharn and the efficiency
ηharn are positively correlated with
A,
fosc and
VB, and
ηharn is negatively correlated with
U. Therefore,
A∗,
f∗,
Ur and
ζ will directly affect the size of
Pharn and
ηharn. In the experiment,
Pharn can also be obtained by the following expression:
where
Tosc is the oscillation period;
u(
t) is the collected instantaneous voltage.
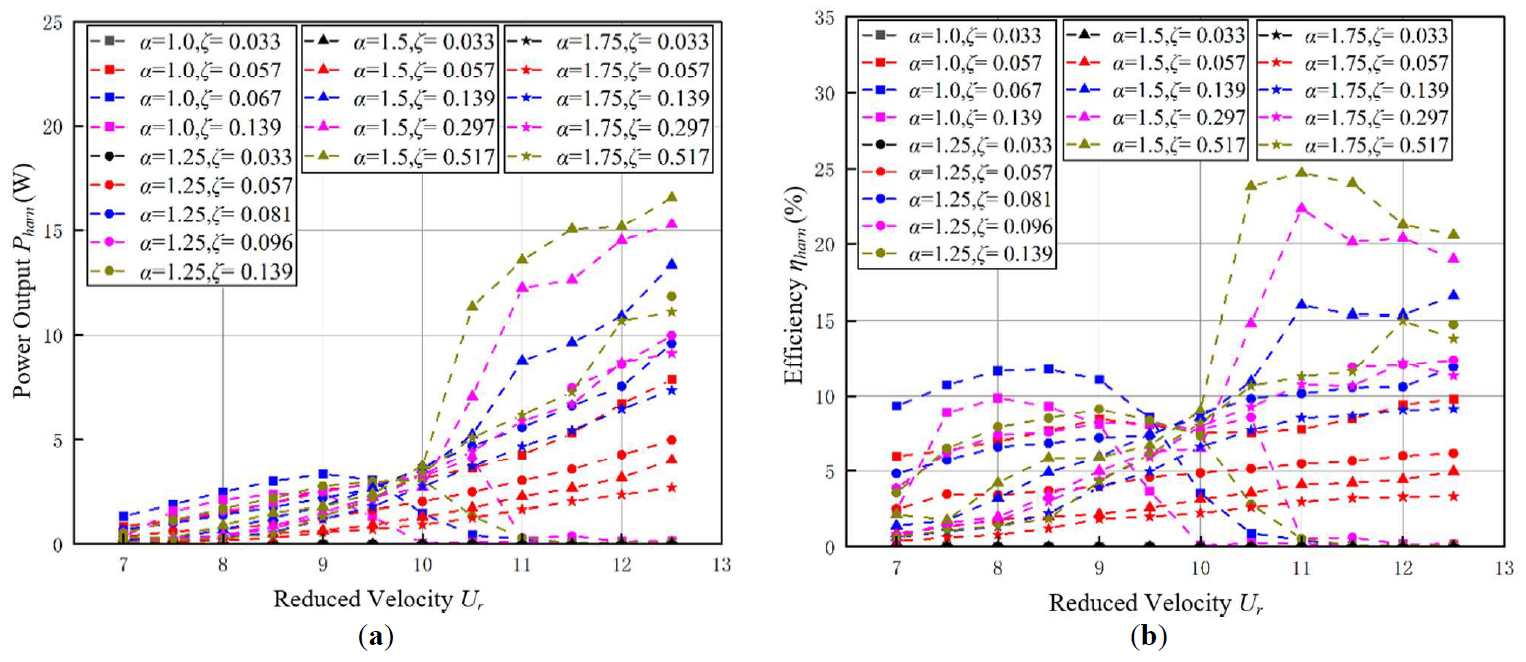
shows the variation of power output
Pharn and the efficiency
ηharn with reduced velocity under different system damping ratios of four oscillators with different aspect ratios of
α = 1:1,
α = 1.25:1,
α = 1.5:1 and
α = 1.75:1.
. Energy harness of an oscillator with different aspect ratios. (<b>a</b>) Power output; (<b>b</b>) Efficiency.
According to Section 3.1 and :
(1) For the oscillator with
α = 1:1, when 0.033 ≤
ζ ≤ 0.057, the oscillation mode is SG. As
Ur increases:
Pharn continues to rise because
ηharn is negatively correlated with
U3. It increases first and then tends to be stable. When
ζ = 0.033, the corresponding
VB = 0 V, and the power generation damping is very small, so
Pharn and
ηharn are close to 0; when
ζ = 0.057, with the increase of
ζ, the oscillation is weakened, but the increase of power generation damping is much higher than the decrease of
A∗, and the oscillation frequency is not much different, so
ζ = 0.057 compared with
ζ = 0.033,
Pharn and
ηharn increase significantly; when
ζ = 0.057,
Ur = 12.5, the maximum power output
Pharn = 7.870 W.
When
ζ > 0.057, the oscillation mode is VIV. As
Ur increases: in the VIV-I and VIV-U,
Pharn and
ηharn increase; while entering the VIV-D,
Pharn and
ηharn decreased rapidly to 0. Similarly, due to the negative correlation between
ηharn and
U3,
Pw dominates the change of
ηharn at high flow velocity, so the optimal efficiency does not always appear in the galloping; when
ζ =0.067,
Ur = 8.5, the optimal efficiency
ηharn = 11.763%.
(2) For the oscillator with
α = 1.25:1, when 0.033 ≤
ζ ≤ 0.081, the oscillation mode is SG. As
Ur increases:
Pharn increases monotonically,
ηharn increases first and then decreases slightly; with the increase of
ζ,
Pharn and
ηharn increased significantly.
When 0.081 ≤
ζ ≤ 0.139, the oscillation shows the characteristics of HG as
Ur increases: in the VIV-I and VIV-U,
Pharn and
ηharn increase; while entering the VIV-D,
Pharn and
ηharn decreased rapidly to 0; when the flow velocity exceeds CV and the oscillation enters the galloping through external excitation, both of them increase significantly,
Pharn increases, and
ηharn increases first and then tends to be stable; when
ζ = 0.139,
Ur = 12.5, the maximum power output
Pharn = 11.874 W and the optimal efficiency
ηharn =14.745%.
When
ζ > 0139, the oscillation mode is VIV. As
Ur increases: both
Pharn and
ηharn increased first and then decreased.
(3) For the oscillator with
α = 1.5:1, the whole range of 0.033 ≤
ζ ≤ 0.517, the oscillation mode is SG. As
Ur increases:
Pharn monotonically increases; when 0.033 ≤
ζ ≤ 0.139,
ηharn increases first and then stabilizes, and with the increase of
ζ, both of them rise significantly; when 0.139 ≤ ζ ≤ 0.517,
ηharn increases first and then decreases, while the growth rates of both parameters diminish as
ζ increases. This is because
ζ has a great influence on the amplitude
A∗ at this time. The decrease of
A∗ is only slightly smaller than the increase of power generation damping, and the oscillation frequency is still not much different. Therefore, the increase of
Pharn and
ηharn. When
ζ =0.517,
Ur =12.5, the maximum power output
Pharn =16.588 W; when
ζ = 0.517,
Ur = 11.5, the optimal efficiency
ηharn = 24.706%.
(4) For the oscillator with
α = 1.75:1, in the whole range of 0.033 ≤
ζ ≤ 0.517, the oscillation mode is SG. As
Ur increases: The variation trend of
Pharn and
ηharn is the same as that of the oscillator with
α = 1.5:1. When
ζ = 0.517,
Ur = 11.5, the maximum power output
Pharn = 11.125 W; when
ζ = 0.517,
Ur = 12, the optimal efficiency
ηharn = 15.000%.
4. Wake Structures
Referring to the wake mode summarized by Williamson et al. [
31,
32], the selected flow field data with a representative period are analyzed after repeated experiments and PIV measurements. It is found that the higher the flow velocity is, the more obvious the vortex in the PIV cloud image is, and the less the messy velocity vector is. Combined with the results of Section 3.1, it can be seen that the oscillation modes of four different forms of oscillators are SG when the system damping ratio
ζ = 0.055. Therefore, the experiment is carried out under the conditions of
ζ = 0.055 and
Ur =12, aiming to eliminate other factors and better reflect the influence of the aspect ratio. The experimental parameters of the PIV system are shown in .
.
Experimental parameters of PIV system.
| Name |
Parameters |
| Reduced velocity (Ur) |
12 |
| Velocity |
1.266 m/s |
| Re |
110664 |
| Exposure time (Δt) |
1700 μs |
| Shooting frequency of the double PIV images |
4.456 Hz |
| The method of processing the double PIV images |
Vector interpolation |
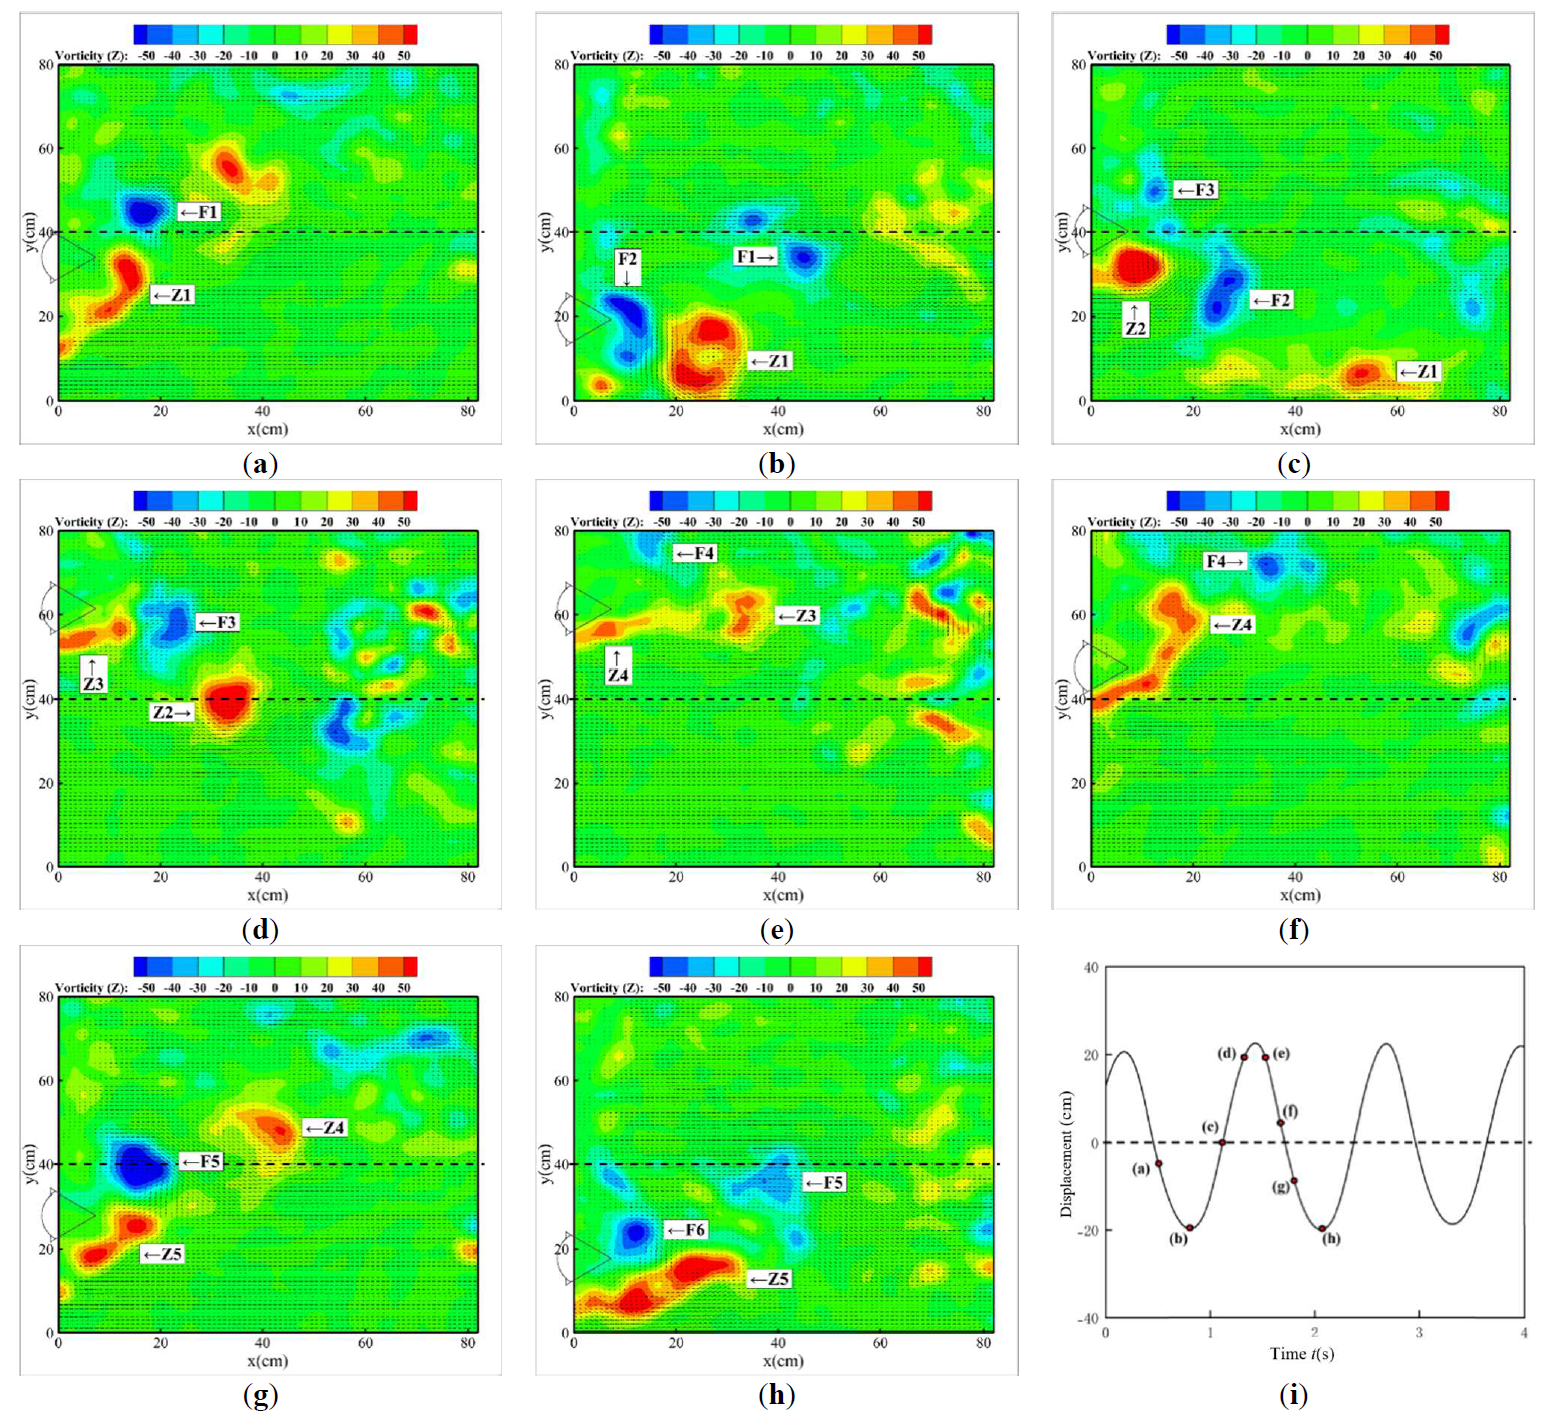
(1) The wake of the oscillator with
α = 1:1 in an oscillation period is shown in . In the figure, the wake vortex forms, develops and falls off from the surface of the upper and lower plates of the oscillator. The black solid line is the position of the oscillator at the corresponding time, and the reverse vortex is formed on the upper surface, which is recorded as F1, F2, F3…; the positive vortex is formed on the lower surface, recorded as Z1, Z2, Z3…. The same is true for the subsequent wake structure.
It can be seen that in an oscillation period, the wake mode is 4P, that is, as the oscillator vibrates up and down, the wake appears as four pairs of vortices in both positive and negative directions.
. The wake structures of the oscillator with α = 1:1. (<b>a</b>–<b>h</b>) Instantaneous wake structures; (<b>i</b>) Displacement time history.
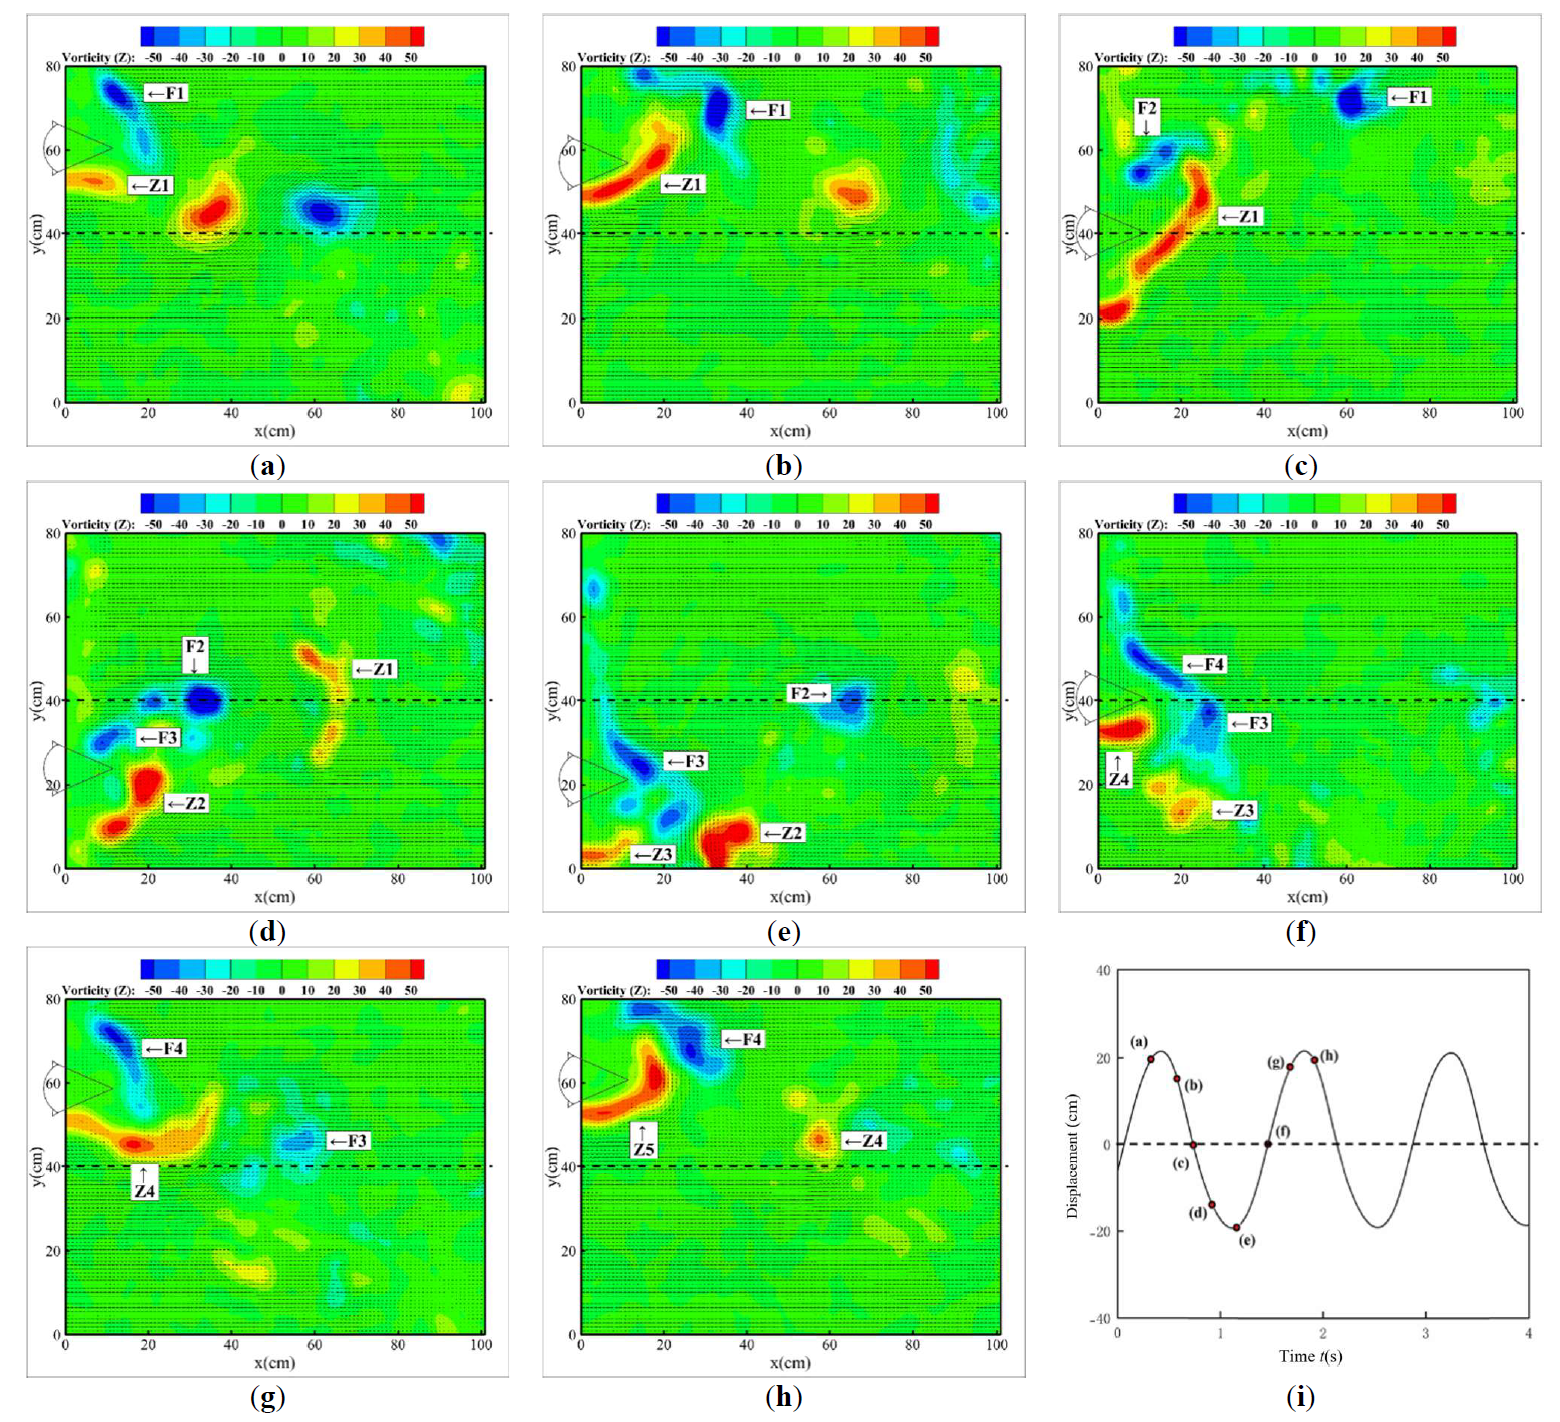
(2) The wake of the oscillator with
α = 1.25:1 in an oscillation period is shown in . The wake mode is 3P, that is, in an oscillation period, as the oscillator vibrates up and down, the wake appears as three pairs of vortices in both positive and negative directions and becomes more broken.
. The wake structures of the oscillator with α = 1.25:1. (<b>a</b>–<b>h</b>) Instantaneous wake structures; (<b>i</b>) Displacement time history.
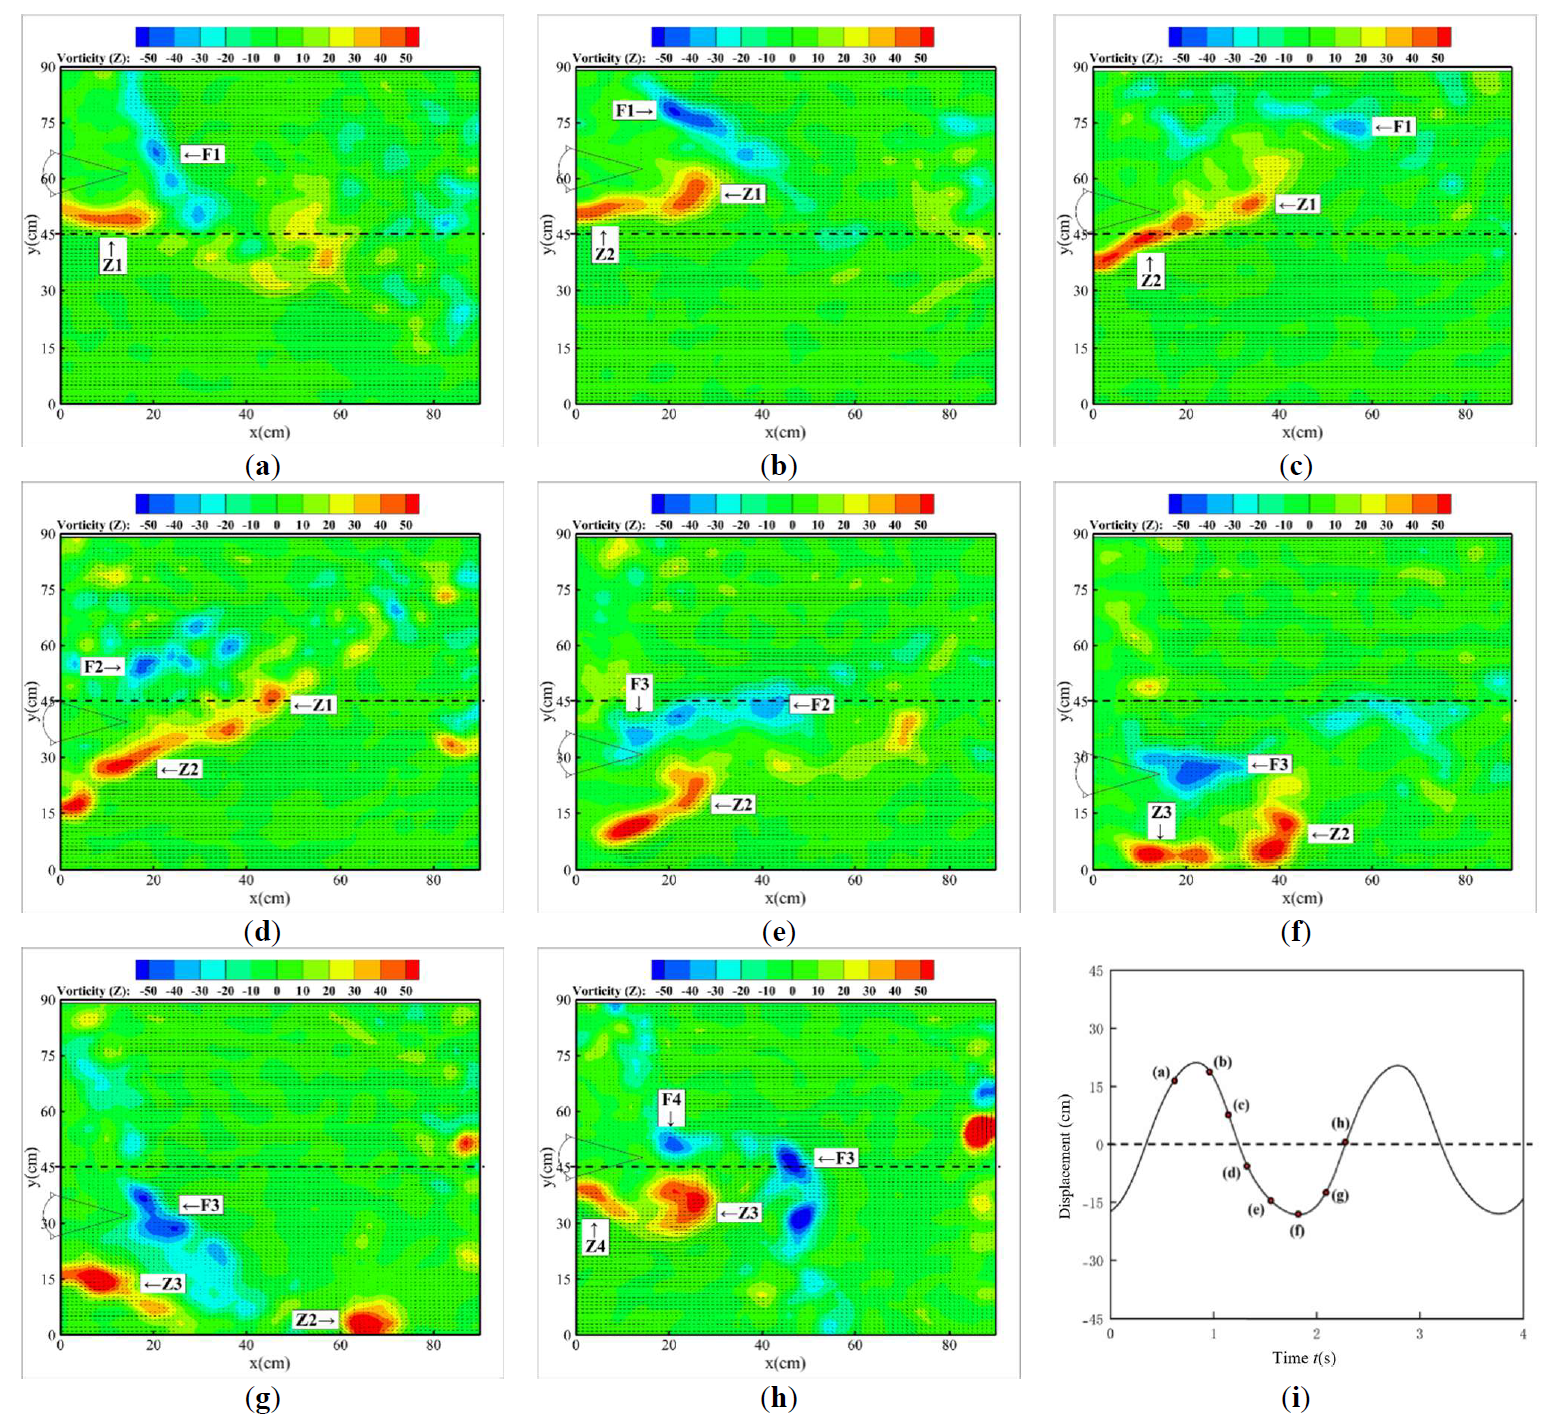
(3) The wake of the oscillator with
α = 1.5:1 in an oscillation period is shown in . The wake mode is 3P, that is, in an oscillation period, as the oscillator vibrates up and down, the wake appears as three pairs of vortices in both positive and negative directions, and the scale becomes larger.
. The wake structures of the oscillator with α = 1.5:1. (<b>a</b>–<b>h</b>) Instantaneous wake structures; (<b>i</b>) Displacement time history.
(4) The wake of the oscillator with
α = 1.75:1 in an oscillation period is shown in . The wake mode is 3P, that is, in an oscillation period, as the oscillator vibrates up and down, the wake appears as three pairs of vortices in both positive and negative directions. The time for vortex growth, development, and final shedding becomes longer, and the time for the development and shedding of positive vortices is longer than that of reverse vortices, resulting in a pressure difference and a longer oscillation period.
. The wake structures of the oscillator with α = 1.75:1. (<b>a</b>–<b>h</b>) Instantaneous wake structures; (<b>i</b>) Displacement time history.
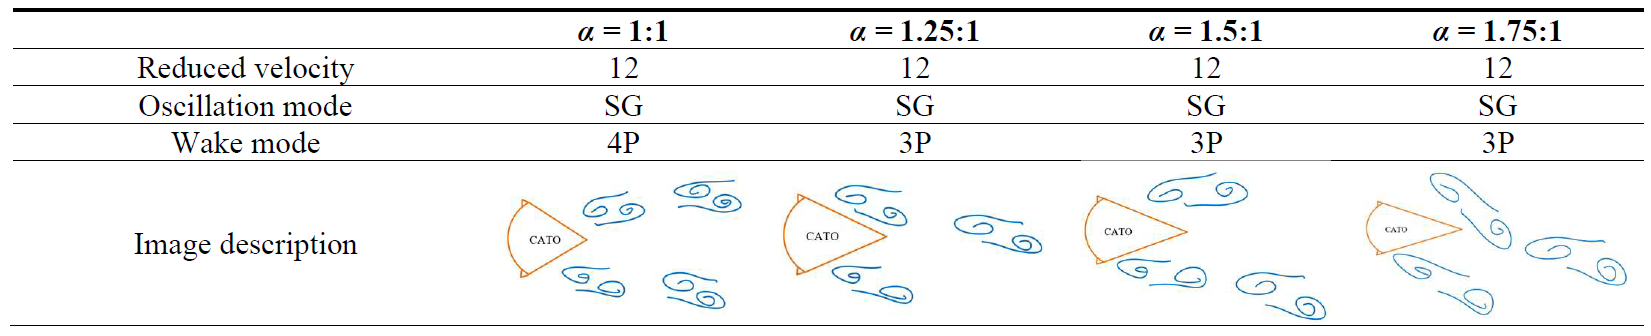
In the SG, the summary of the wake structures is shown in when the reduced velocity is 12.
. Summary of wake structures.
It is evident that the oscillator with a small aspect ratio produces more vortex shedding. At the same reduced velocity, the wake modes of the four forms of oscillators are similar, and the oscillation is very stable.
5. Conclusions
This paper focused on the flow-induced motion (FIM) and energy harness of CTAO. Additionally, PIV was introduced to capture the wake at different reduced velocity, in order to analyze the wake structures. The FIM, energy harness and wake structures of the CTAO under different working conditions were systematically summarized, which provides theoretical and data support for the optimal oscillators of flow-induced motion tidal energy conversion system.
- (1)
-
Oscillation response: As the system damping ratio increases, the initial starting flow velocity of the CTAO rises, the oscillation intensity is weakened, and the oscillation mode changes from SG and HG to VIV. Conversely, as the aspect ratio increases, the system damping ratio and the reduced velocity range for galloping are expanded, that is, the ability of oscillators to gallop under self-excitation or external excitation is enhanced. Moreover, both the maximum amplitude ratio and the frequency ratio decrease under the same other conditions. When ζ = 0.033, Ur = 12.5, the maximum amplitude ratio A∗ = 2.408 for oscillators with α = 1:1. In the galloping, the frequency ratio f∗ decreases from about 0.73 at α = 1:1 to about 0.5 at α = 1.75:1.
- (2)
-
Optimization of energy harness: When the oscillation is in the same mode and system damping ratio, the power output and the efficiency decrease with the increase of the aspect ratios. However, appropriately increasing the aspect ratio benefits the energy utilization and conversion of the system. The maximum power output Pharn = 16.588 W and the optimal efficiency ηharn = 24.706% appear in oscillators with α = 1.5:1.
- (3)
-
Wake structures: In the SG, the wake mode is not much different, which is 4P or 3P, which means the oscillation is very stable. As the aspect ratio increases: the wake vortex is more broken and its scale increases. However, the force area of oscillators becomes larger, and the vortex attachment phenomenon is more obvious, so the force effect of oscillators is better, and the oscillation is more stable. At the same time, the time for vortex growth, development, and final shedding becomes longer, and the time for the development and shedding of positive vortices is longer than that of reverse vortices, resulting in a pressure difference and a longer oscillation period.
Acknowledgments
Results were obtained from State Key Laboratory of Hydraulic Engineering Intelligent Construction and Operation of Tianjin University.
Author Contributions
Conceptualization, X.Y. (Xiang Yan); Methodology, X.Y. (Xiang Yan); Software, J.X.; Validation, L.J.; Formal Analysis, X.Y. (Xu Yang) and S.N.; Investigation, L.J.; Resources, X.G. and X.Y. (Xiang Yan); Data Curation, X.Y. (Xu Yang) and Y.Y.; Writing—Original Draft Preparation, L.J.; Writing—Review & Editing, X.Y. (Xu Yang), Y.Y., X.G. and X.Y. (Xiang Yan); Visualization, L.J. and J.X.; Supervision, Y.Y. and X.Y. (Xiang Yan); Project Administration, Y.Y. and X.G.; Funding Acquisition, X.Y. (Xu Yang), X.Y. (Xiang Yan) and N.S.
Ethics Statement
Not applicable.
Informed Consent Statement
Not applicable.
Funding
The research was founded by National Key R&D Program of China (Grant No. 2022YFB4200702), Tianjin Science and Technology Plan Project (Grant No. 23ZYQYGX00140), National Natural Science Foundation of China (Grant No. 52409085), the Science and Technology Project of Hebei Education Department (Grant No. BJK2023099) and the Hebei Natural Science Foundation (Grant No. E2022402074).
Declaration of Competing Interest
The authors declare that they have no known competing financial interests or personal relationships that could have appeared to influence the work reported in this paper.
References
1.
Wang C, Zhang Y, Deng Z. Wave power extraction for an oscillating water column device consisting of a surging front and back lip-wall: an analytical study.
Renew. Energy 2022,
184, 100–114.
[Google Scholar]
2.
Su X, Wang X, Xu W, Yuan L, Xiong C, Chen J. Offshore Wind Power: Progress of the Edge Tool, Which Can Promote Sustainable Energy Development.
Sustainability 2024,
16, 7810.
[Google Scholar]
3.
Rusu EVC. Harvesting Offshore Renewable Energy an Important Challenge for the European Coastal Environment.
Sustain. Mar. Struct. 2023,
5, 11–13.
[Google Scholar]
4.
Lian J, Cui L, Fu Q. Offshore Renewable Energy Advance.
Mar. Energy Res. 2024,
1, 10006.
[Google Scholar]
5.
Neshat M, Mirjalili S, Sergiienko NY, Esmaeilzadeh S, Amini E, Heydari A, et al. Layout optimisation of offshore wave energy converters using a novel multi-swarm cooperative algorithm with backtracking strategy: A case study from coasts of Australia.
Energy 2022,
239, 122463.
[Google Scholar]
6.
Yang L, HAAS KA, FRITZ HM. Theoretical Assessment of Ocean Current Energy Potential for the Gulf Stream System.
Mar. Technol. Soc. J. 2013,
47, 101–112.
[Google Scholar]
7.
Bernitsas MM. Harvesting energy by flow included motions. In Springer Handbook of Ocean Engineering, 1st ed.; Dhanak MR, Xiros NI, Eds.; Springer: Cham, Switzerland, 2016; pp. 1163–1244.
8.
HAAS K. Assessment of Energy Production Potential from Ocean Currents Along the United States Coastline (Report No. DOE/EE/2661-10); Georgia Institute of Technology: Atlanta, GA, USA, 2013.
9.
Williamson CHK, Govardhan R. Vortex-Induced Vibrations.
Annu. Rev. Fluid Mech. 2004,
36, 413–455.
[Google Scholar]
10.
Sarpkaya T. A Critical Review of the Intrinsic Nature of Vortex-Induced Vibrations.
J. Fluids Struct. 2004,
19, 389–447.
[Google Scholar]
11.
Bearman PW. Circular Cylinder Wakes and Vortex-Induced Vibrations.
J. Fluids Struct. 2010,
27, 648–658.
[Google Scholar]
12.
Lekkala MR, Mohamed L, Hafiz MFU, Kim, DK. A practical technique for hydrodynamic coefficients modification in SHEAR7 for fatigue assessment of riser buoyancy modules under vortex-induced vibration.
Ocean Eng. 2020,
217, 107760.
[Google Scholar]
13.
Lekkala MR, Latheef M, Jung JH, Coraddu A, Zhu H, Srinil N, et al. Recent advances in understanding the flow over bluff bodies with different geometries at moderate Reynolds numbers.
Ocean Eng. 2022,
261, 111611.
[Google Scholar]
14.
Wang J, Geng L, Ding L, Zhu H, Yurchenko D. The state-of-the-art review on energy harvesting from flow-induced vibrations.
Appl. Energy. 2020,
267, 114902.
[Google Scholar]
15.
Wang J, Sun S, Tang L, Hu G, Liang J. On the use of metasurface for Vortex-Induced vibration suppression or energy harvesting.
Energy Convers. Manag. 2021,
235, 113991.
[Google Scholar]
16.
Zhu H, Tang T, Gao Y, Zhou T, Wang J. Flow-induced vibration of a trapezoidal cylinder placed at typical flow orientations.
J. Fluids Struct. 2021,
103, 103291.
[Google Scholar]
17.
Bernitsas MM, Raghavan K, Ben-Simon Y, Garcia EMH. VIVACE (Vortex Induced Vibration Aquatic Clean Energy): A new concept in generation of clean and renewable energy from fluid flow.
J. Offshore Mech. Arct. Eng. 2008,
130, 041101.
[Google Scholar]
18.
Bernitsas MM, Ben-Simon Y, Raghavan K, Garcia EMH. The VIVACE converter: model tests at high damping and Reynolds number around 105.
J. Offshore Mech. Arct. Eng. 2009,
131, 011102.
[Google Scholar]
19.
Park H, Kumar R, Bernitsas MM. Enhancement of flow-induced motion of rigid circular cylinder on springs by localized surface roughness at 3.0 × 10
4≤Re ≤ 1.2 × 10
5.
Ocean Eng. 2013,
72, 403–415.
[Google Scholar]
20.
Chen Z, Alam MM, Qin B, Zhou Y. Energy harvesting from and vibration response of different diameter cylinders.
Appl. Energy 2020,
278, 115737.
[Google Scholar]
21.
Feng W, Yang X, Yan X, Li L. Investigation on Flow-Induced Rotation of Coupled Double Cylinders Arranged in Tandem. In Proceedings of the ASME 2024 43rd International Conference on Ocean, Offshore and Arctic Engineering, Singapore, 9–14 June 2024.
22.
Zhang J, Liu F, Lian J, Yan X, Ren Q. Flow Induced Vibration and Energy Extraction of Equilateral Triangle Prism at Different System Damping Ratios.
Energies 2016,
9, 938.
[Google Scholar]
23.
Yan X, Lian J, Liu F, Ren Q, Zhang J, Shao N. Experimental investigation on the galloping characteristics of the T-section prism.
J. Vib. Eng. 2019,
32, 431–438. (In Chinese)
[Google Scholar]
24.
Lian J, Wu Z, Yao S, Yan X, Wang X, Jia Z, et al. Experimental Investigation of Flow-Induced Motion and Energy Conversion for Two Rigidly Coupled Triangular Prisms Arranged in Tandem.
Energies 2022,
15, 8190.
[Google Scholar]
25.
Ran D, Lian J, Yan X, Liu F, Shao N, Yang X, et al. Flow-Induced Motion and Energy Conversion of the Cir-T-Att Oscillator in a Flow Field with a High Reynolds Number.
J. Mar. Sci. Eng. 2023,
11, 795.
[Google Scholar]
26.
Liu F, Xiang J, Yan X, Feng W, Shao N, Wang X. Experimental study on the flow-induced motion of a “circle-triangle-attachment” combined section oscillator.
J. Vib. Shock 2025,
44, 55–64. (In Chinese)
[Google Scholar]
27.
Yan X, Lian J, Liu F, Wang X, Shao N. Hydrokinetic energy harness of Flow-induced motion for triangular prism by varying magnetic flux density of generator.
Energy Convers. Manag. 2021,
227, 113553.
[Google Scholar]
28.
Shao N, Lian J, Liu F, Yan X, Li P. Experimental investigation of flow induced motion and energy conversion for triangular prism.
Energy 2020,
194, 116865.
[Google Scholar]
29.
Lian J, Ran D, Yan X, Liu F, Shao N, Wang X, et al. Hydrokinetic energy harvesting from flow-induced motion of oscillators with different combined sections.
Energy 2023,
269, 126814.
[Google Scholar]
30.
Lian J, Yan X, Liu F, Zhang J, Ren Q, Yang X. Experimental investigation on soft galloping and hard galloping of triangular prisms.
Appl. Sci. 2017,
198, 1–27.
[Google Scholar]
31.
Williamson CHK, Roshko A. Vortex formation in the wake of an oscillating cylinder.
J. Fluids Struct. 1988,
2, 355–381.
[Google Scholar]
32.
Williamson CHK, Jauvtis N. A high-amplitude 2T Mode of vortex-induced vibration for a light body in XY motion.
Eur. J. Mech. B/Fluids 2004,
23, 107–114.
[Google Scholar]