Over the years a variety of WQIs were developed, using different water quality parameters, as each WQI was developed either for a specific water resource type or to simplify water quality assessment. This section includes a short presentation of each WQI.
2.1. Horton
The Horton WQI was the first one developed, which included as parameters dissolved oxygen (DO), pH, fecal coliforms (FC),
Escherichia coli (
E. coli), electroconductivity (EC), total dissolved solids (TDS), alkalinity, Cl-, chloroform extract (CCE), temperature, and apparent pollution (color, odor, oil, foam) [
27]. Horton utilized a linear scaling function, assigning sub-index values on a 0–100 scale to represent concentration or contamination levels, with 0 as the lowest quality and 100 indicating excellence [
81]:
The WQI rating scale includes five categories: Very good (91–100), good (71–90), poor (51–70), bad (31–50), and very bad (0–30). Temperature contributes to determining the coefficients
m1 and
m2, with
m1 taking the value 0.5 when the temperature is above 34 °C and 1.0 when it’s below 34 °C [
46,
82].
2.2. NSF
NSFWQI, based on the Delphi technique, assesses surface water quality utilizing nine parameters: BOD, DO, NO
3-, total phosphate (TP), Temp., turbidity (TU), total solids (TS), pH, and FC [
82]. As time progresses, some parameters were substituted due to environmental issues, such as TS replaced by TDS or total suspended solids (TSS), TP by PO
4-P, and FC by
E.
coli [
83].
NSFWQI value is calculated using weighting factors, rating curves, and water quality factors through the following equations (Equations (2)–(4)) [
84,
85]:
where,
Ii = each parameter indicator,
Wi = weighting factor,
Qi = parameter evaluation value,
i and
n = number of individual indicators
NSFWQI classifies water quality into five categories: excellent (90–100), good (70–89), medium (50–69), bad (25–49), very bad quality (0–24) [
85,
86].
2.3. SRDD
The extensive utilization of the SRDD index in temperate and tropical-subtropical regions is attributed to its flexibility and regional applicability. It depends on eleven water quality parameters, chosen using the Delphi technique, grouped into four categories: physical (Temperature, conductivity, SS), chemical (DO, pH, NH
3-N and sal NH
3), organic (total oxide, N, P), and microbiological (BOD, EC) [
49,
51,
52]. The SRDD equation is used for its calculation:
where
SiWi = sum of the products of the water quality ratings and
Wi = weighting of each individual parameter. SRDD classification: clean (90–100), good (80–89), good with treatment (70–79), tolerable (40–69), polluted (30–39), several polluted (20–29), piggery waste (0–19) [
27,
49,
50,
51,
52,
87].
2.4. Dinius
The multiplicative WQI, progressed through the Delphi technique, can be used in six water use categories (public supply, recreational, fish and shellfish, agriculture, and industry). It includes twelve parameters, including DO, BOD,
E. coli and coliform concentration, pH, alkalinity, hardness, chlorides (Cl
−), specific conductivity (S.Cond), Temperature, color, and NO
x- [
53,
88,
89]. Dinius WQI index value is determined using this equation:
where
Ii = pollutant parameter subindex function,
Wi = unit weight pollutant parameter (ranging from 0 to 1), and
n = number of pollutant parameters [
53,
88,
89].
2.5. Malaysian
The index is calculated based on six standard physicochemical parameters: pH, DO, BOD, COD, NH
3-N, and SS. These parameters are chosen by experts, and for each parameter, a quality function (sub-index) can be determined [
55,
90,
91]. The sub-indices are then combined to calculate the WQI using a specific equation:
where
SIDO = DO (% saturation),
SIBOD = BOD,
SICOD = COD,
SIAN = NH
3-N,
SISS = SS and
SIpH = pH.
MWQI (2020) classifies surface water quality into three groups: Clean (81–100), slightly polluted (60–80), and polluted (0–59) [
54,
90,
91].
2.6. Ross
The WQI is determined using four parameters: BOD
5, NH
3-N, SS and DO. These parameters were selected based on prior research and using the Delphi technique. The equation used for calculating this index is as follows:
where
Pi = degree of each parameter and
Wi = weight of each parameter.
Ross WQI categorizes river water quality into eleven levels, with higher values indicating better quality and lower values indicating poorer quality, including light pollution, moderate pollution, severe pollution, and poor quality [
17,
56,
92].
2.7. Bascaron
BWQI includes 26 parameters for its calculation, including pH, BOD
5, Temp., TC, color, Turb., permanganate reduction, detergents, hardness, DO, pesticides, oil and grease, SO
4-, NO
3-, CN-, Na, free CO
2, NH
3-N, Cl, Cond., Mg, P, NO
2-, Ca, and apparent aspect [
49]. This modified index has found application in various countries, such as Argentina, Chile, Brazil, India, Spain, and Turkey [
5,
31,
57]. The Ross WQI, initially encompassing 26 parameters, provides flexibility by permitting the removal or replacement of specific parameters to suit the specific attributes of the water system under assessment [
49,
92,
93]. The comprehensive index is determined subjectively using the following equation:
In the equation,
n represents the total number of parameters,
Ci is the value assigned to parameter
i after normalization, and
pi indicates the relative weight assigned to every parameter. The relative weight ranges from 1 to 4, with 4 signifying the highest impact and 1 suggesting the least impact on water quality [
31,
94,
95,
96].
2.8. Oregon
OWQI is a broadly recognized, easy to use index designed for assessing water quality in recreational activities like fishing and swimming. It incorporates eight parameters selected using the Delphi method: Temp., DO, BOD, pH, NH
4, NO
3, TP, TS, and FC. Cube later improved the index for surface water quality classification in the region. Particularly, OWQI doesn’t use weighting factors, making it a straightforward tool for water quality assessment [
43,
82,
97].
In its initial form, the OWQI uses a weighted mean numerical function, as follows:
The improved version of OWQI adapts to variable changes into account by assigning the greatest weight to the parameter that has undergone the most significant change, ensuring its prominent effect on the index. This updated equation recognizes that different water quality variables may contribute differently to overall water quality in various locations and at different times. The equation for the improved OWQI is as follows:
where
n = number of subindices and
SIi = sub index
i. Based on the calculated index values, the classification of water quality is as follows: excellent (90–100), good (85–89), fair (80–84), bad (60–79), very bad (below 60) [
43,
82].
2.9. Bhargava
Simplification methods, such as the Bhargava method, strive to make water quality assessment user-friendly. This method categorized parameters into four sets based on raw water data from the Yamuna River in Delhi, India [
58]. Each group evaluates specific types of parameters. The simplified WQI is represented by the following equation:
where
fi (
Pi) = sensitivity function for each parameter including the effect of the variable weight concentration associated with a specific activity and ranges from 0 to 1,
n = number of parameters. The Bhargava index’s categorization for various water uses is as follows: I (90 and above), II (65–89), III (35–64), IV (11–34), V (10 or lower). Permissible categories for water use include only Class I and Class II [
58,
62,
98].
2.10. House
HWQI represents an improved version of the NSFWQI, assessing nine water quality parameters (DO, NH
4-N, BOD, SS, NO
x−, Temp., Cl, and TC). The Delphi technique is used to determine the weights assigned to these parameters. The equation is calculated as follows:
where
n = number of sub-indicators,
qi =
i value of the sub-indicator and
wi =
i-weight value and
w1+
w2 +
w3+ …+
wn = 1.
House index classifies river water quality into categories based on index values: high (71–100), reasonable (51–70), polluted (31–50), badly polluted (10–30) [
27,
59,
99,
100,
101].
2.11. Ganga
This WQI was created to evaluate the Ganga River’s water quality in India. It uses a modified version of the NSFWQI standard and considers four crucial parameters: DO, BOD, pH, and FC. This index helps identify areas in need of anti-pollution measures and provides a comprehensive evaluation of water quality along the river (CPCB, 2000). The equation for determining the overall index is outlined below:
where,
P = number of quality parameters,
Ii = sub-index for the
i-water quality parameter, $$W_{i}$$ = weight associated with the
i-parameter [
60,
102]. Based on the final values of the Ganga index, water quality is classified into the following categories: excellent (90 and above), permissible (65–89), marginally suitable (35–64), inadequate for use (11–34), totally unsuitable (10 or lower) [
60,
103].
2.12. Smith
SWQI evaluates the suitability of water for multiple uses, including swimming, water supply, fish spawning, and aquatic life protection. It emphasizes the protection of aquatic ecosystems by selecting the parameter with the lowest score for establishing the final index. The Delphi method was used to select parameters for various, ensuring a systematic and well-informed approach to water quality assessment and management [
61,
62,
104,
105].
Smith proposed an alternative method to overcome the potential limitation of a multiplicative WQI. This method employs the minimum operator for index aggregation, avoiding a single parameter with a low value from disproportionately reducing the overall index score [
61]. The Smith index is expressed by the following equation:
where
I = sub-index of the
ith parameter.
The simplicity of the Smith index’s application, which relies on the addition or subtraction of determinants, makes it easy to use. However, this simplicity comes with a potential drawback, as a single low-value indicator can disproportionately impact the overall score [
62,
104,
105].
2.13. ATI (Aquatic Toxicity)
ATI, developed for the evaluation of aquatic ecosystems, incorporates diverse indicators related to fish toxicity and toxic effects. These indicators encompass a wide range of water quality parameters, including physical factors such as pH, DO, and Turb., alongside chemical parameters such as NH
3-N, TDS, F, K, orthophosphates (PO
4), and hazardous metals like Zn, Mn, Cr, Cu, Pb, and Ni [
63,
106,
107]. The index’s formula is used to provide a comprehensive evaluation of the overall condition of the aquatic ecosystem:
where,
I = final index score,
qi = quality of the
i-parameter (a value between 0–100),
n = number of determinants. Not used for the calculation of this index is the classical weighted sum system, as there is not enough valid information about the importance of one determining factor in relation to the other in different conditions prevailing in different regions and the inherent chemistry of the system [
62,
64].
2.14. Dojildo
This index distinguishes between basic parameters, consistently used, and additional parameters, applied only in specific circumstances. The primary parameters, identified as frequently evaluated and significantly impactful in assessing water quality, include BOD
5, SS, P, NH
4, DS, COD, and DO. Supplementary parameters are introduced into the index calculation when their unit indicators indicate poorer water quality compared to the basic parameters. These parameters include Fe, phenols, organic nitrogen, hardness, Mn, pH, SO₄
2−, Cl, COD, NO
3−, Pb, Hg, Cu, Cr, Zn, Cd, Ni, and free CN
−. The quantity of parameters considered significantly impacts the resulting index value [
27,
65,
82]. The aggregation formula for the Dojildo Index is expressed as:
where
n = number of indices considered and
Si = unit index of parameter
i. This calculation method was selected because the average assigns a high statistical value to the parameter exhibiting the least favorable value, considering all parameters. Additionally, averaging provides the advantage of eliminating the weight of the various parameters [
27,
65,
82].
2.15. British Columbia
BCWQI includes three essential components: range (quantity of variables not achieving water quality goals), frequency (how often those goals are not reached), and amplitude (the extent of deviation from the goals). It provides a numerical value ranging from 0 (indicating poor water quality) to 100 (representing excellent water quality) to evaluate the overall water quality [
17,
108]. The equation used to calculate the final value of CCME is as follows:
where F
1 (Scope) = percentage of variables that do not meet their targets at least once during the time under consideration (“failed variables”). F
2 (Frequency) = percentage of individual tests that do not meet the targets (“failed tests”). F
3 (Amplitude) = amount by which the failed test values do not meet their targets. The 1.732 divisor normalizes the resulting values to a range between 0 and 100, where 0 represents the “worst” water quality and 100 the “best” water quality [
17,
71,
108,
109].
2.16. CI (Groundwater Contamination)
CI was formulated for groundwater quality, following European Environment Agency guidelines and EPA permissible limits, summing factors that exceed these standards. The CI designation is derived from the Mexican standard NOM-127-SSA1-1994 [
62,
67] and evaluates and maps groundwater contamination by examining ion concentrations and chemical species that surpass maximum levels established for water quality suitable for human consumption. It is calculated as the sum of individual components that exceed the values set in this standard [
62,
67].
While WQIs for surface water quality use the most commonly used quality indicators (e.g., BOD, SS, nitrogen and FC), CI includes a greater number of parameters, which also include trace metals, due to the significance they have in groundwater quality and contamination. Finland has developed two groundwater contamination indicators, one focusing on evaluating health risks and including the parameters: F
−, NO
3−, UO
22−, As, B, Ba, Cd, Cr, Ni, Pb, Rn, and Se, the other indicator assessing technical and aesthetic considerations: pH, KMnO
4 consumption, SO
42−, Cl
−, Ag, Al, Cu, Fe, Mn, Na, and Zn.
In contrast, Slovakia employs a singular groundwater contamination index, determined by the parameters: TDS, SO
42−, Cl
−, F
−, NO
3−, NH
4+, Al, As, Ba, Cd, Cr, Cu, Fe, Hg, Mn, Pb, Sb, Se, and Zn. The value of the index is calculated using the following equation:
where
Cfi represents the contamination factor for the
ith component,
CAi stands for the analytical value of the
ith component, and
CNi represents the permissible upper concentration of the
ith component (with “
N” indicating the normal value). Groundwater contamination severity is categorized on a three-point scale: low (<1), medium (1–3), and high (>3) [
62,
67].
2.17. Dalmatian
To calculate the DWQI, the evaluation of water quality for a particular water body is divided by the assessment meeting Croatia’s national standards for first-class water. DWQI is calculated based on nine parameters: Temp., mineralization, corrosion coefficient K, DO, BOD, TN, protein nitrogen, TP and total coliform (TC) bacteria (MPN coli/100 mL). The final index is calculated by aggregating all these parameters to evaluate water quality in the examined water system [
68]. The DWQI is calculated with the following equation:
The water quality evaluation (WQE) is determined by summing individual quality evaluations (
qi) and assigning weights to these parameters to derive the overall quality evaluation (
wi). This method is an adapted form of the SRDD index and is expressed by the following equation:
where
qi = water quality score of parameters
i,
wi = weighting factor of parameter
i and
n = number of parameters [
68,
110].
2.18. CCME
It’s a widely recognized surface water quality index for its flexibility in parameter selection. It uses four parameters, selected according to water system characteristics and expert evaluation. Significantly, it doesn’t involve calculating parameter indicator as seen in other models [
60,
111,
112].
CCMEWQI evaluates factors like sampling frequency, frequency of not meeting target values, and parameter deviations to assess water quality. It aids in organizing data across all parameters, functioning as evaluating multi-dimensional water quality data. This simplified WQI uses a pre-programmed equation to evaluate the present condition of a water system, making it user-friendly for authorities to monitor changes in water quality [
69,
111,
113].
The index is calculated by applying the following equation and considering 3 factors F1 (range), F2 (frequency) and F3 (amplitude):
The divisor 1.732 normalizes the WQI to a range from 0 to 100, with 0 indicating poor water quality and 100 indicating excellent quality. This factor is based on the maximum possible values of the three index factors (F
1, F
2, and F
3), each having a maximum of 100. Consequently, the maximum numerator value is 1.732. [
46].
The three factors, F
1, F
2 and F
3 are defined as:
F
1: “range”, is the percentage of total parameters that do not meet the specified targets. It is expressed as:
F
2: “frequency”, is the percentage of individual test values that do not meet the target values (failed tests). It is expressed as:
F
3, or “amplitude,” measures the deviation of test values from their targets. It is calculated using an asymptotic function that scales the normalized sum of the paths (
nse) of the test values from the targets, resulting in a value between 0 and 100:
If a test value falls below the objective value, the deviation for that test value is determined as:
Conversely, if the test value surpasses the objective value, the excursion value is calculated as:
νse is the collective deviation of individual test values from their targets, calculated as the sum of deviations from targets, divided by the total number of tests, including those that meet and don’t meet their respective targets:
Based on CCMEWQI values, water quality is classified as excellent (95–100), good (80–94), fair (65–79), borderline (45–64), and poor (0–44) [
27,
113,
114].
2.19. OIP (Overall Index of Pollution)
OIP was developed by India’s National Environmental Research Institute (NEERI) for the assessment of surface water quality. It includes the parameters: pH, Turb., DO, BOD, hardness, TDS, TC, As, and F- using data from Indian river measurements [
115,
116]. OIP is calculated as the average of all pollution indices (
Pi) for an individual parameter and is shown in the equation:
where
Pi = pollution index for
ith parameter
i = 1, 2, . . .,
n and
n = number of parameters.
Water quality was graded as: excellent (0–1, Class C1), acceptable (1–2, Class C2), slightly polluted (2–4, Class C3), polluted (4–8, Class C4), heavily polluted (8–16, Class C5) according to Indian standards and/or other accepted guidelines (World Health Organization and European Community Standards) [
70,
115,
117].
2.20. Liou
LWQI was developed to evaluate the quality of river water in Taiwan, considering agricultural, industrial, and urban pollutants. It provides a proficient grading system. The calculation involves measurements from environmental monitoring and rating curves. Major parameters such as organics, particles, and microorganisms are analyzed and correlated. The final index considers three parameters: pH, Temp., and toxic substances. Classifying parameters aids in avoiding overlap and ambiguity concerns [
41,
49]. The aggregation function was derived through mathematical processing of the data, shown below:
Sub-index values are assigned based on the parameters they represent. For ‘organics’ (DO, BOD
5, and NH
3-N), sub-indices
I1,
I2, and
I3 are used. ‘Particulates’ (SS and Turb.) is represented by sub-indices
Ij. Fecal coliform under ‘microorganisms’ is denoted as
Ik. The geometric mean is utilized for the extracted components. Scaling factors (
Ctem,
CpH, and
Ctox) are also included in the calculation [
49].
2.21. Said
SWQI consists of only five parameters and doesn’t require standardization or sub-indices. Its development consisted of two stages: evaluating the significance of parameters such as DO, TP, FC, Turb., and S.Cond.; and weight ranking tests, which gave DO the highest weight, followed by fecal coliform and total phosphorus, while turbidity and specific conductivity had the lowest influence on the index calculation [
17,
26,
27,
71] The aggregation function was obtained after mathematically processing the data, as shown below:
where
DO is DO (% oxygen saturation);
Turb is Turbidity (Nephelometric turbidity units [NTU]);
TP is total phosphate (mg/L);
FCol is fecal coliform (counts/100 mL);
SC is specific conductivity in (S/cm at 25 °C).
SWQI ranges from 0 to 3, with 3 representing ideal water quality. Scores between 3 and 2 indicate acceptable quality, while values below 2 suggest marginal quality, requiring additional treatment. If one or two parameters decline, the index falls below 2, and when the majority of parameters deteriorate, it decreases to values below 1, signifying poor water quality [
27,
71].
2.22. Universal
UWQI is a simplified indicator that evaluates the overall suitability of surface water for human use. It selects parameters according to expert opinions and international water quality standards. Important parameters include Cd, CN-, Hg, Se, As, F-, NO
3−, DO, BOD, P, pH, and TC. Microbiological parameters carry greater weight in the calculations due to their significant impact on public health when present in drinking water [
92,
118,
119]. The aggregation function is expressed as follows:
where
Wi = weight for parameter
I,
Ii = subscript for parameter
i.
The classification of surface water for human consumption based on UWQI values is excellent (95–100), good (75–94), fair (50–74), marginal (25–49) and poor (0–24) [
92,
118].
2.23. Hanh
Two indicators in Vietnam: WQI
B and WQI
O. WQI
B evaluates spatial and temporal water quality, considering the parameters SS and DO. WQI
O focuses on toxic substances such as CN- and heavy metals [
27,
72,
82]. Following the above, the concentration function suggested for the basic WQI (WQI
B) is as follows:
where
qi is the index value of organic and nutrient components,
qj, the index value of the particle group and
qk, the index value of bacteria.
Both the basic and additional groups of parameters are subsequently utilized to calculate the overall WQI (WQI
O). Therefore, the following WQI
O aggregation formula is as follows:
where
Ci are the coefficients concerning the sub-indicators T
w (water temperature), pH and toxic substances, and
n, the number of coefficients. Therefore, based on the WQI
B or WQI
O score water quality can be classified as follows: 91–100, excellent water quality; 76–90, good water quality; 51–75, fair; 26–50, marginal; and 1–25 is poor water quality [
72].
2.24. Almeida
For AWQI, select parameters associated with swimming and health hazards. Careful selection mitigates issues from additional variables and addresses ambiguity. Use score curves to establish connections between swimming-related illnesses and the index [
17,
27,
73,
120]. The calculation of RWQI can be determined using the following equation:
where,
Qi is the rating value of parameter
i,
Wi, the weighting coefficients (Σ
Wi = 1) and Wi the effect of each parameter on the total value of the index.
To calculate each of them, their individual weight must be considered, which is calculated using the following formula:
where,
Wi, the weighting coefficient (Σ
Wi = 1) and
Wi is the effect of each parameter on the total value of the index. RWQI values fluctuate with parameter weights ($$a_{i}$$ coefficients 1 to 4). Multiply parameter values with sub-indices (
QI Wi) to obtain value ranges from 0 to 100. Higher values indicate superior quality [
27,
62,
73].
2.25. West Java
WJWQI evaluates river water quality in West Java using the non-equal geometric method chosen for its simplicity and accuracy. Parameters are selected based on expert opinions and assigned weights using the Analytic Hierarchy Process (AHP). Six categories encompass a total of thirteen parameters: physical, oxygen depletion, nutrients, organic, minerals, and microbiological. The WJWQI aids in precisely evaluating the overall river water quality in West Java [
74,
121,
122]. The final index value is calculated using the following equation:
where
AI is the aggregate index,
n, the number of sub-indices,
wi, the weight and
Si the sub-indicator
i. The weights (
wi) reflect the importance of each water quality parameter in the index. The WJWQI score classifies water quality into categories: excellent (90–100), good (75–90), fair (50–75), marginal (25–50), and bad (5–25).
WJWQI serves as an effective water quality index for West Java’s rivers and is widely used to evaluate the overall river water quality [
74].
All WQIs developed over the years tried to provide an easy and quick methodology for water quality assessment, nevertheless, WQIs have certain advantages and limitations. Specifically, the most commonly used WQIs, such as Horton NSF, Dinius, Malaysian, Ross Bascaron and Oregon use common water quality parameters (e.g., DO, pH, BOD, TDS, alkalinity and the major ions) to assess water quality status, therefore, they exclude major pollutant (e.g., heavy metals) from their assessment. Thus, in many cases, they can’t safely estimate water quality. Other WQIs (e.g., Bhargana, House, ATI, Dojido, BCWQI, UWQI, WJ) tried to overcome these limitations by adding more water quality parameters (e.g., heavy metals and specific pollutants) in their analysis or by using a set of parameters in order also to increase the water quality parameters used. Their main limitation was the lack of data availability for all the water quality parameters. More details about the use of WQI are provided in the following discussion.
While various WQIs have been developed over the years, only a few are used more frequently either due to their simplicity or to data availability. Specifically, from 2013 until now, the most frequently employed water quality assessment indices in the literature include CCMEWQI and NSFWQ [
26,
82,
123,
124] ().
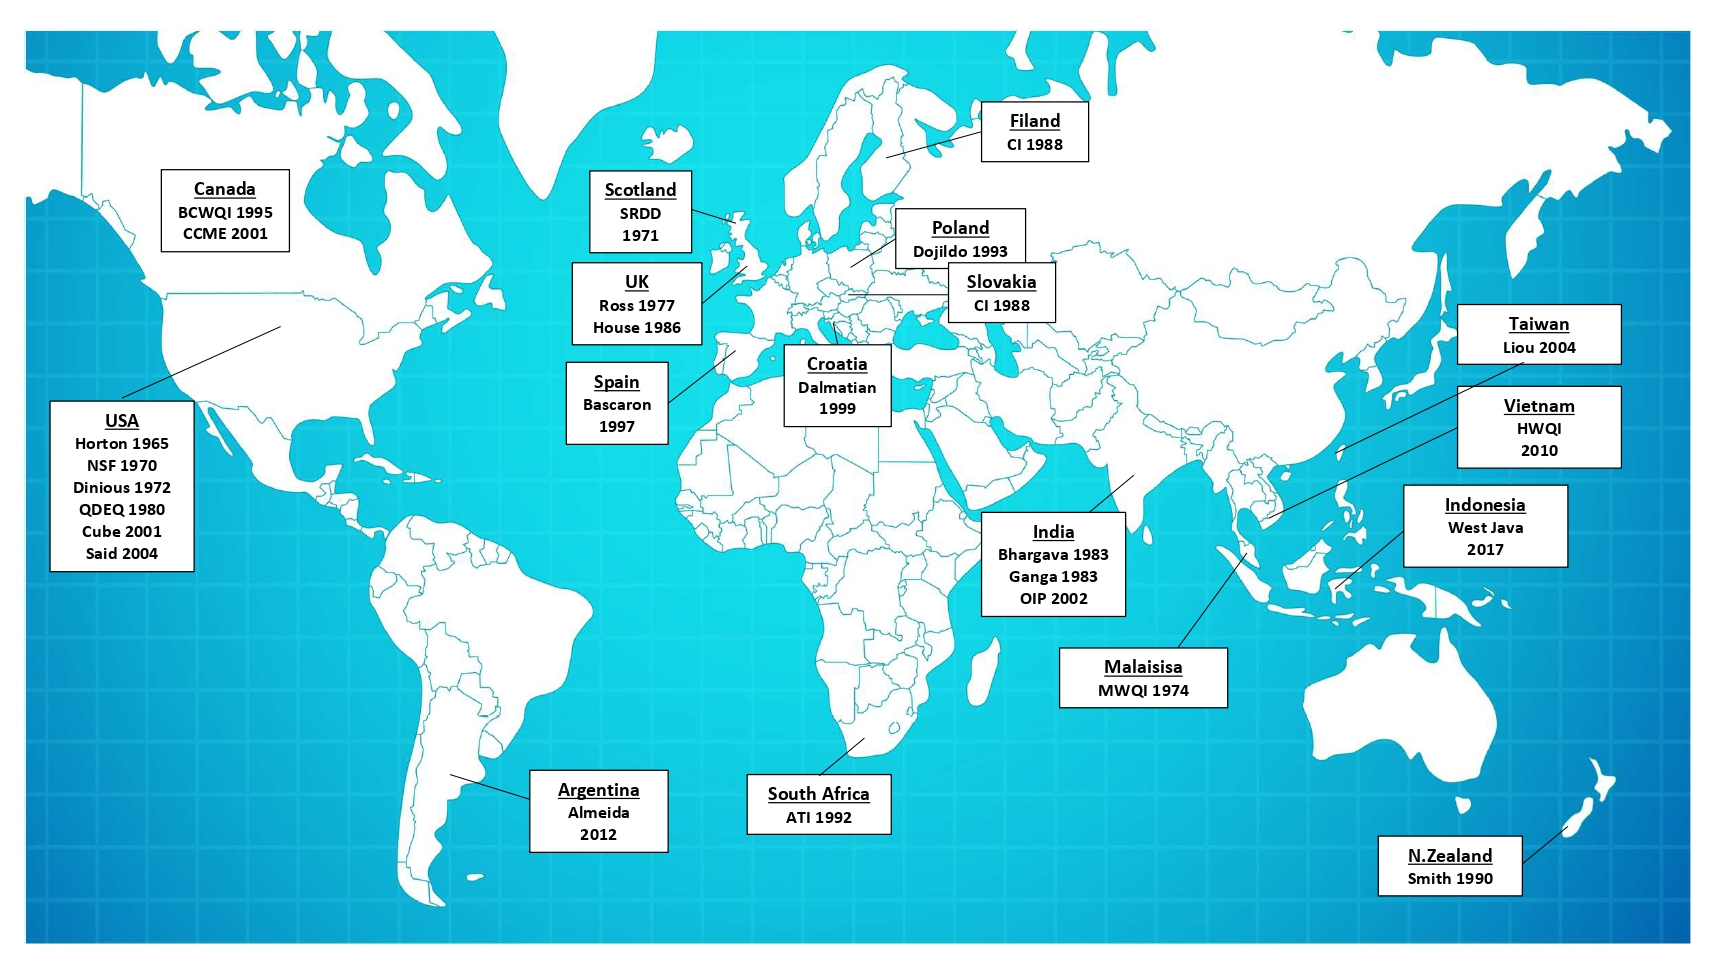
There are no distinct guidelines for the selection of water quality parameters in the development of a WQI. Criteria like oxygen, eutrophication, health, physical and chemical factors, and dissolved constituents influence parameter selection. Common WQI models are listed in over the last 59 years [
27,
82,
92,
98,
125].
Study results provide data for water quality assessment and underscore variations among assessment methods [
7,
21,
125]. The calculation of a WQI in a water system involves determining the sampling points, timeframe, variables, and objectives. It can be utilized at various stations such as those spread across a lake, with data collected for a minimum of one year [
17,
27,
126]. Combined data from different years is possible, but it may result in a loss of variability. Water quality objectives set numerical concentrations to support and protect designated water uses (e.g., drinking water). Parameter selection should consider their significance, relevance to WQI objectives, and data availability [
17,
26,
27,
82,
127], while the sampling points and frequency are also important [
128].
WQIs such as CCMEWQIWQI and BCWQI are widely used for effective water quality assessment, as indicated in , due to their validity, even when parameter values are low [
79,
129,
130]. The NSFWQI index is used for river waters and provides a more representative representation of river water quality [
129,
131,
132]. In recent research in different countries, the NSFWQI index has been utilized to classify water quality [
39,
86,
126]. Chemical analyses of water samples have resulted in the development of water quality indicators tailored to specific regions, enabling regular monitoring to safeguard public health by ensuring the delivery of safe and healthy water to residents [
38,
133,
134].
The quantity of selected parameters on WQIs can differ. For instance, Ross, Ganga, Smith, and CCMEWQI incorporate only four parameters in their calculations, as shown in [
48,
56,
60,
61,
104,
112]. Numerous indices involve the incorporation of ten or more parameters in their development, such as Horton, NSFWQI, SRDD, Dinius, Aquatic Toxicity, BCWQI, Liou, UWQI, Hanh, and West Java [
41,
49,
52,
53,
62,
72,
74,
112,
118,
135]. Certain indices encompass an even greater number of parameters, such as the Bascaron WQI with 26 parameters, the Dojildo WQI with 19 parameters, and CI Slovakia with 19 parameters [
49,
62,
65,
67].
The availability of data related to the examined water body, plays a crucial role in parameter selection for WQI development, with the Delphi technique often used for this particular objective [
112,
136]. Certain indices select parameters by considering the availability of monitoring data and comparison standards (e.g., CI, Hanh, West Java) [
62,
72,
74,
112]. Specific indicates select parameters based on their environmental significance (e.g., Said) and public health (e.g., Liou) () [
41,
71].
Indicators featuring a limited number of parameters, e.g., [
56,
61] prioritize physical parameters such as SS, DO, and BOD, along with turbidity, temperature, and pH. Microbiological parameters, particularly FC, are frequently included as well. In contrast, the CCMEWQI index doesn’t define fixed parameters and their selection depends on the characteristics of the examined water body [
56,
60,
61,
103]. The Bascaron index involves 26 parameters, such as pH, BOD
5, DO, temperature, TC, color, turbidity, permanganate reduction, detergents, hardness, DO, pesticides, oil and grease, SO
4, NO
3, cyanides, sodium, free CO
2, ammonia-N, Cl, conductivity, Mg, P, NO
2, and apparent aspect () [
5,
31,
49,
57].
.
WQI summary.
| WQI |
Num. of Param. |
Param. |
Selection Process |
Sub-Indexing |
Weights |
Aggregation Method |
Classification |
Horton
(1965)
|
10 |
DO, pH, FC, E. coli, EC, TDS alkalinity, Cl-, CCE, Temp., apparent pollution |
Data availability of significant parameters |
|
|
|
|
NSF
(1970)
|
9 |
BOD, DO, NO3−, TP, Temp., TU, TS, pH, FC |
Delphi |
Parameters directly used as sub-indicates |
Unequal weights |
Addictive formula (first version)
Multicave formula (second version)
|
- Excellent (90–100)
- Good (70–89)
- Medium (50–69)
- Bad (25–49)
- Very bad (0–24)
|
SRDD
(1971)
|
10 |
DO, BOD5, NH3-N, sal NH3, pH, TO, TN, TP, SS, Temp., Cond., EC |
Delphi |
Parameters directly used as sub-indicates |
Unequal weights
Sum of weights: 1
|
Addictive mathematical function
Multiplicative NSF formula
|
- Clean (90–100)
- Good (80–89)
- Good with treatment (70–79)
- Tolerable (40–69)
- Polluted (30–39)
- Several polluted (20–29)
- Piggery waste (0–19)
|
Dinius
(1972)
|
12 |
DO, BOD, E. coli, coliform concentration, pH, alkalinity, hardness, Cl−, S. Cond., Temp., color, NOx− |
Delphi |
Parameters directly used as sub-indicates |
Unequal weights Sum of weights: 10 |
Multiplicative function |
- Purification not required (90–100)
- Minor purification required (80–90)
- Treatment required (50–80)
- Doubtful (40–50)
|
Malaysian
(1974)
|
6 |
pH, DO, BOD, COD, NH3-N, SS |
|
Parameters directly used as sub-indicates |
Unequal weights Sum of weights: 1 |
Simple addictive function |
|
Ross
(1977)
|
4 |
BOD5, NH3-N, SS, DO |
Delphi |
Parameters directly used as sub-indicates -rating curves developed by expert’s opinions |
- Unequal weights
- Expert based
- Sum of weights: 10
|
Additive |
Not specified |
Bascaron
(1979)
|
26 |
pH, BOD5, Temp., TC, color, Turb., permanganate reduction, detergents, hardness, DO, pesticides, oil, grease, SO4−, NO3−, CN−, Na, free CO2, NH3-N, Cl, Cond., Mg, P, NO2−, Ca, apparent aspect |
|
Parameters directly used as sub-indicates (linear transformation function) |
Unequal and fixed technique (Sum: 54) |
Modified additive |
- Excellent (90–100)
- Good (70–90)
- Medium (50–70)
- Bad (25–50)
- Very bad (0–25)
|
OWQI
(1980)
|
8 |
Temp., DO, BOD, pH, NH4NO3, TP, TS, FC |
Delphi |
Parameters directly used as sub-indicates |
Unequal weights with sum of weights equal to 1 (first version)
Equal weights (second version)
|
Addictive (first version)
Unweighted—harmonic mean of squares of sub-indices (second version)
|
- Excellent (90–100)
- Good (85–89)
- Fair (80–84)
- Poor (60–79)
- Very poor (<60)
|
Bhargava
(1983)
|
|
4 sets of parameters: coliform organisms, heavy metals, physical, organic-inorganic |
|
Parameters in the same group are aggregated to obtain 4 different group sub-indices |
Unequal weights
Sum of weights is 1
|
Modified multiplicative |
- Permissible (90>)
- Permissible (65–89)
- Not permissible (35–64)
- Not permissible (11–34)
- Not permissible (10<)
|
House
(1986)
|
9 |
DO, NH4-N, BOD, SS, NOx−, Temp., Cl, TC |
Delphi |
Parameters directly used as sub-indicates |
Unequal weights
Sum of weights is 1
|
Additive (SRDD aggregation technique) |
- Hight quality (71–100)
- Reasonable quality (51–70)
- Moderate quality (31–50)
- Polluted (10–30)
|
| Ganga Index (Ved Prakash et al.) (1989) |
4 |
DO, BOD, pH, FC |
|
Parameters directly used as sub-indicates |
Unequal weights Sum of weights: 1 |
Additive |
- Excellent (90>)
- Permissible (65–89)
- Marginaly suitable (35–64)
- Inadequate for use (11–34)
- Totally unsuitable (10<)
|
Smith
(1990)
|
4 |
SS, Turb., Temp., BOD5, FC (fish spawning) |
Delphi |
Parameters directly used as sub-indicates -rating curves developed by expert’s opinions |
Unequal weights Sum of weights: 1 |
Minimum operator function |
Not specified |
| 7 |
DO, SS, Turb., Temp., BOD5, NH3-N, FC (water supply) |
ATI
(1992)
|
14 |
NH3-N, TDS, F, K, PO4, Zn, Mn, Cr, Cu, Pb, Ni |
|
|
|
|
|
Dojildo
(1993)
|
7 |
asic parametres BOD5, SS, P, NH4, DS, COD, DO |
|
Parameters directly used as sub-indicates |
Equal weights |
Square root of the harmonic mean |
- Very clean (75–100)
- Clean (50–75)
- Polluted (25–50)
- Very polluted (0–25)
|
| 19 |
Additional parameters Fe, phenols, organic nitrogen, hardness, Mn, pH, SO₄²−, Cl, COD, NO3−, Pb, Hg, Cu, Cr, Zn, Cd, Ni, CN- |
BCWQI
(1995)
|
10
(at least)
|
Common parameters (at least) |
Open choice system |
Sub-index assign based on expert opinion |
Unequal weights
Expert based
|
Simple specific mathematical formula |
- Excellent (0–3)
- Good (4–17)
- Fair (18–43)
- Borderline (44–59)
- Poor (60–100)
|
CI
Filand
(1998)
|
12 |
F−, NO3−, UO22−, As, B, Ba, Cd, Cr, Ni, Pb, Rn, Se (health-risk) |
Monitoring data availability and comparison standards |
Parameters directly used as sub-indicates |
No used |
|
- Low (<1)
- Medium (1–3)
- High (>3)
|
| 11 |
pH, KMnO4 cons., SO4 2−, Cl−, Ag, Al, Cu, Fe, Mn, Na, Zn. (Technical-aesthetic) |
CI
Slovakia
(1998)
|
19 |
TDS, SO42−, Cl−, F−, NO3−, NH4+, Al, As, Ba, Cd, Cr, Cu, Fe, Hg, Mn, Pb, Sb, Se, Zn |
Monitoring data availability and comparison standards |
Parameters directly used as sub-indicates |
No used |
|
- Low (<1)
- Medium (1–3)
- High (>3)
|
Dalmatian
(1999)
|
9 |
Temp., mineralization, corrosion coefficient, K, DO, BOD, TN, protein nitrogen, TP, TC |
Delphi |
Parameters directly used as sub-indicates |
Unequal weights Sum of weights:
100
|
Automatic index formulas (additives or multiplicative) |
Not
specified
|
CCME
(2001)
|
4 |
without specifying |
Delphi |
No used |
No used |
Fixed mathematical functions |
- Excellent (95–100)
- Good (84–94)
- Fair (65–79)
- Marginal (45–65)
- Poor (0–44)
|
OIP
(2002)
|
9 |
pH, Turb., DO, BOD, hardness, TDS, TC, As, F− |
|
|
|
|
- Excellent (0–1)
- Acceptable (1–2)
- Slightly polluted (2–4)
- Polluted (4–8)
- Heavily polluted (8–16)
|
Liou
(2004)
|
13 |
main parameters: pH, DO, BOD5, NH3-N, SS, Turb., FC, Temp., toxic parameters,pH |
Environmental and health significance |
Parameters value used as sub-indicates |
Equal weights |
|
Not specified |
Said
(2004)
|
5 |
DO, TP, FC, Turb., S.Cond. |
Environmental significance |
Parameters value used as sub-indicates |
Equal weights |
Simple mathematical function |
- Highest purity (3)
- Marginal quality (<2)
- Poor quality (<1)
|
UWQI
(2009)
|
12 |
Cd, CN−, Hg, Se, As, F−, NO3−, DO, BOD, P, pH, TC |
Delphi |
Rating curve based sub-indexing system |
Unequal weights |
Multiplicative function |
- Excellent (95–100)
- Good (75–94)
- Fair (50–74)
- Marginal (25–49)
- Poor (0–24)
|
Hanh
(2010)
|
10
(at least)
|
SS, Turb,, DO, COD, BOD5, PO4, NH3-N, TC, Temp., toxicity, pH |
Monitoring data availability |
Rating curve based sub-indexing system and developed on Vietnamese WQ standards |
Equal weights |
Combination of additive and multiplicative means (basic WQ-overall WQ) |
- Excellent (91–100)
- Good (76–90)
- Fair (51–75)
- Marginal (26–50)
- Poor (<25)
|
Almeida
(2012)
|
9 |
pH, COD, NO3, PO4, detergents, enterococci, TC, FC, E. coli |
Delphi |
Rating curve based sub-indexing system and recommended by experts |
Unequal weights Sum of weights: 1 |
Multiplicative mathematical function |
- Excellent (91–100)
- Good (81–90)
- Medium (71–80)
- Poor (<70)
|
WJ
(2017)
|
13 |
Temp., SS, COD, DO, NO2−, TP, detergents, phenols, Cl−, Zn, Pb, Hg, FC |
Monitoring data availability and comparison standards |
Straight forward mathematical function with guideline value for generating sub-indexing |
AHP
Fixed/unequal weight values
Experts’ opinion
Sum of weights:1
|
Non equal geometric technique |
- Excellent (90–100)
- Good (90–75)
- Fair (75–50)
- Marginal (50–25)
- Poor (25–5)
|
Most indices use rating curves to directly convert parameters into sub-indices, often with unequal weights. However, certain indices, such as Dojildo, Liou, Said, and Hanh assign equal parameter weights, while others like CI and CCMEWQI do not consider parameter weights during their development () [
41,
48,
62,
65,
67,
71,
72].
WQIs have been used in several studies, depending on their characteristics and data availability. For example, WQI which includes NO
3 and other major anions and cations, as parameters, has been used for groundwater quality assessment, as they can depict nitrogen pollution [
137,
138,
139,
140,
141]. WQIs including major cations and anions are also mainly used to assess surface water as water resource for potable use [
142,
143].
Conceptualization, C.S.A. and P.A.; Methodology, C.S.A. and P.A.; Investigation, P.A.; Data Curation, P.A.; Writing—Original Draft Preparation, P.A.; Writing—Review & Editing, C.S.A.; Supervision, C.S.A.
Not applicable.
Not applicable.
Not applicable.
This research received no external funding.
The authors declare that they have no known competing financial interests or personal relationships that could have appeared to influence the work reported in this paper