1. Introduction
Forensic podiatry is a subfield within forensic sciences, human anatomy and biological anthropology that harnesses the expertise of the podiatry profession, systematically applying clinical and theoretical knowledge to comprehend the functions of the foot and its impressions, footwear, and bare footprints [
1]. As an important part of forensic podiatry, bare footprints, or unshod prints are frequently evidenced at diverse crime scenes, including property crimes (PCs) like burglaries and thefts, violent crimes (VCs) like murders, sexual assaults and kidnappings, and mass casualty incidents (MCIs) like earthquakes, floods, structure collapses, terrorist attacks, and transport accidents. It can be identified in various forms- such as partial, complete, or latent (not observable with the naked eye), in static (stationary) or dynamic (in motion) conditions [
2]. This involves the collection of the prints using dermatoglyphic techniques, including the use of inks, powders, and chemical methods, photographing visible prints with scale markers to facilitate detailed analysis, and using alternate light sources to lift latent prints. Forensic imaging techniques further advance this data collection process since footprints captured from Closed-Circuit Television (CCTV) footage positioned around the scene of the offense can provide important clues about an individual’s biological profile using Artificial Intelligence (AI) [
3,
4].
Correspondingly, bare footprints are documented through anthropometric and morphological analysis, considering both quantitative and qualitative characteristics. Depending on the source, position, and location of the footprints, as well as other circumstantial evidence, forensic podiatrists can derive valuable preliminary inferences about the suspect or victim [
1,
5]. These inferences can include the individual’s sex [
6,
7,
8], height [
9,
10,
11,
12], age [
12,
13], weight distribution [
14,
15,
16], gait patterns [
17,
18,
19] and morphological characters [
20,
21,
22]. Estimating these parameters depends on the forensic standards tailored to the specific requirements and the particular conditions under which the evidence was gathered. Out of these parameters, sexual dimorphism, the difference between males and females, is considered as the foundational criteria in framing the initial biological profile, as accurate estimation of an individual’s sex from DNA evidence, parts of human bone, and body impressions can help investigators narrow down the suspect pool almost to half [
23,
24,
25,
26].
Sex determination from bare footprints has been achieved by examining the density of ridges [
27], indices and angles [
28], and linear dimensions [
29]. Analysis using footprint dimensions involves morphometric calculations by forensic scientists, anatomists, and biological anthropologists since the late 20th century. Initially proposed by Gunn, other methods followed, such as Robbins’ diagonal and parallel axis methods, Smerecki and Lovejoy’s Overlay method, Winklemann and DiMaggio’s Optical Center method, and Rossi’s Podometrics system. Reel’s methodology has recently been standardized by the forensic agencies of the United Kingdom and several EU nations for its effectiveness in establishing biological profiles [
2,
30]. However, Robbins’ interpretation [
31] remains widely used by forensic experts for sex estimation across diverse ethnic groups globally, owing to its ease of understanding. The method includes length dimensions (Toe-1 to Toe-5 from mid-rear point of the heel) and width dimensions (Breadth at ball region and Breadth at heel region) of the print.
Predictions of sexual dimorphism from bare footprints are deemed effective, pertaining to the fact that the actual foot size is influenced by the overall body structure of humans [
2,
32]. The present review aims to discuss the advancements in sex estimation from bare footprint dimensions and discuss the implications of the findings to improve the evidential credibility of footprints as forensic evidence.
2. Review of Literature on Sex Estimation from Footprint Dimensions
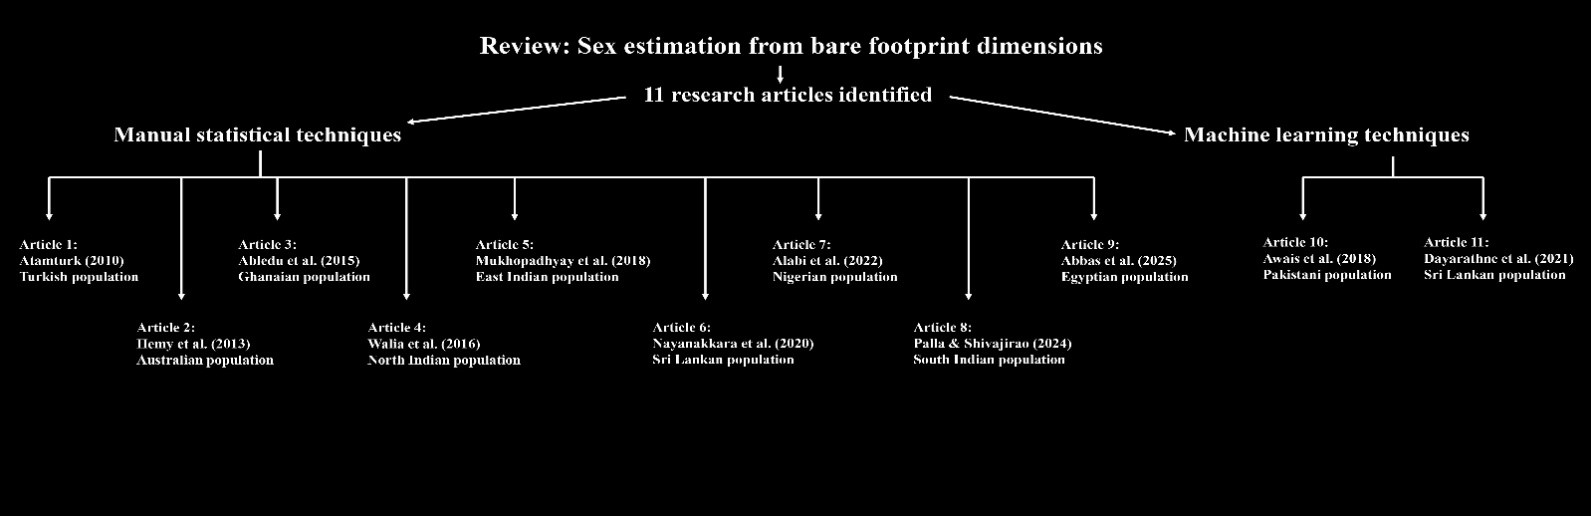
In the current review, 11 research articles have been identified that have focused on sex estimation from bare footprint dimensions across diverse demographic groups worldwide. Peer-reviewed original research papers with comprehensive utilization of anthropometric measurements and reliable statistical validations have been considered to reflect cross-cultural variability and ensure methodological rigor. depicts these investigations through a flowchart.
. Flowchart showing 11 selected studies [
6,
7,
8,
33,
34,
35,
36,
37,
38,
39,
40] on sex estimation from footprint dimensions that have been considered for the present review.
Atamturk [
7] conducted an anthropometric study involving a Turkish population sample of 506 subjects, divided between 253 males and 253 females, aged from 17.56 to 82.92 years. He analysed the potential of identifying an individual’s sex through footprints, foot dimensions, and shoe measurements, employing univariate and multivariate direct discriminant function models. From univariate models, he found that Footprint Length (toe-1) was the most accurate predictor of sex (79.8–85.0%), compared to Ball Breadth (73.9–75.1%) and Heel Breadth (65.1–68.4%). Furthermore, using a multivariate discriminant model, he accurately determined sex from footprint dimensions for approximately 83% of both males and females.
Hemy and her associates [
8] developed sex estimation standards by analyzing seven-footprint and three-foot measurements from a sample of 200 Western Australian population (90 males and 110 females) aged between 18–68 years. They utilized demarking points as well as stepwise and direct discriminant function analysis to classify sex from footprints. Their findings revealed that length measurements exhibited higher accuracy rates and lower variability (sex bias) compared to breadth measurements when evaluated using demarking points. Specifically, the Length of toe-3 (FPT3L) had the highest accuracy in correctly classifying males and females (86.7–91.8%), followed by the Length of toe-4 (FPT4L) (85.6–90.9%). They found an estimated sex classification accuracy of 89% using ‘leave one-out’ stepwise and direct discriminant analysis. The stepwise model identified the Length of toe-2 (FPT2L) and Footprint Breadth (FPB) as the best sex predictors, achieving a cross-validated accuracy range of 85.6–91.8%. The direct discriminant test further found that Length of toe-1 (FPT1L) and Footprint Breadth (FPB) were the best predictors, showing a cross-validated accuracy range of 86.7–90.9%.
Abledu et al. [
33] examined the reliability of sex prediction from linear footprint dimensions in a Ghanaian population with a sample size of 126 students (66 males and 60 females) aged between 18–30. They analysed seven dimensions (Toe-1 to Toe-5 lengths, Breadth at Ball, and Breadth at Heel). They used univariate and direct multivariate discriminant function analyses to classify sex from footprints. Univariate discriminant analysis revealed that Length of toe-5 of the left side (80.3–80.4%) and Breadth at the Ball of left (81.8–73.5%) and right side (80.3–71.7%) delivered the highest accuracy in sex classification. The multivariate discriminant function models further identified that Length of toe-5 and Breadth at the Heel for left footprints, with correct group memberships ranging 77.3% (for males) and 83.9% (for females), were retained as significant sex predictors. For right footprints, Length of toe-1, Breadth at Ball, and Breadth at Heel were identified as the best variables with a predictive accuracy of about 78.8% (for males) and 75.5% (for females) for distinguishing between both groups.
Walia and others [
34] examined sexual dimorphism using footprint and foot dimensions within the Jaat community of Haryana, North India. The study involved a sample of 400 individuals (200 males and 200 females) aged between 21 and 25 years. The regression analyses conducted revealed varying degrees of correlation between sex and footprint dimensions. Specifically, the
R2 values for Footprint Length (Toe-1) on both the left (0.0047) and right (0.0002) sides indicated minimal predictive accuracy for sex differentiation within this cohort. In contrast, the regression coefficients for Footprint Breadth (ball region) only on the right (
R2-7.793;
p-0.901) side demonstrated stronger predictive power, suggesting that the breadth dimension might be a more reliable indicator of sex in the studied population.
Mukhopadhyay et al. [
35] conducted a pilot study examining sexual dimorphism through linear footprint length measurements in 100 adult volunteers (47 males and 53 females) of Bengali ethnicity from West Bengal, Eastern India. The study employed direct discriminant function analysis, identifying the Length of toe-1 (F1) as the most significant predictor of sex, followed by the Lengths of toe-2 (F2) and toe-3 (F3). The analysis further revealed that 74.5% of males and 88.7% of females were correctly classified, and cross-validation demonstrated the robustness of the study with an overall accuracy rate of 82.0%.
Nanayakkara et al. [
36] conducted quantitative research on sex determination from footprint and foot dimensions among the Sinhalese ethnic population in Sri Lanka. Their study included a sample of 51 males and 66 females, all aged between 20 and 28 years. From each individual, seven bilateral linear measurements were taken, consisting of five length measurements (FPT1L-FPT5L) and two breadth measurements (FPB and FPHB). Univariate discriminant function analysis was used to predict group membership based on these footprint dimensions, revealing that for the right side, the variables FPT2L (with a cross-validated accuracy of 83.1–84.3%) and FPT1L (with a cross-validated accuracy of 80.0–84.3%) were the best predictors. For the left side, the variables FPT1L (with a cross-validated accuracy of 78.5–90.2%) and FPT2L (with a cross-validated accuracy of 81.5–82.4%) showed the best sex prediction reliability. Furthermore, the stepwise discriminant model revealed that combining the variables FPB and FPT1L for the right footprint achieved an average predictive accuracy of 83.6%. In contrast, for the left footprint, FPT2L (with an average cross-validated accuracy of 81.9%) proved to be a more reliable indicator for determining sex.
Alabi et al. [
37] established a sex estimation model through an analysis of footprint dimensions from a cohort of 421 individuals belonging to the Nupe ethnic group in Nigeria. This sample consisted of 283 males and 138 females aged 15 to 65 years. Their methodology involved using discriminant function analysis measuring the length (T1–T5) and breadth (Breadth at Ball and Breadth at Heel) dimensions of the toes, in addition to footprint indices. Among these measurements, they found RT1 (0.863), LT1 (0.85), RT2 (0.841), and LT2 (0.785) with the highest predictive capability for sex grouping. The model achieved a predictive accuracy of approximately 86.8% for males and 64.3% for females on the left side, and 90.7% for males and 67.1% for females on the right side.
Palla & Shivajirao [
6] employed anthropometric methods to ascertain sex from footprint dimensions within the Manipal region of South India. Their study involved a sample of 132 participants aged between 18 and 50. Five length and two breadth dimensions (T1–T5; Ball Breadth and Heel Breadth) were calculated using a measuring tape and conducted discriminant function analysis to determine group membership of the variables. The study revealed that T4 from the right side, with a canonical correlation coefficient of 0.867, and T4 from the left side, with a canonical correlation coefficient of 0.837, exhibited the strongest association with sex. The footprint dimensions facilitated sex prediction with an accuracy rate of 77% for males and 93% for females.
In a study conducted by Abbas et al. [
38], the researchers undertook a comparative analysis of the accuracy of footprints and palm prints for the determination of sex and stature. The study sample comprised 200 participants (100 males and 100 females) of Egyptian descent. The regression analysis results indicated that lengths of toe-4 (unstandardised coefficient- 0.107; Standard error- 0.064) and toe-5 (unstandardised coefficient- 0.140; Standard error- 0.070) emerged as the reliable predictors of sex for the right side. Similarly, T4 (unstandardised coefficient- 0.140; Standard error- 0.070) and T5 (unstandardised coefficient- 0.140; Standard error- 0.070) were found to be the best predictors for the left side. Further, they derived equations from the study sample for the right footprint that could predict male gender with a cut-off point of ≥0.4360, achieving 91.0% sensitivity and 88.0% specificity. Likewise, the left footprint could predict male gender with a cut-off point of ≥0.448, achieving 91.0% sensitivity and 88.0% specificity.
2.2. Using Machine Learning Techniques
Awais et al. [
39] used machine learning algorithms to determine sex from footprint dimensions, ratios and indices in randomly selected 142 males and 138 females of age range 18–50 from the Punjab region of Pakistan. They used diverse models like Naïve Bayes, Random Forest, Random Tree, REP Tree, and J48 algorithm for the purpose of sex classification. Based on a mixed model that grouped footprint toe-1 along with indices (Model-1), the left side showed that the Naïve Bayes algorithm had the highest overall accuracy rate at 87.8%, while the REP Tree algorithm had the lowest at 82.5%. Similarly, when parameters were grouped into another experimental model involving footprint lengths and ratios (Model-2), the Naïve Bayes algorithm again demonstrated the highest overall accuracy rate at 87.5%, while the Random Tree algorithm had the lowest at 82.8%. On the right side of Model-1, the Naïve Bayes and Random Tree algorithms had the highest (86.4%) and lowest (81%) overall sex predicting accuracy, respectively. In the case of Model-2, the REP Tree (85.7%) and Random Forest (85.7%) algorithms showed the best accuracy, while the J48 algorithm revealed the lowest accuracy rate at 81.7%.
Dayarathne et al. [
40] conducted a study to determine gender from footprints, foot and hand impressions using machine learning techniques such as Support Vector Machine (SVM), Naïve Bayes Algorithm, and Classification and Regression Trees (CART). The anthropometric study, which focused on a sample of 117 Sinhalese adults (51 males and 66 females) from Sri Lanka aged between 20 and 30 years, found that, when applying a model for footprint dimensions (FPT1-FPT5L, FPB and FPHB), and also including foot length and breadths, both the Support Vector Machine (SVM) and Naïve Bayes Algorithm achieved a gender prediction accuracy of 93.75%, while the CART algorithm demonstrated a higher accuracy of 95.83%.
3. Systematic Analysis on Sex Determination from Footprint Dimensions
Footprints, a frequently encountered identification marker at crime scenes, are critical for personal identification purposes. They have the potential to reduce the need for complex analyses like DNA profiling, as demonstrated in past forensic cases. Sex identification is a part of biological profiling that involves comparing ante-mortem podiatric records or population-level models with the dimensions, ridge formations, or any deformities observed in the recovered prints [
2].
The reviewed studies collectively underscore variability in sex determination accuracy of bare footprint dimensions across different populations (). Several trends and constraints can be inferred from the studies that have employed manual statistical techniques. For example, Palla & Shivajirao’s study [
6] exhibited the highest sex predictive accuracy among all the studies, followed by Hemy’s investigation [
8], which showed predictive accuracy of around 86.7% in males and 91.8% in females, with the Length of toe-3 (FPT3L) being the most accurate predictor. Similarly, the Nupe tribal population of Nigeria [
37] showed high sex predictive capability, with Length of toe-1 yielding accuracy rates of 86.8% for males and 64.3% for females. In the Sinhalese population of Sri Lanka [
36], the length of toe-2 was identified as the best predictor of sex, achieving cross-validated accuracy rates of up to 84.3%. In the Bengali community of India [
35], Length of toe-1 was the most significant predictor, with an overall accuracy rate of 82.0%. In the Turkish population [
7], high predictive accuracy for Footprint Length (toe-1) was found, ranging from 79.8% to 85.0%. In the Ghanaian population [
33], Length of toe-5 and Ball Breadth were identified as top predictors, with accuracy rates ranging from 80.3% (males) to 81.8% (females). Lengths of toe-4 and toe-5 were deemed reliable predictors for sex determination in the Egyptian population [
38], achieving high sensitivity and specificity. However, these studies utilize samples from communities that are geographically distinct, such as Turkish, Western Australians, Indian groups, etc., which may limit the applicability of their findings to other populations worldwide and even to populations residing nearby. Furthermore, variations in sample sizes (from as low as 51 subjects to as high as 506 subjects) and measurement protocols between these studies introduce variability (Univariate, Multivariate, Direct, and Stepwise Discriminant Function Analysis, Demarking Points, and Regression models), implying that while the statistical results are promising, methodological differences and potential biases in measurements must be carefully weighed when comparing results.
.
Overview of the demographic samples, statistical methodologies and key results across the selected studies.
| Reference |
Population & Sample |
Statistical Techniques |
Key Findings |
| Manual statistical techniques |
|
| Atamturk [7] |
Turkish population; 506 subjects (253 males, 253 females); 17.56–82.92 years |
Univariate & Multivariate Direct Discriminant Function Analysis |
Univariate DFA: Toe-1 best (79.8–85.0%); Multivariate DFA: ~83% accurate for both sexes |
| Hemy et al. [8] |
Western Australian population; 200 subjects (90 males, 110 females); 18–68 years |
Demarking points, Stepwise & Direct Discriminant Function Analysis |
FPT3L: 86.7–91.8% and FPT4L: 85.6–90.9% best; Overall classification accuracy ~ 89% via leave-one-out analysis |
| Abledu et al. [33] |
Ghanaian population; 126 subejcts (66 males, 60 females); 18–30 years |
Univariate & Multivariate Discriminant Function Analysis |
Univariate: Left toe-5 and ball breadth highest (~80%); Multivariate: Left (77.3–83.9%) and Right (75.5–78.8%) |
| Walia et al. [34] |
North Indian population; 400 subjects (200 males, 200 females); 21–25 years |
Regression analysis |
Minimal predictive power from Toe-1 (R² nearly zero); right foot breadth (ball region) showed stronger prediction |
| Mukhopadhyay et al. [35] |
East Indian population; 100 subjects (47 males, 53 females) |
Direct Discriminant Function Analysis |
Toe-1 most significant predictor; (74.5–88.7%) accuracy, with 82% overall cross-validated accuracy |
| Nayanakkara et al. [36] |
Sri Lankan population; 117 subjects (51 males, 66 females); 20–28 years |
Univariate and Stepwise Discriminant Function Analysis |
Right: FPT2L (83.1–84.3%), FPT1L (80.0–84.3%); Left: FPT1L (78.5–90.2%), FPT2L (81.5–82.4%); Combined models yield ~ 83.6% and ~81.9% accuracy |
| Alabi et al. [37] |
Nigerian population; 421 subjects (283 males, 138 females); 15–65 years |
Discriminant Function Analysis |
Best predictors: RT1, LT1, RT2, and LT2; Left: males 86.8% and females 64.3%; Right: males 90.7% and females 67.1% accurate |
| Palla & Shivajirao [6] |
South Indian population; 132 subjects;
18–50 years
|
Discriminant Function Analysis |
T4 best predictor; Accuracy: 77% for males, 93% for females |
| Abbas et al. [38] |
Egyptian population; 200 subjects (100 males, 100 females) |
Regression analysis |
Right footprint cutoff ≥ 0.4360 and left ≥ 0.448 achieving ~91% sensitivity and ~88% specificity |
| Machine learning techniques |
|
| Awais et al. [39] |
Pakistani population; 280 subjects (142 males, 138 females); 18–50 years |
Machine learning algorithms (Naïve Bayes, Random Forest, Random Tree, REP Tree, J48) across 2 experimental models |
Model-1: Left—Naïve Bayes highest (87.8%), REP Tree lowest (82.5%); Right—Naïve Bayes best (86.4%), Random Tree lowest (81%); Model-2 similar range (85.7–87.5%) |
| Dayarathne et al. [40] |
Sri Lankan population; 117 subjects (51 males, 66 females); 20–30 years |
Machine learning algorithms (SVM, Naïve Bayes, CART) |
SVM and Naïve Bayes: 93.75% accuracy; CART: 95.83% accuracy |
The reviewed studies used various analytical models to determine sex from footprint dimensions. Notably, out of the 11, only two studies were found that employed machine learning techniques, and one of them demonstrated higher accuracy rates in comparison to other similar studies,
i.e., Dayarathne et al. [
40] used models such as Classification and Regression Trees (CART), Support Vector Machine (SVM), and Naïve Bayes Algorithm to predict gender, achieving up to 95.83% accuracy with the CART algorithm. Manual analytical methods were found to be more frequently used, with discriminant function analysis being the most common approach. For example, Nanayakkara et al. [
36] and Palla & Shivajirao [
6] employed multivariate stepwise DFA, while Mukhopadhyay et al. [
35] utilized direct DFA. Hemy et al. [
8] used both stepwise and direct DFA, in addition to demarking points for sex estimation while regression analyses were found being conducted in two studies [
34,
38] to establish sexual dimorphism standards. Despite achieving higher accuracy rates than manual statistical techniques, identical limitations can be found in machine learning investigations. The use of relatively small datasets (ranging from 117 to 280 subjects) and ethnically homogeneous datasets (Pakistani and Sri Lankan populations) raises questions about the application of the findings in forensic investigations.
4. Inferences and Conclusions
The study of bare footprints for sex estimation has evolved with various analytical methodologies since the early 21st century. The reviewed studies depict that the accuracy of sex estimation from footprints varies across different populations and varying best predictors. This inference echoes a widely accepted principle in forensic anthropology that there is a persistent variation in geographical, genetics, habitual movements and environmental factors that shape the development of foot morphology in each population [
2] through covering populations from various countries, including Turkey, Australia, Ghana, Nigeria, India, Pakistan, Sri Lanka and Egypt in the present review. However, potential biases such as population specificity and measurement errors must be recognized in these type of studies, as they may significantly influence the reliability of sex estimation methods.
The present study advocates for the application of machine learning techniques in sex estimation from footprint dimensions, highlighting their higher accuracy compared to manual analytical methods. Notably, Dayarathne et al. [
40] employed machine learning algorithms, such as Classification and Regression Trees (CART), Support Vector Machine (SVM), and the Naive Bayes Algorithm. Among these, the CART algorithm achieved the highest accuracy rate of up to 95.83%. Deep learning methods such as neural networks can also serve as an alternative approach alongside the application of machine learning techniques in forensic podiatry, as Parlak and his associates’ research [
41] based on anatomical dimensions of foot structures in a Turkish population achieved a differentiation accuracy of 98.6% for males and 96.9% for females through Artificial Neural Network (ANN) and Hassan et al. [
42] achieved a sex predicting accuracy of 86.07% by applying Convolutional Neural Network (CNN) models in a sample size of 100,000 shoeprints. These computed algorithms have significantly advanced other domains of forensic sciences, too- such as cyber forensics, pattern evidence analysis like fingerprints and bite marks, facial recognition systems, and digital forensics [
43,
44]. Thus, integrating machine and deep learning techniques with larger datasets will improve accuracy and open new avenues for analyzing complex data and developing both population-specific and heterogenous predictive policing models in the analysis of bare footprints.
The present study finds this significant gap and suggests more research should be done focusing on refining these algorithms and exploring their applicability across diverse populations to establish standardization, not only from static and in-motion footprint dimensions but also through ridge density, ratios, and indices, thus consequently enhancing the reliability and precision of forensic podiatry during medico-legal investigations.
Author Contributions
S.S. (Saumya Seal): Conceptualization, Literature search, Draft preparation, Review and editing, Final approval; S.S. (Suryakant Soni): Draft preparation, Review and editing, Final approval.
Ethics Statement
Not applicable.
Informed Consent Statement
Not applicable.
Funding
This research received no external funding.
Declaration of Competing Interest
The authors declare that they have no known competing financial interests or personal relationships that could have appeared to influence the work reported in this paper.
References
1.
Nirenberg MS, Saxelby J, Vernon R, Vernon W. The Application of Forensic Podiatry to Clinical Practice.
J. Am. Pod. Med. Assoc. 2020,
110, 9. doi:10.7547/19-010.
[Google Scholar]
2.
Krishan K, Kanchan T, DiMaggio JA. Emergence of forensic podiatry—a novel sub-discipline of forensic sciences.
Forensic Sci. Int. 2015,
255, 16–27. doi:10.1016/j.forsciint.2015.06.012.
[Google Scholar]
3.
Nirenberg MS, Ansert E, Krishan K, Kanchan T. Two-dimensional linear analysis of dynamic bare footprints: A comparison of measurement techniques.
Sci. Justice 2019,
59, 552–557. doi:10.1016/j.scijus.2019.03.008.
[Google Scholar]
4.
Vernon W, Reel S, Howsam N. Examination and Interpretation of Bare Footprints in Forensic Investigations.
Res. Rep. Forensic Med. Sci. 2020,
10, 1–14. doi:10.2147/RRFMS.S241264.
[Google Scholar]
5.
Kapoor N, Kamble A, Badiye A. Forensic Podiatry: An Introduction. In Textbook of Forensic Science, 1st ed.; Shrivastava P, Lorente JA, Srivastava A, Badiye A, Kapoor N, Eds.; Springer: Singapore, 2023. doi:10.1007/978-981-99-1377-0_10.
6.
Palla S, Shivajirao A. Anthropometric examination of footprints in South Indian population for sex estimation.
Forensic Sci. Int. Rep. 2024,
9, 100354. doi:10.1016/j.fsir.2024.100354.
[Google Scholar]
7.
Atamturk D. Estimation of sex from the dimensions of foot, footprints, and shoe.
Anthropol. Anz. 2010,
68, 21–29.
[Google Scholar]
8.
Hemy N, Flavel A, Ishak NI, Franklin D. Sex estimation using anthropometry of feet and footprints in a Western Australian population.
Forensic Sci. Int. 2013,
231, 402.e1–402.e6. doi:10.1016/j.forsciint.2013.05.029.
[Google Scholar]
9.
Reel S, Rouse S, Obe WV, Doherty P. Estimation of stature from static and dynamic footprints.
Forensic Sci. Int. 2012,
219, 283.e1–283.e5. doi:10.1016/j.forsciint.2011.11.018.
[Google Scholar]
10.
Kanchan T, Krishan K, ShyamSundar S, Aparna KR, Jaiswal S. Analysis of footprint and its parts for stature estimation in Indian population.
Foot 2012,
22, 175–180. doi:10.1016/j.foot.2012.02.010.
[Google Scholar]
11.
Wiseman AL, De Groote I. One size fits all? Stature estimation from footprints and the effect of substrate and speed on footprint creation.
Anat. Rec. 2022,
305, 1692–1700. doi:10.1002/ar.24833.
[Google Scholar]
12.
Singh P, Yadav B. Age, sex and stature estimation from footprint dimensions.
Arab. J. Forensic Sci. Forensic Med. 2017,
1. doi:10.26735/16586794.2017.018.
[Google Scholar]
13.
Forriol F, Pascual J. Footprint analysis between three and seventeen years of age.
Foot Ankle 1990,
11, 101–104. doi:10.1177/107110079001100208.
[Google Scholar]
14.
Krishan K. Establishing correlation of footprints with body weight—forensic aspects.
Forensic Sci. Int. 2008,
179, 63–69. doi:10.1016/j.forsciint.2008.04.015.
[Google Scholar]
15.
Fawzy IA, Kamal NN. Stature and body weight estimation from various footprint measurements among Egyptian population.
J. Forensic Sci. 2010,
55, 884–888. doi:10.1111/j.1556-4029.2010.01372.x.
[Google Scholar]
16.
Caplova Z, Švábová P, Fuchsová M, Masnicová S, Neščáková E, Bodoriková S, et al. Estimation of stature and body weight in Slovak adults using static footprints: a preliminary study.
Leg. Med. 2018,
34, 7–16. doi:10.1016/j.legalmed.2018.07.002.
[Google Scholar]
17.
Wilkinson MJ, Menz HB. Measurement of gait parameters from footprints: a reliability study.
Foot 1997,
7, 19–23. doi:10.1016/S0958-2592(97)90005-5.
[Google Scholar]
18.
Titianova EB, Mateev PS, Tarkka IM. Footprint analysis of gait using a pressure sensor system.
J. Electromyogr. Kinesiol. 2004,
14, 275–281. doi:10.1016/S1050-6411(03)00077-4.
[Google Scholar]
19.
Sun K, Luo Y. A preliminary study on the stability of bare footprint linear measurements in four motion states.
Sci. Justice 2024,
64, 549–556. doi:10.1016/j.scijus.2024.08.006.
[Google Scholar]
20.
Krishan K. Individualizing characteristics of footprints in Gujjars of north India—forensic aspects.
Forensic Sci. Int. 2007,
169, 137–144. doi:10.1016/j.forsciint.2006.08.006.
[Google Scholar]
21.
Moorthy TN, Sulaiman SFB. Individualizing characteristics of footprints in Malaysian Malays for person identification from a forensic perspective.
Egypt. J. Forensic Sci. 2015,
5, 13–22. doi:10.1016/j.ejfs.2014.04.003.
[Google Scholar]
22.
Švábová P, Hanzelyová K, Chovancová M, Masnicová S, Beňuš R. The importance of assessing the ghosting phenomenon in dynamic footprints when estimating stature–Forensic implications.
Sci. Justice 2024,
64, 322–332. doi:10.1016/j.scijus.2024.04.004.
[Google Scholar]
23.
Butler E, Li R. Genetic markers for sex identification in forensic DNA analysis.
J. Forensic Investig. 2014,
2, 10.
[Google Scholar]
24.
White TD, Folkens PA. The Human Bone Manual, 1st ed.; Elsevier Academic Press: Oxford, UK, 2005. doi:10.1016/C2009-0-00102-0.
25.
Das D, Seal S, Pal S, Chitara N, Meena R, Guleria A, et al. Sexual dimorphism and topological variability in fingerprint ridge density in a north-west Indian population.
Sci. Nat. 2024,
111, 23. doi:10.1007/s00114-024-01911-x.
[Google Scholar]
26.
Vijay P, Rakesh M. Detection of Footprint Impressions at the Scene of Crime-A Review.
J. Forensic Sci. Crim. Investig. 2022,
15, 555919. doi:10.19080/JFSCI.2022.15.555919.
[Google Scholar]
27.
Kanchan T, Krishan K, Aparna KR, Shyamsunder S. Footprint ridge density: a new attribute for sexual dimorphism.
HOMO 2012,
63, 468–480. doi:10.1016/j.jchb.2012.09.004.
[Google Scholar]
28.
Kanchan T, Krishan K, Prusty D, Machado M. Heel–Ball index: An analysis of footprint dimensions for determination of sex.
Egypt. J. Forensic Sci. 2014,
4, 29–33. doi:10.1016/j.ejfs.2014.02.002.
[Google Scholar]
29.
Suleiman MO, Danborno B, Musa SA, Timbuak JA. Sexual dimorphism and determination using foot outlines, foot print angles, and foot indices.
Forensic Sci. Med. Pathol. 2024,
20, 614–626. doi:10.1007/s12024-023-00711-5.
[Google Scholar]
30.
Mukhra R, Krishan K, Kanchan T. Bare footprint metric analysis methods for comparison and identification in forensic examinations: A review of literature.
J. Forensic Leg. Med. 2018,
58, 101–112. doi:10.1016/j.jflm.2018.05.006.
[Google Scholar]
31.
Robbins LM. Footprints—Collection, Analysis and Interpretation, 1st ed.; Charles C. Thomas: Springfield, IL, USA, 1985.
32.
Seal S, Sahani R, Das D, Pal S, Guleria A, Chitara N, et al. Anthropometric measures to evaluate sex and stature from foot dimensions in a population of North-west India.
Eur. J. Anat. 2025,
29, 181–191. doi:10.52083/UJQE5909.
[Google Scholar]
33.
Abledu JK, Abledu GK, Offei EB, Antwi EM. Determination of sex from footprint dimensions in a Ghanaian population.
PloS ONE 2015,
10, e0139891. doi:10.1371/journal.pone.0139891.
[Google Scholar]
34.
Walia S, Modi BS, Puri N. Sexual dimorphism from foot dimensions and foot prints in Haryanvi Jat population.
Int. J. Anat. Res. 2016,
4, 2142–2147. doi:10.16965/ijar.2016.165.
[Google Scholar]
35.
Mukhopadhyay PP, Das SP, Chowdhuri S. Determination of Sex from Footprint Dimensions in Contemporary Indian Bengali Population: A Pilot Study.
Arab. J. Forensic Sci. Forensic Med. 2018,
1, 820–828. doi:10.26735/16586794.2018.009.
[Google Scholar]
36.
Nanayakkara D, Nandasena T, Nawarathna LS, Ariyasinghe S, Arambawatta K, Alahakoon S. Determination of sex by foot and footprint dimensions in the Sinhalese population of Sri Lanka.
Transylv. Rev. 2020,
XXVII, 15449–15556.
[Google Scholar]
37.
Alabi AS, Aniyikaye A, Odunnaike OO, Adunmo GO. DETERMINATION OF SEX FROM FOOTPRINT DIMENSIONS AMONG NUPE ETHNIC GROUP IN MINNA NIGER STATE.
Era J. Med. Res. 2022,
9, 156–163.
[Google Scholar]
38.
Abbas SG, Abdelrahman AE, El-Oefy OS. The comparative accuracy of handprints and footprints for stature and sex determination.
Forensic Sci. Int. Synerg. 2025,
10, 100572. doi:10.1016/j.fsisyn.2025.100572.
[Google Scholar]
39.
Awais M, Naeem F, Rasool N, Mahmood S. Identification of sex from footprint dimensions using machine learning: A study on population of Punjab in Pakistan.
Egypt. J. Forensic Sci. 2018,
8, 72. doi:10.1186/s41935-018-0106-2.
[Google Scholar]
40.
Dayarathne S, Nawarathna LS, Nanayakkara D. Determination gender using foot, footprint, hand and hand print measurements in a Sinhalese population in Sri Lanka using supervised learning techniques.
Comput. Methods Programs Biomed. Update 2021,
1, 100017. doi:10.1016/j.cmpbup.2021.100017.
[Google Scholar]
41.
Parlak ME, Özkul BB, Oruç M, Celbiş O. Sex and stature estimation from anthropometric measurements of the foot: Linear analyses and neural network approach on a Turkish sample.
Egypt. J. Forensic Sci. 2024,
14, 18. doi:10.1186/s41935-024-00391-4.
[Google Scholar]
42.
Hassan M, Wang Y, Wang D, Li D, Liang Y, Zhou Y, et al. Deep learning analysis and age prediction from shoeprints.
Forensic Sci. Int. 2021,
327, 110987. doi:10.1016/j.forsciint.2021.110987.
[Google Scholar]
43.
Carriquiry A, Hofmann H, Tai XH, VanderPlas S. Machine learning in forensic applications.
Significance 2019,
16, 29–35. doi:10.1111/j.1740-9713.2019.01252.x.
[Google Scholar]
44.
Khan H, Hanif S. A survey of machine learning applications in digital forensics.
Trends Comput. Sci. Inf. Technol. 2021,
6, 020–024. doi:10.17352/tcsit.000034.
[Google Scholar]
 Suryakant Soni
2
Suryakant Soni
2